

Fibrotic enzymes modulate wound-induced skin tumorigenesis
- PMID: 33780134
- PMCID: PMC8097359
- DOI: 10.15252/embr.202051573
Fibrotic enzymes modulate wound-induced skin tumorigenesis
Abstract
Fibroblasts are a major component of the microenvironment of most solid tumours. Recent research elucidated a large heterogeneity and plasticity of activated fibroblasts, indicating that their role in cancer initiation, growth and metastasis is complex and context-dependent. Here, we performed genome-wide expression analysis comparing fibroblasts in normal, inflammatory and tumour-associated skin. Cancer-associated fibroblasts (CAFs) exhibit a fibrotic gene signature in wound-induced tumours, demonstrating persistent extracellular matrix (ECM) remodelling within these tumours. A top upregulated gene in mouse CAFs encodes for PRSS35, a protease capable of collagen remodelling. In human skin, we observed PRSS35 expression uniquely in the stroma of high-grade squamous cell carcinomas. Ablation of PRSS35 in mouse models of wound- or chemically-induced tumorigenesis resulted in aberrant collagen composition in the ECM and increased tumour incidence. Our results indicate that fibrotic enzymes expressed by CAFs can regulate squamous tumour initiation by remodelling the ECM.
Keywords: PRSS35; cancer-associated fibroblasts; fibrosis; skin cancer; wound healing.
© 2021 The Authors.
Conflict of interest statement
The authors declare that they have no conflict of interest.
Figures
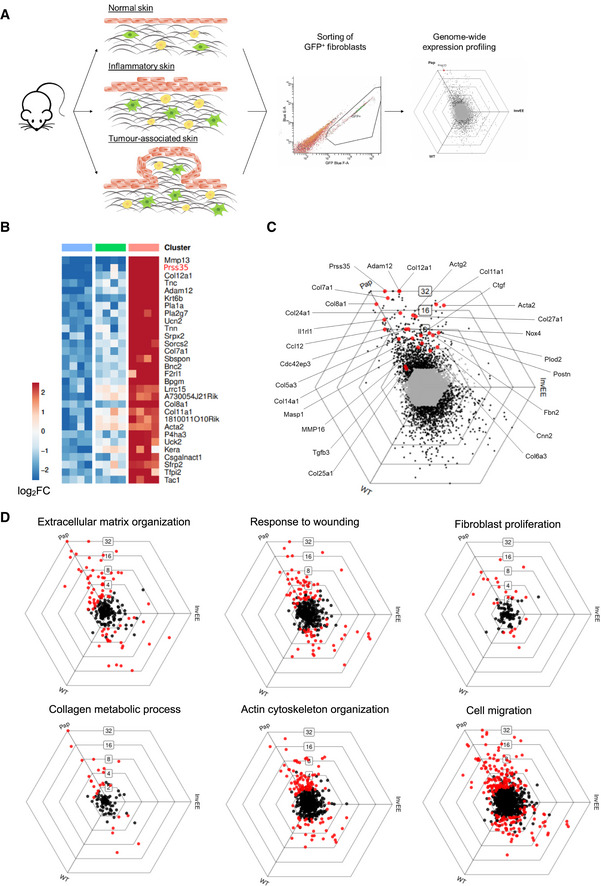
Schematic representation of experimental set‐up for genome‐wide fibroblast expression profiling.
Heat map depicting mean expression of the top 20 upregulated genes of fibroblast isolated from wound‐induced tumours (Pap) compared to fibroblasts from wild‐type (WT) and inflamed (InvEE) back skin (n = 3 per condition). PRSS35 is indicated in red as a top upregulated gene in CAFs.
To visualize DEGs between subsets of fibroblasts sorted from homeostatic (WT), inflamed (InvEE) or tumour‐associated (Pap) skin, each gene was plotted in a hexagonal triwise diagram in which the position of a point represents the relative increased expression in one or two populations, whereas the distance from the origin represents the magnitude of expression. Genes that are 32‐fold or more upregulated are plotted on the outer grid line. Grey dots in the centre of the triwise plot represent genes that are not differentially expressed. Genes associated with a fibrotic response are depicted in red.
Hexagonal triwise plots of genes belonging to the respective gene ontology (GO) term, which were among the highest upregulated GO terms. Dots in red represent genes that are differentially expressed between the three conditions.
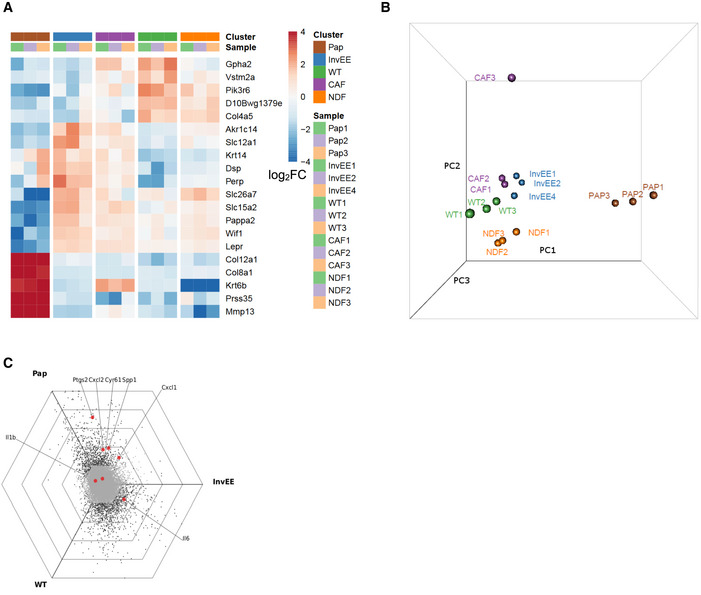
Combined clustering of our dataset (WT: normal skin, InvEE: inflammatory skin and Pap: wound‐induced papillomas) and the dataset obtained by Erez et al (NDF: normal dermal fibroblasts and CAF: cancer‐associated fibroblasts) based on global differential gene expression.
Principle component analysis of our dataset and the dataset from Erez et al purple: CAF, orange: NDF, blue: InvEE, green: WT and brown: Pap).
Hexagonal triwise plot showing the pro‐inflammatory gene signature, determined by Erez et al and mapped on our gene expression analysis. (Ptgs2 = Cox2, SPP1 = Osteopontin, Cyr61 = CCN1).
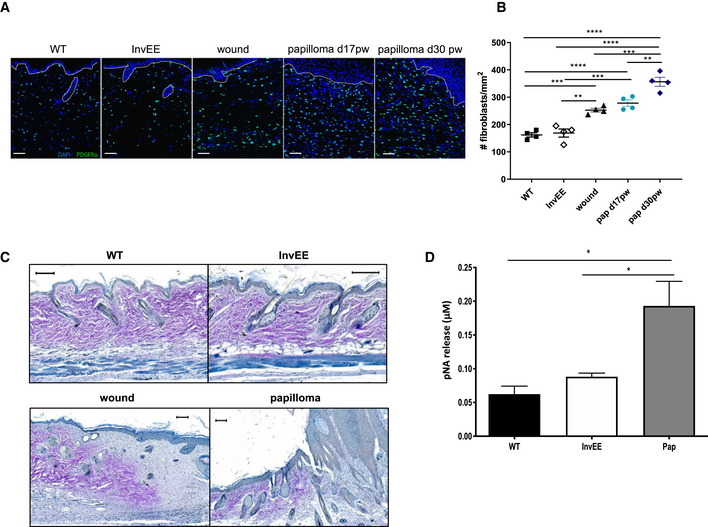
Immunofluorescent images of skin sections from PDGFRα‐eGFP reporter mice with normal (WT, n = 4), inflamed (InvEE, n = 4), wounded (d14 post‐wounding; wound, n = 4) or tumour‐associated (Papilloma, Pap d17 and d30 post‐wounding, n = 4 per condition) skin. Nuclei were stained with Dapi (4’, 6‐diamidino‐2‐phenylindole; blue). Dotted line represents epidermal–dermal boundary. Scale bars: 50 µm.
Quantification of the number of fibroblasts present in different skin conditions (n = 4 mice per condition; **P < 0.01; ***P < 0.001; ****P < 0.0001; One‐way ANOVA testing). Data represent means of multiple microscopic fields ± SEM.
Herovici staining of sections of normal (WT), inflamed (InvEE), wound or tumour‐associated (Papilloma) skin. Immature collagen is stained blue and mature collagen is stained purple. Scale bars: 100 µm.
pNA (p‐nitroaniline) release assessed by spectrophotometric analysis as a measure of serine protease activity in normal (WT, n = 5), inflamed (InvEE, n = 5) and tumour‐associated (Pap, n = 7) skin. (*P < 0.05; one‐way ANOVA testing). Data represent means ± SEM.
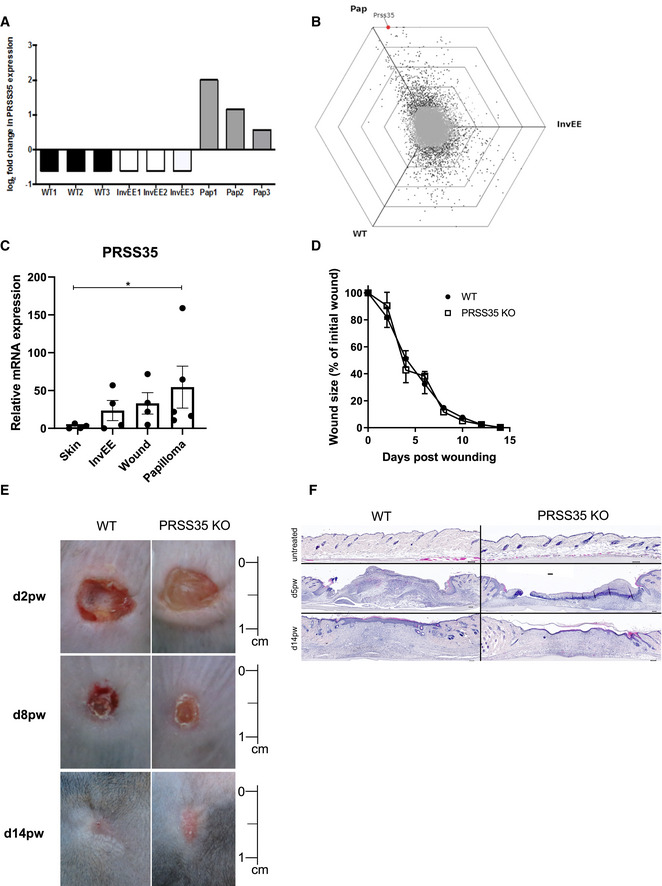
Log2 fold change of probe intensities of PRSS35 gene expression in different subsets of dermal fibroblasts observed in Affymetrix GeneChip® Mouse 430 2.0 array (n = 3 per condition).
Hexagonal triwise plot depicting the PRSS35 gene expression level.
Relative mRNA levels of PRSS35 in lysates from normal skin (WT, n = 4 mice), inflamed skin (InvEE, n = 4 mice), wounds (d14pw, n = 4 mice) and wound‐induced papillomas (Pap, n = 5 mice). (*P = 0.0159; Mann–Whitney test). Data represent means of three technical replicates ± SEM.
Wound healing dynamics of wild‐type (WT, n = 10) and PRSS35−/− (n = 11) mice after full‐thickness wounding with an 8‐mm punch biopsy. Wound size expressed as percentage of initial wound size (ns; Wilcoxon matched‐pairs signed rank test). Data represent means ± SEM.
Representative pictures of back skin of WT and PRSS35−/− mice at different days post‐wounding (dpw). Scale bar: 1 cm.
H&E‐stained skin sections of WT and PRSS35−/− wounds at different days post‐wounding. Scale bars: 100 µm.
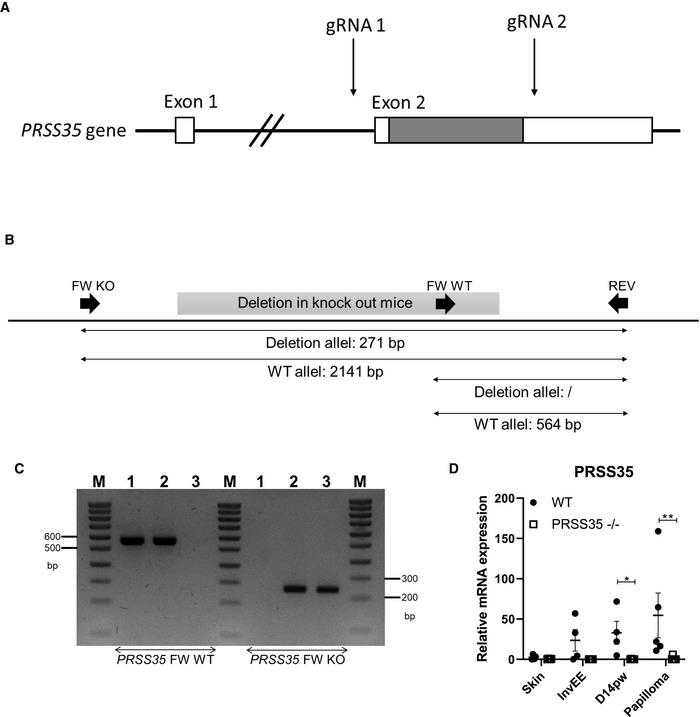
Positioning of CRISPR‐Cas gRNAs on the PRSS35 gene. The sequence between the two gRNAs was deleted upon cleavage by CRISPR‐Cas9 at the site of the gRNAs. The coding region is shaded.
Genotyping strategy for detection of the presence or absence of PRSS35. Schematic representation of the primer bindings sites used.
An agarose gel image for PRSS35 genotyping. M: Ladder, 1‐3: genomic DNA extracted from tails from a WT, PRSS35 heterozygous and PRSS35 KO mouse.
Relative mRNA expression levels of PRSS35 in tissue isolated from WT and PRSS35−/− mice (n ≥ 4 per condition; *P < 0.05, **P < 0.01; Mann–Whitney test).
- A
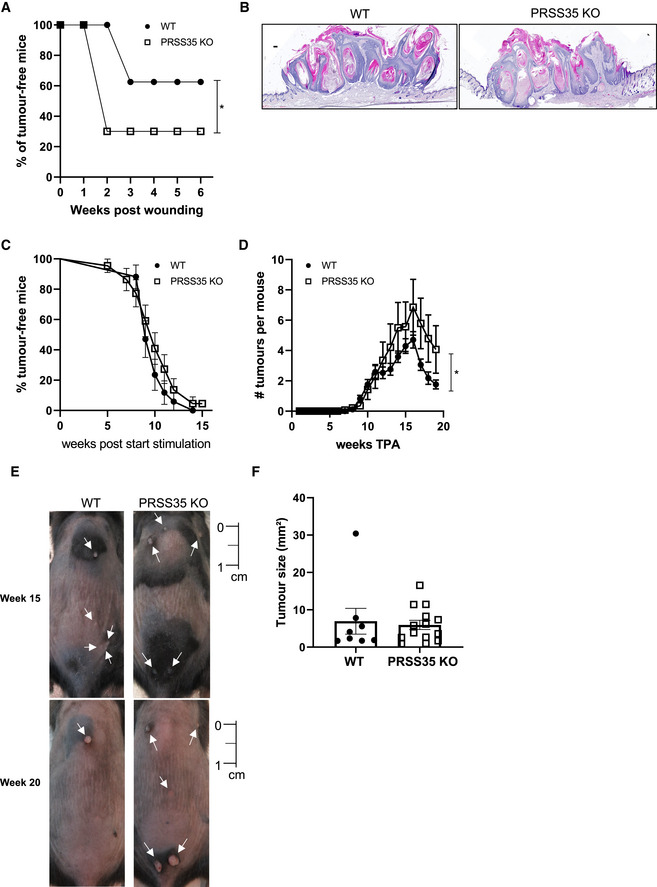
Incidence of wound‐induced papilloma formation in InvEE PRSS35+/+ (WT; n = 8) and InvEE PRSS35−/− (PRSS35 KO; n = 10) mice at site of wounding. (*P = 0.0218; Gehan–Breslow–Wilcoxon test).
- B
H&E‐stained skin sections of wound‐induced papillomas of InvEE PRSS35+/+ and InvEE PRSS35−/− mice. Scale bars: 100 µm.
- C, D
Incidence of papilloma formation (ns: non‐significant; Gehan–Breslow–Wilcoxon test) (C) and number of tumours per mouse (D) in wild‐type (WT, n = 17) and PRSS35 KO (n = 22) mice treated with DMBA‐TPA (*P = 0.0171; Wilcoxon matched‐paired rank test). Data represent means ± SEM.
- E
Representative pictures of the back skin of WT and PRSS35 KO mice undergoing the DMBA‐TPA treatment at week 15 and week 20 after the start of TPA treatment. White arrows indicate tumours. Scale bar: 1 cm.
- F
Tumour size at week 20 after the start of TPA treatment. The biggest tumour of each mouse was measured (WT; n = 8; KO; n = 14; ns: Mann–Whitney test). Data represent means ± SEM.
- A
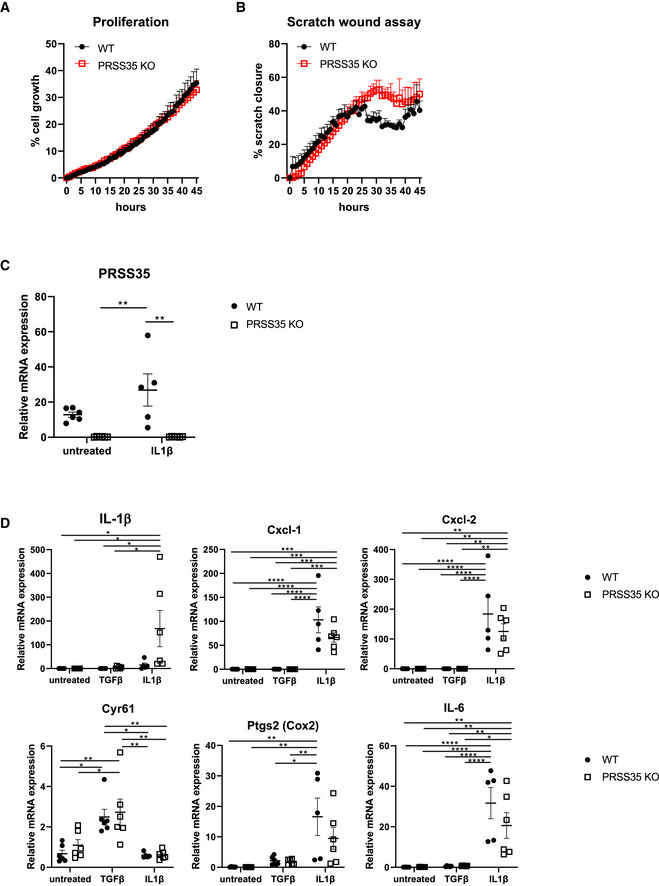
Cell proliferation assay on PRSS35 WT and PRSS35 KO primary fibroblasts, as measured through live cell imaging (n = 3 biological replicates per condition, ns, Wilcoxon matched‐paired rank test). Data represent means ± SEM
- B
Scratch wound assay of PRSS35 WT and PRSS35 KO primary fibroblasts. Scratch width was measured over time with live cell imaging (n = 3 per condition, ns, Wilcoxon matched‐paired rank test). Data represent means ± SEM
- C, D
Relative RNA expression of the indicated genes in primary fibroblast isolated from WT and PRSS35 KO mice, untreated or after 24 h stimulation with 10 ng/ml TGF‐β (n = 6 per genotype) or 20 ng/ml IL‐1β (WT, n = 5; PRSS35 KO, n = 6) (*P < 0.05, **P < 0.01, ***P < 0.001, ****P < 0.0001; two‐way ANOVA with multiple comparisons). Data represent means ± SEM.
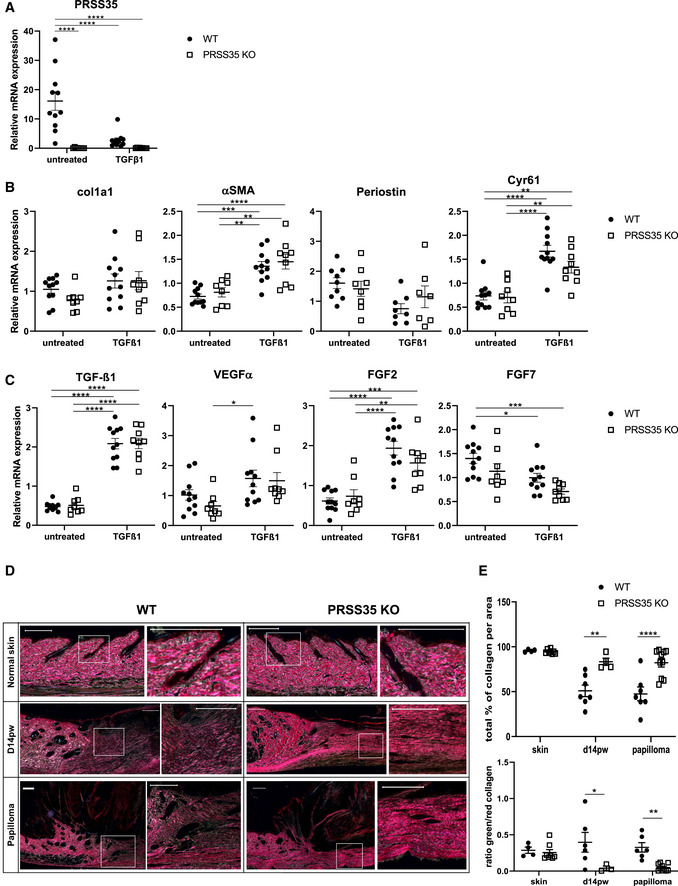
Relative mRNA expression levels of PRSS35 in primary fibroblast cultures isolated from WT and PRSS35 KO mice, untreated or after 24 h stimulation with 10 ng/ml TGF‐β1 (n > 8 biological replicates per condition) (****P < 0.0001; two‐way ANOVA with multiple comparisons). Data represent means of three technical replicates ± SEM.
Relative mRNA expression levels of the indicated ECM genes in primary fibroblast cultures (col1a1: collagen type 1 alpha 1; αSMA, alpha‐smooth muscle actin; Cyr61: Cysteine‐rich angiogenic inducer 61 (=CCN1)) in primary fibroblast cultures isolated from WT and PRSS35 KO mice, untreated or after 24 h stimulation with 10 ng/ml TGFβ1 (n ≥ 7 biological replicates per condition) (**P < 0.01, ***P < 0.001, ****P < 0.0001; two‐way ANOVA with multiple comparisons). Data represent means of three technical replicates± SEM.
Relative mRNA expression levels of the indicated cytokines/growth factors in primary fibroblast cultures (n ≥ 8 per condition) (VEGF‐α, vascular endothelial growth factor‐alpha; FGF2: basic fibroblast growth factor; FGF7: keratinocyte growth factor) (*P < 0.05, **P < 0.01, ***P < 0.001, ****P < 0.0001; two‐way ANOVA with multiple comparisons). Data represent means of three technical replicates ± SEM.
Picrosirius red staining of normal skin, day 14 post‐wounding (d14pw) skin or wound‐induced papillomas from WT and PRSS35 KO mice. Red colouring indicates thick fibres, green colouring indicates thin fibres. Scale bars: 200 µm.
Quantification of picrosirius red staining as total collagen density (upper panel) and ratio of red versus green picrosirius staining (lower panel). Using QuPath Bioimage analysis software pixels colouring red or green were determined per area. (n ≥ 4 technical replicates per condition) (*P < 0.05, **P < 0.01, ****P < 0.0001; two‐way ANOVA with multiple comparisons). Data represent means ± SEM.
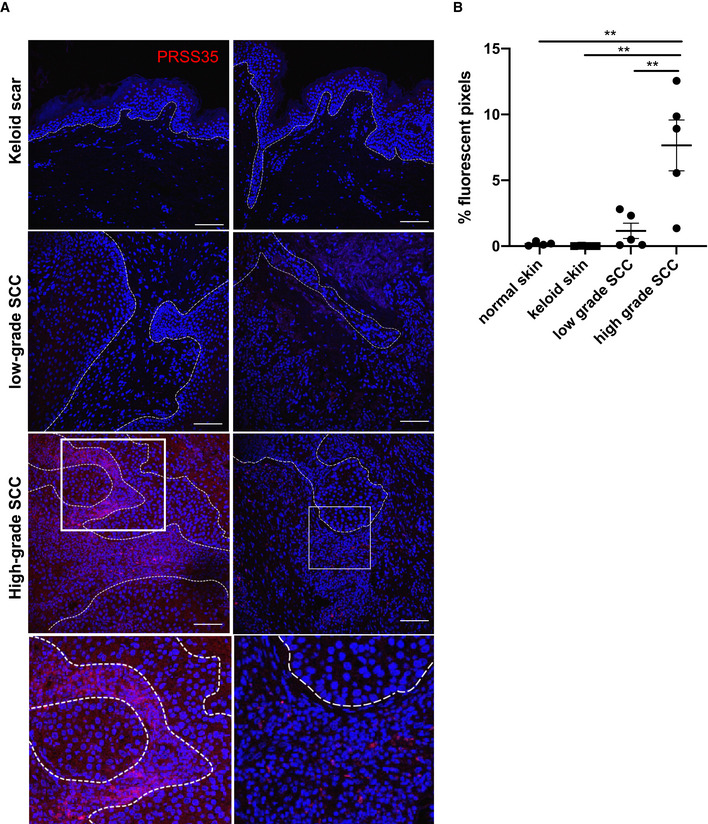
Human skin sections were stained with a PRSS35‐specific antibody (red) and counterstained with Dapi (n = 5 per condition). Boxed areas are magnifications as shown in the lower panel, and dotted line represents the epidermal–dermal boundary. Scale bars: 100 µm.
Quantification of PRSS35‐positive signal by Volocity analysis (n ≥ 4 per condition; **P < 0.01; one‐way ANOVA testing). Data represent means of multiple microscopic fields ± SEM.
References
-
- Arwert EN, Hoste E, Watt FM (2012) Epithelial stem cells, wound healing and cancer. Nat Rev Cancer 12: 170–180 - PubMed
Publication types
MeSH terms
Associated data
- Actions
LinkOut - more resources
Full Text Sources
Other Literature Sources
Molecular Biology Databases
