. 2021 Mar;1(3):e90.
doi: 10.1002/cpz1.90.

Gene Set Knowledge Discovery with Enrichr

Affiliations

Gene Set Knowledge Discovery with Enrichr

Zhuorui Xie et al. Curr Protoc. 2021 Mar.

Abstract

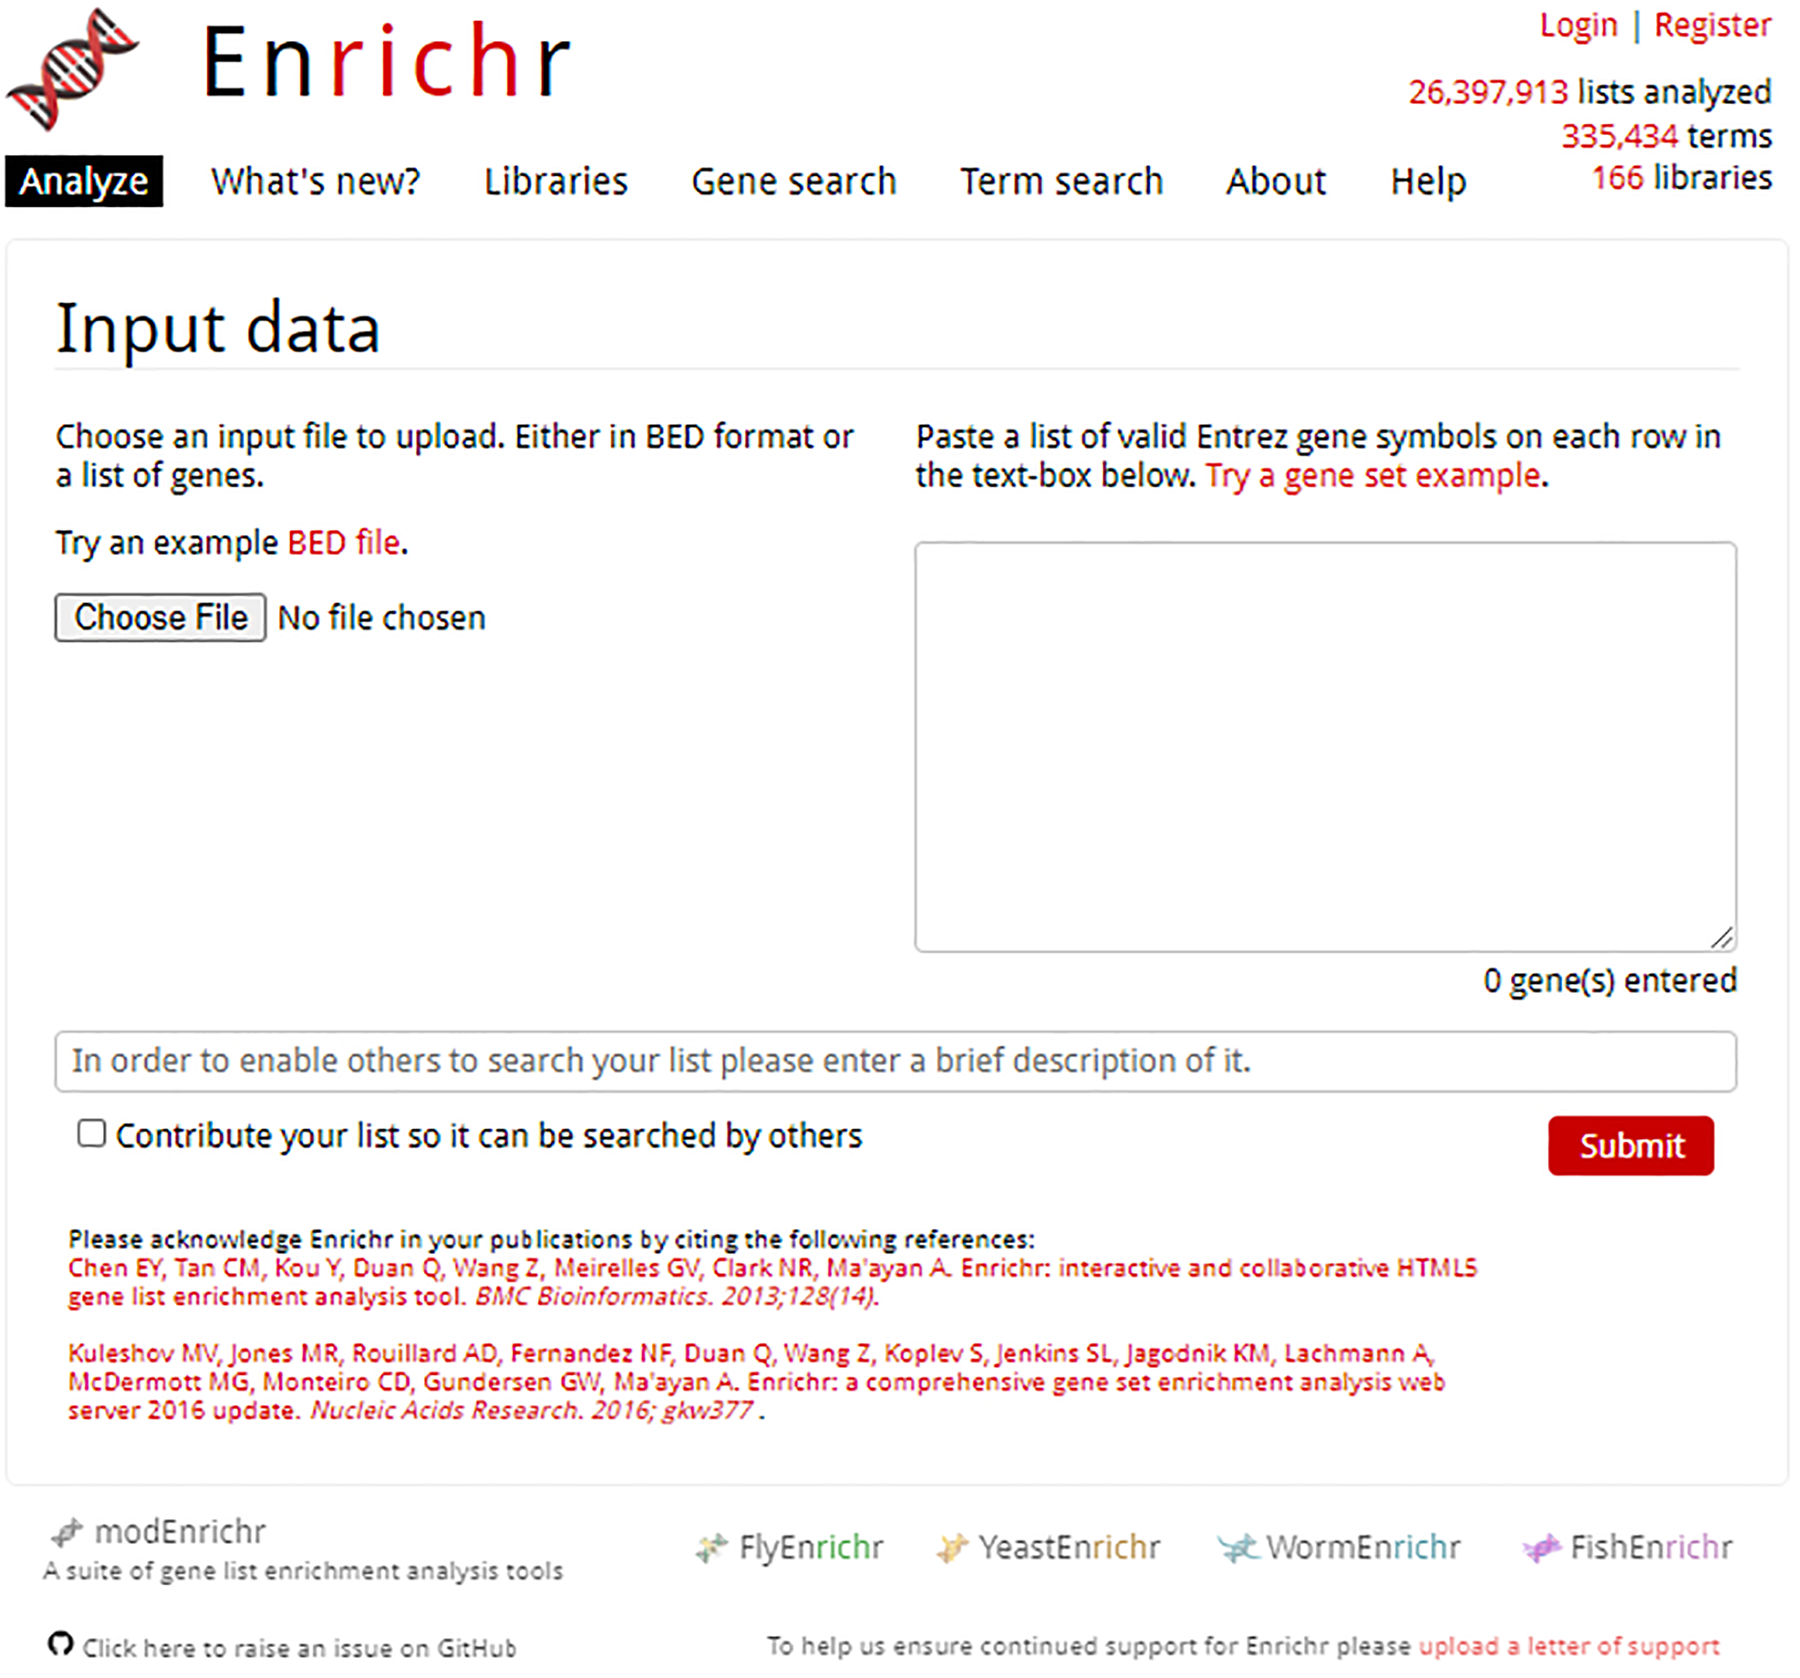
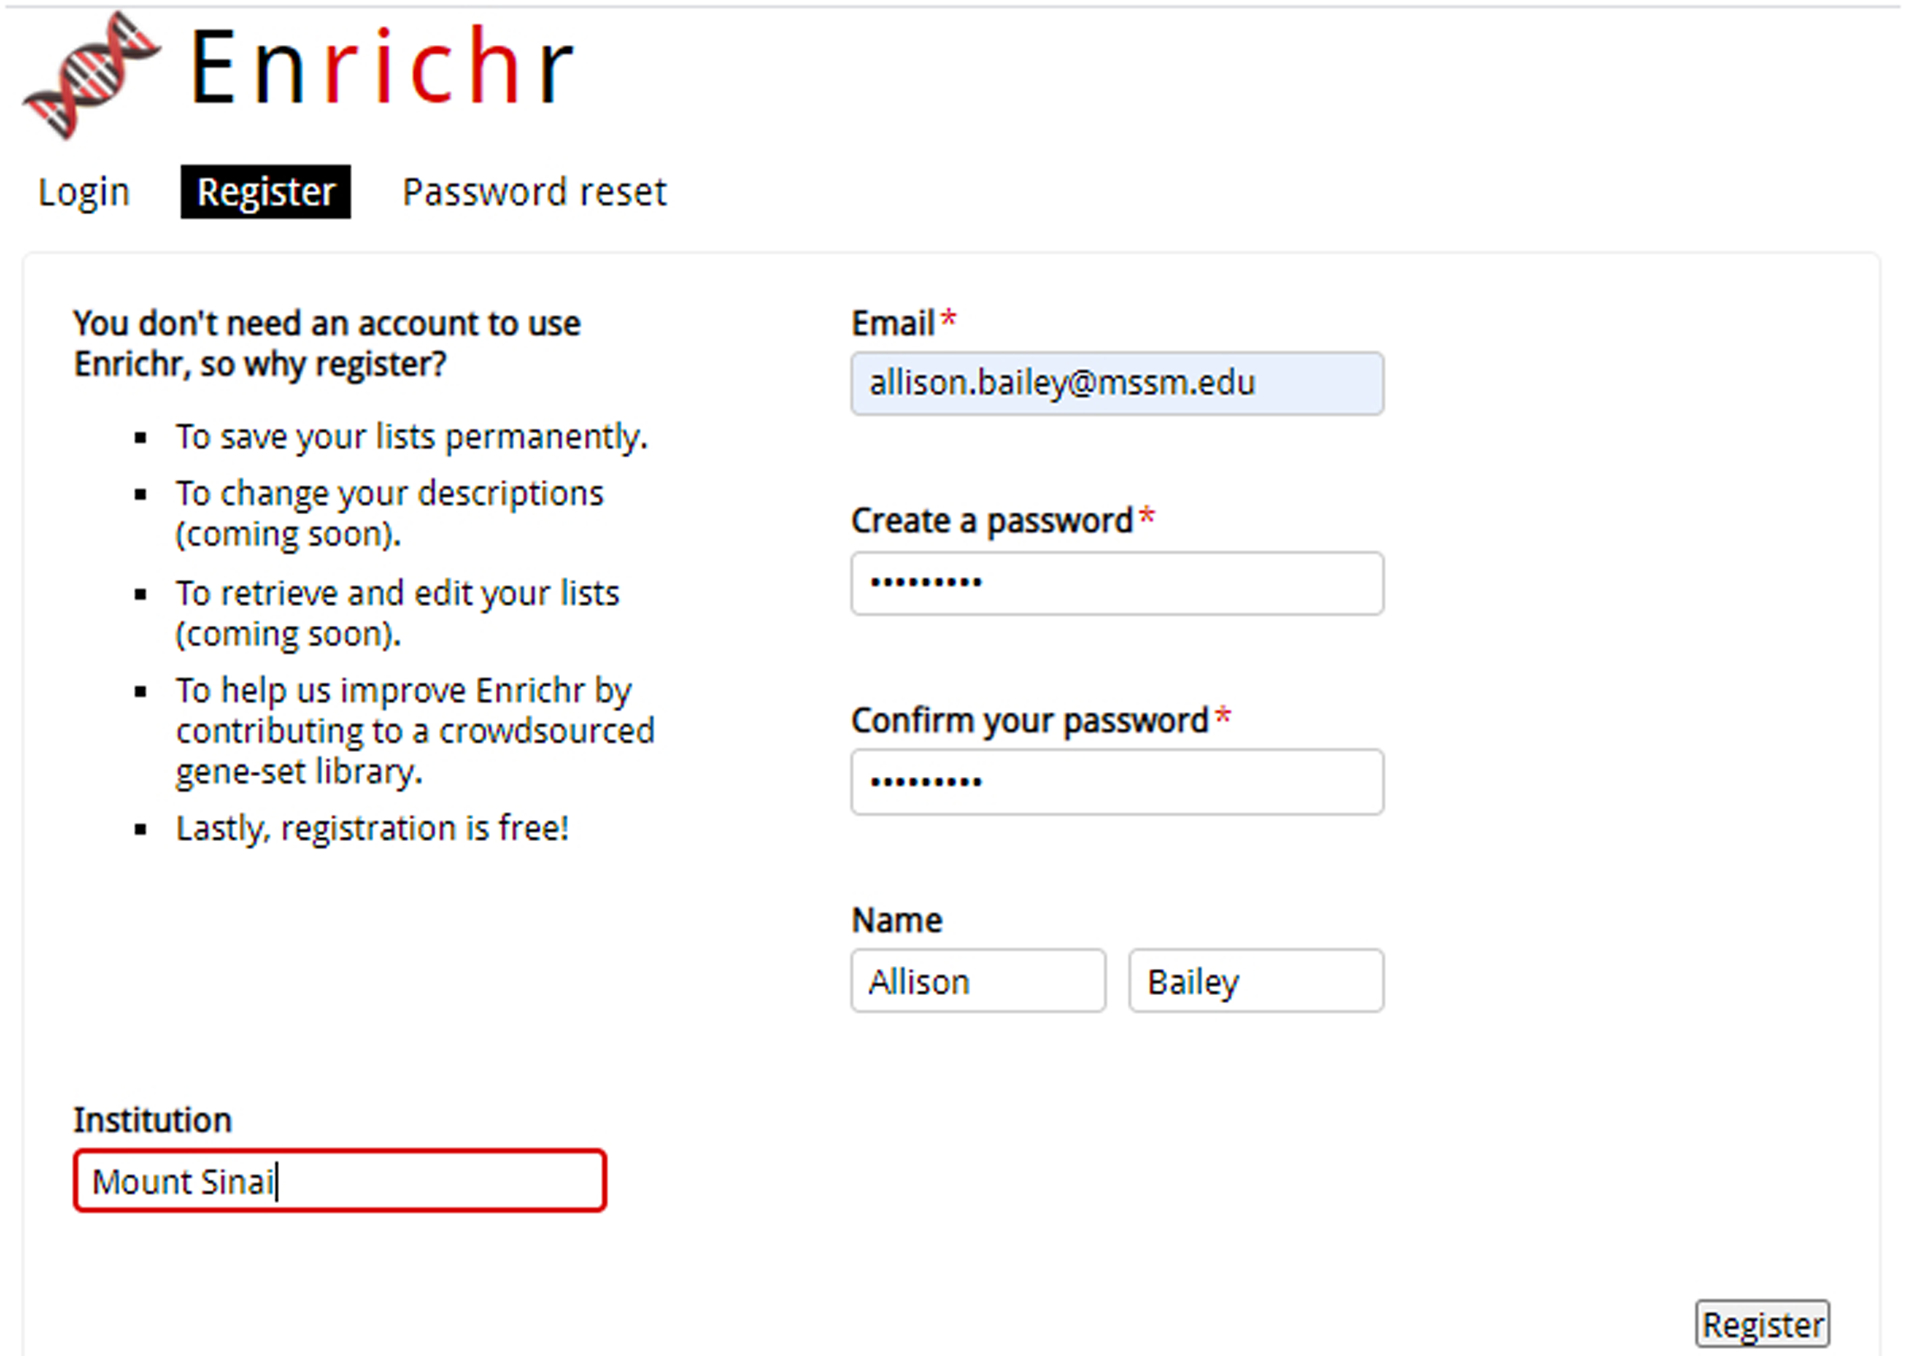
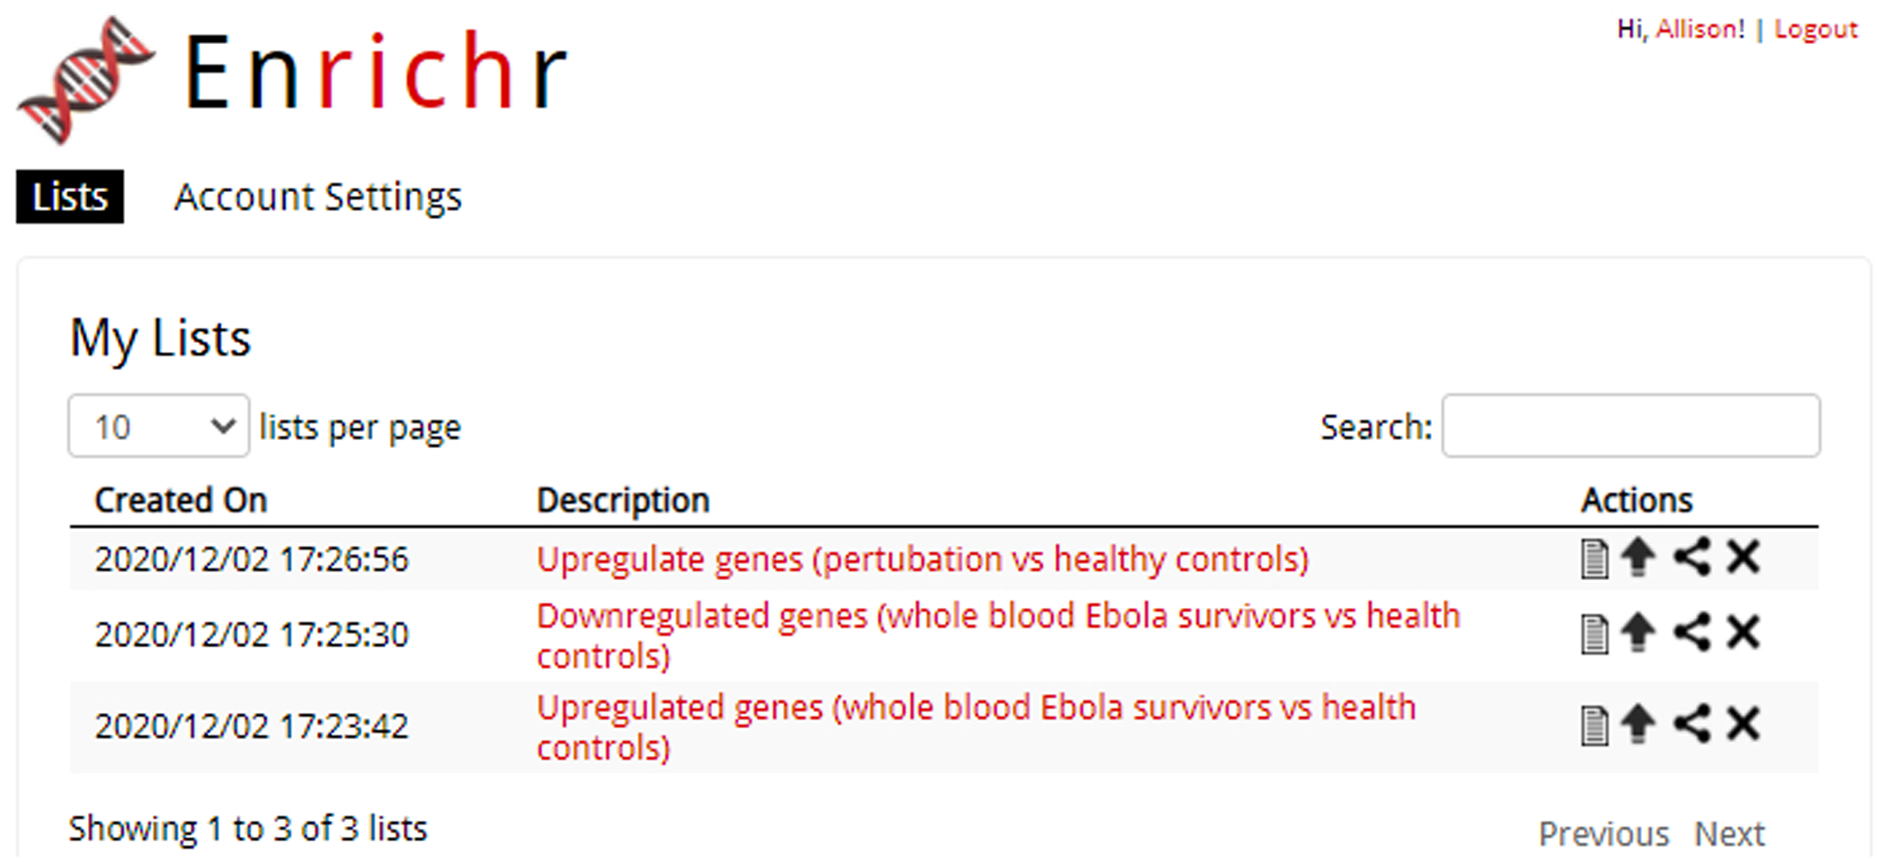
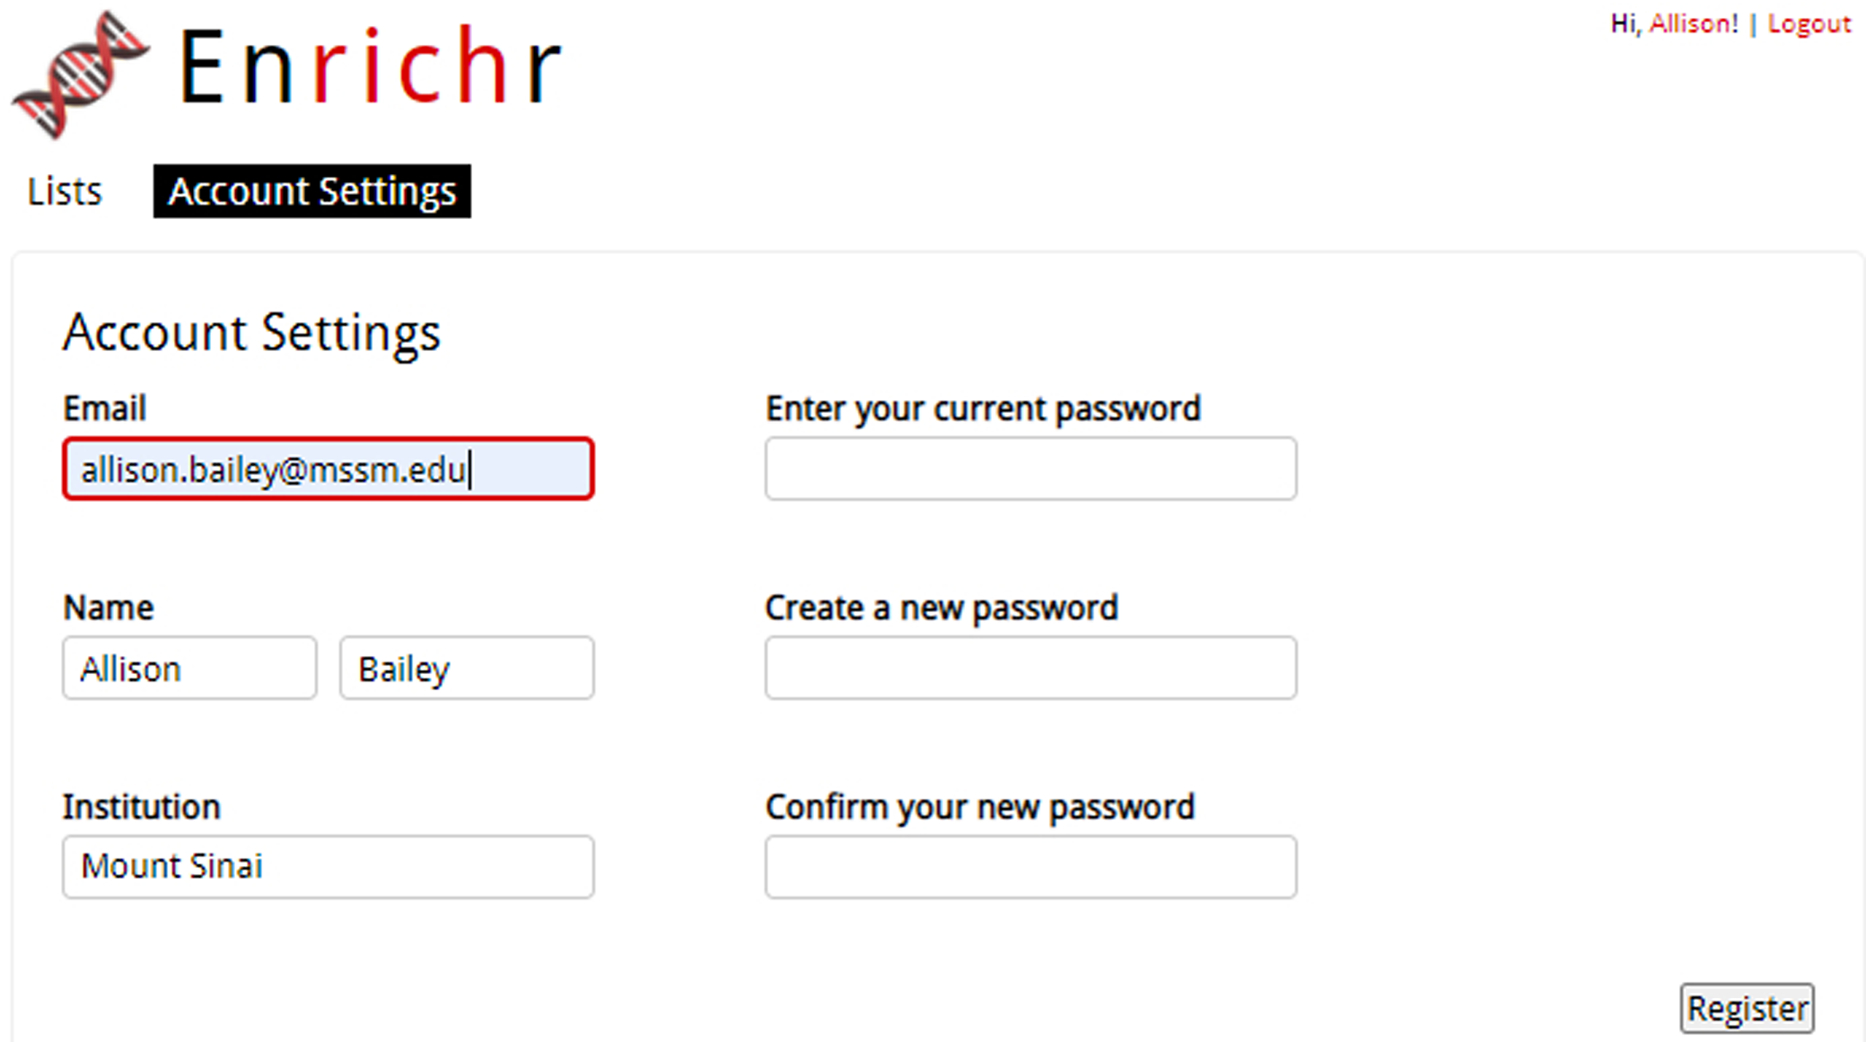
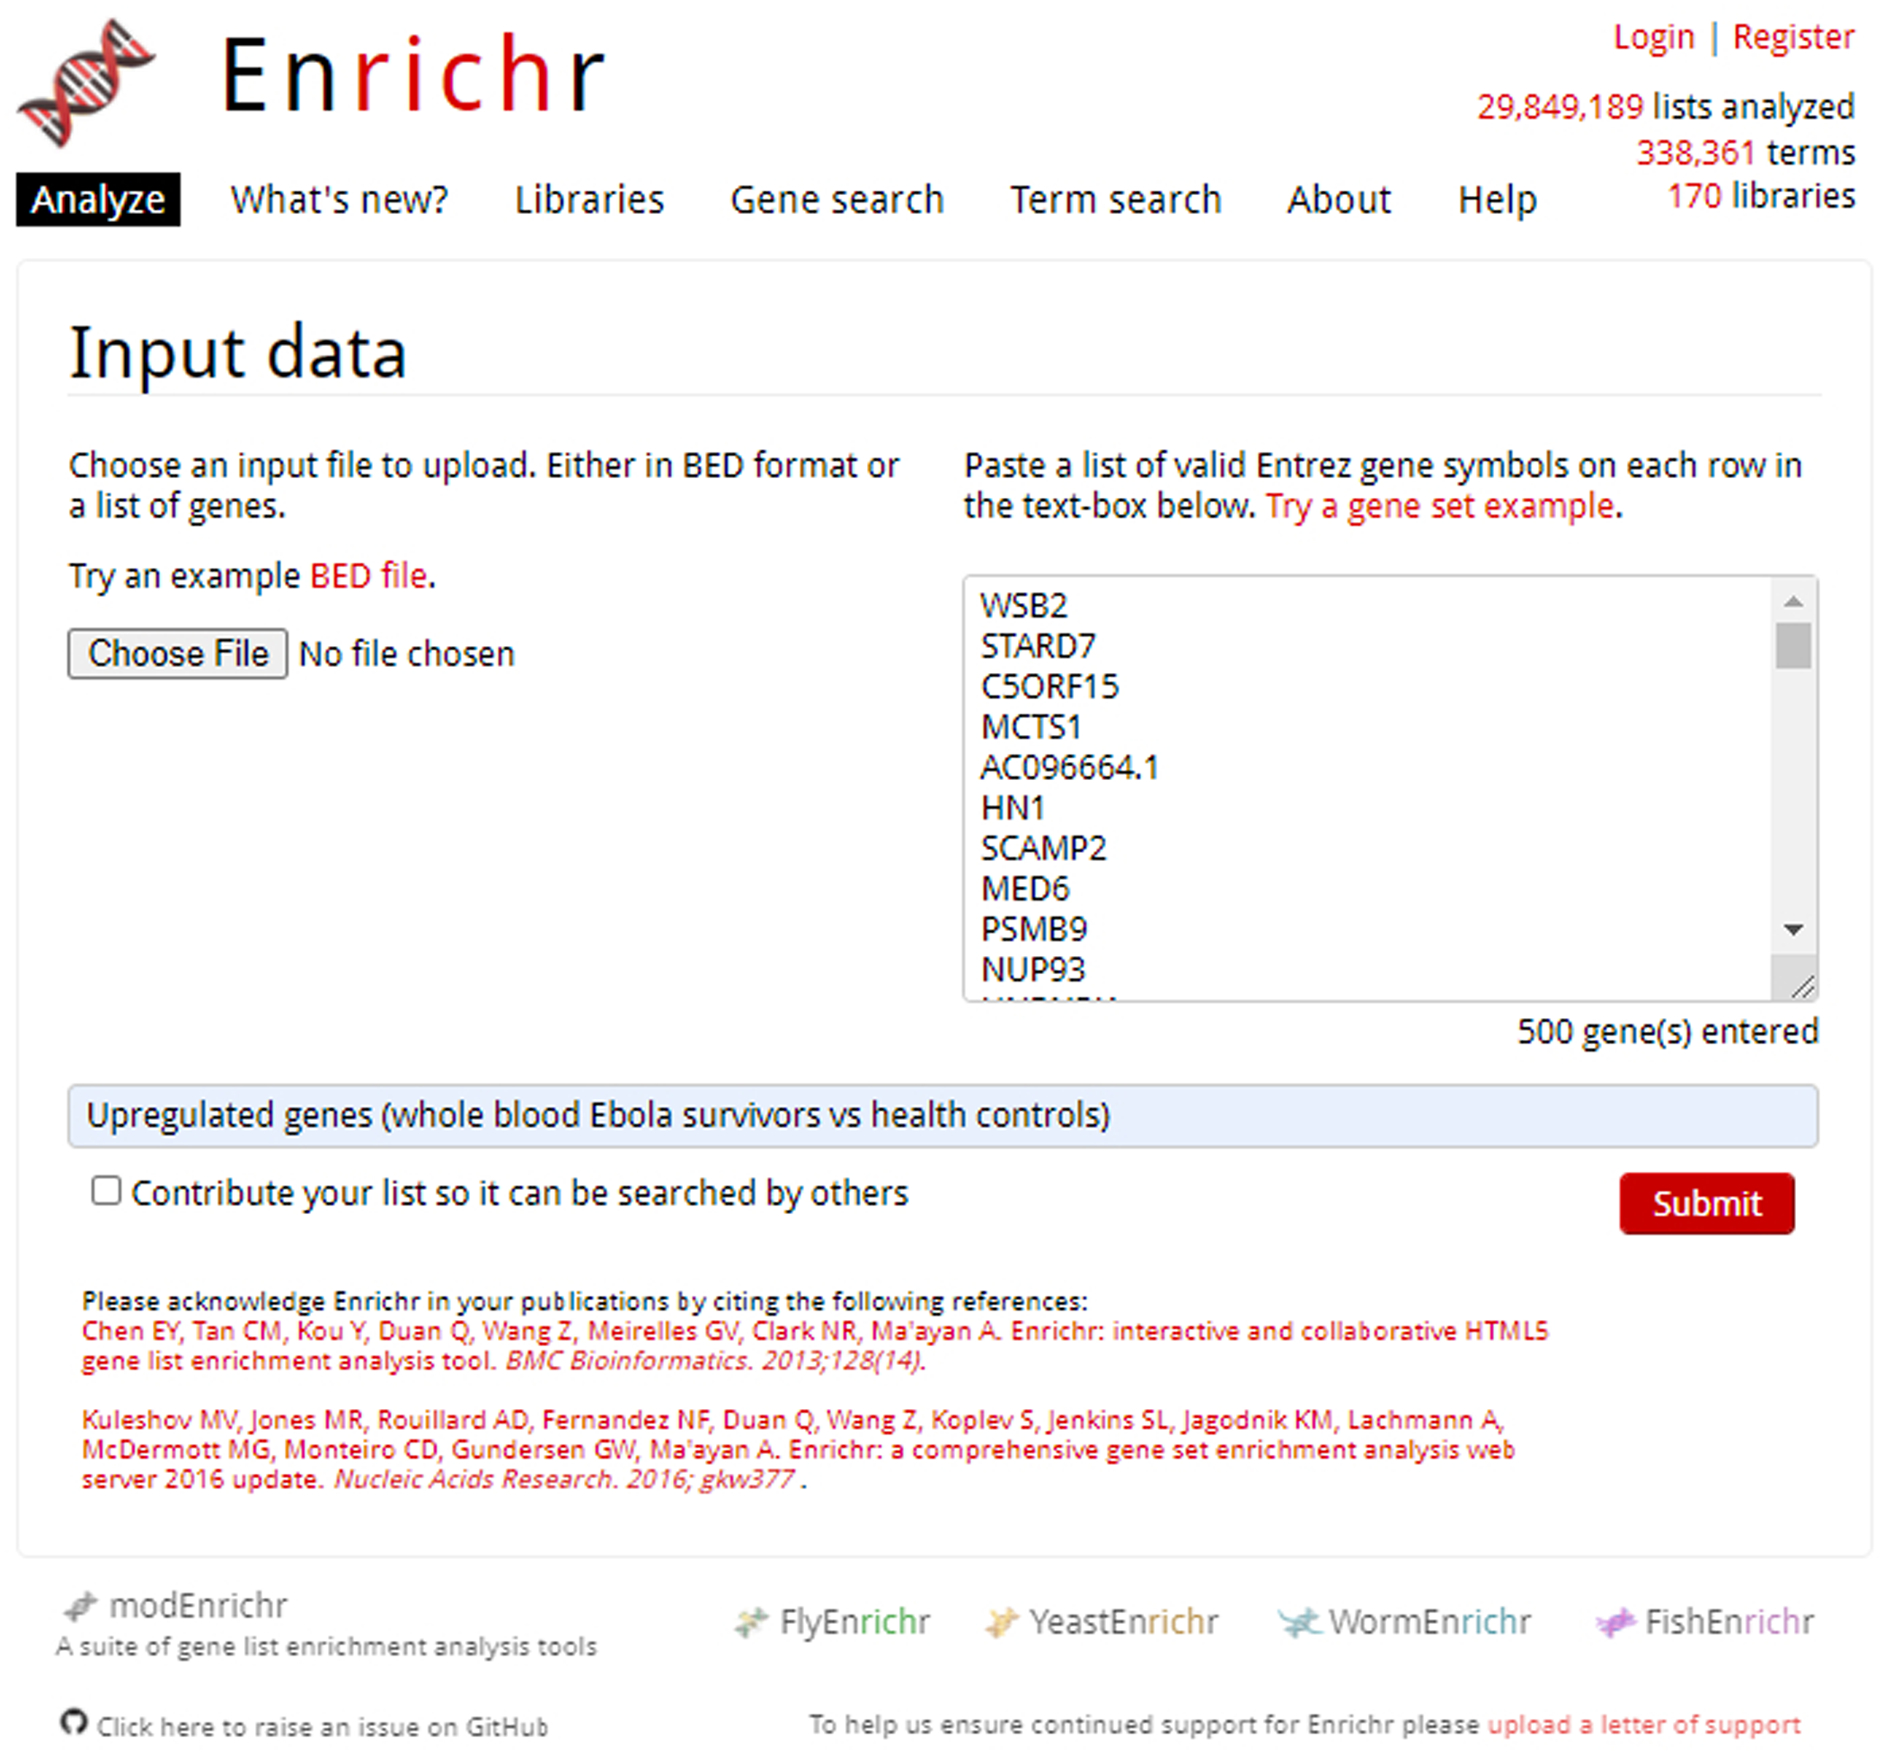
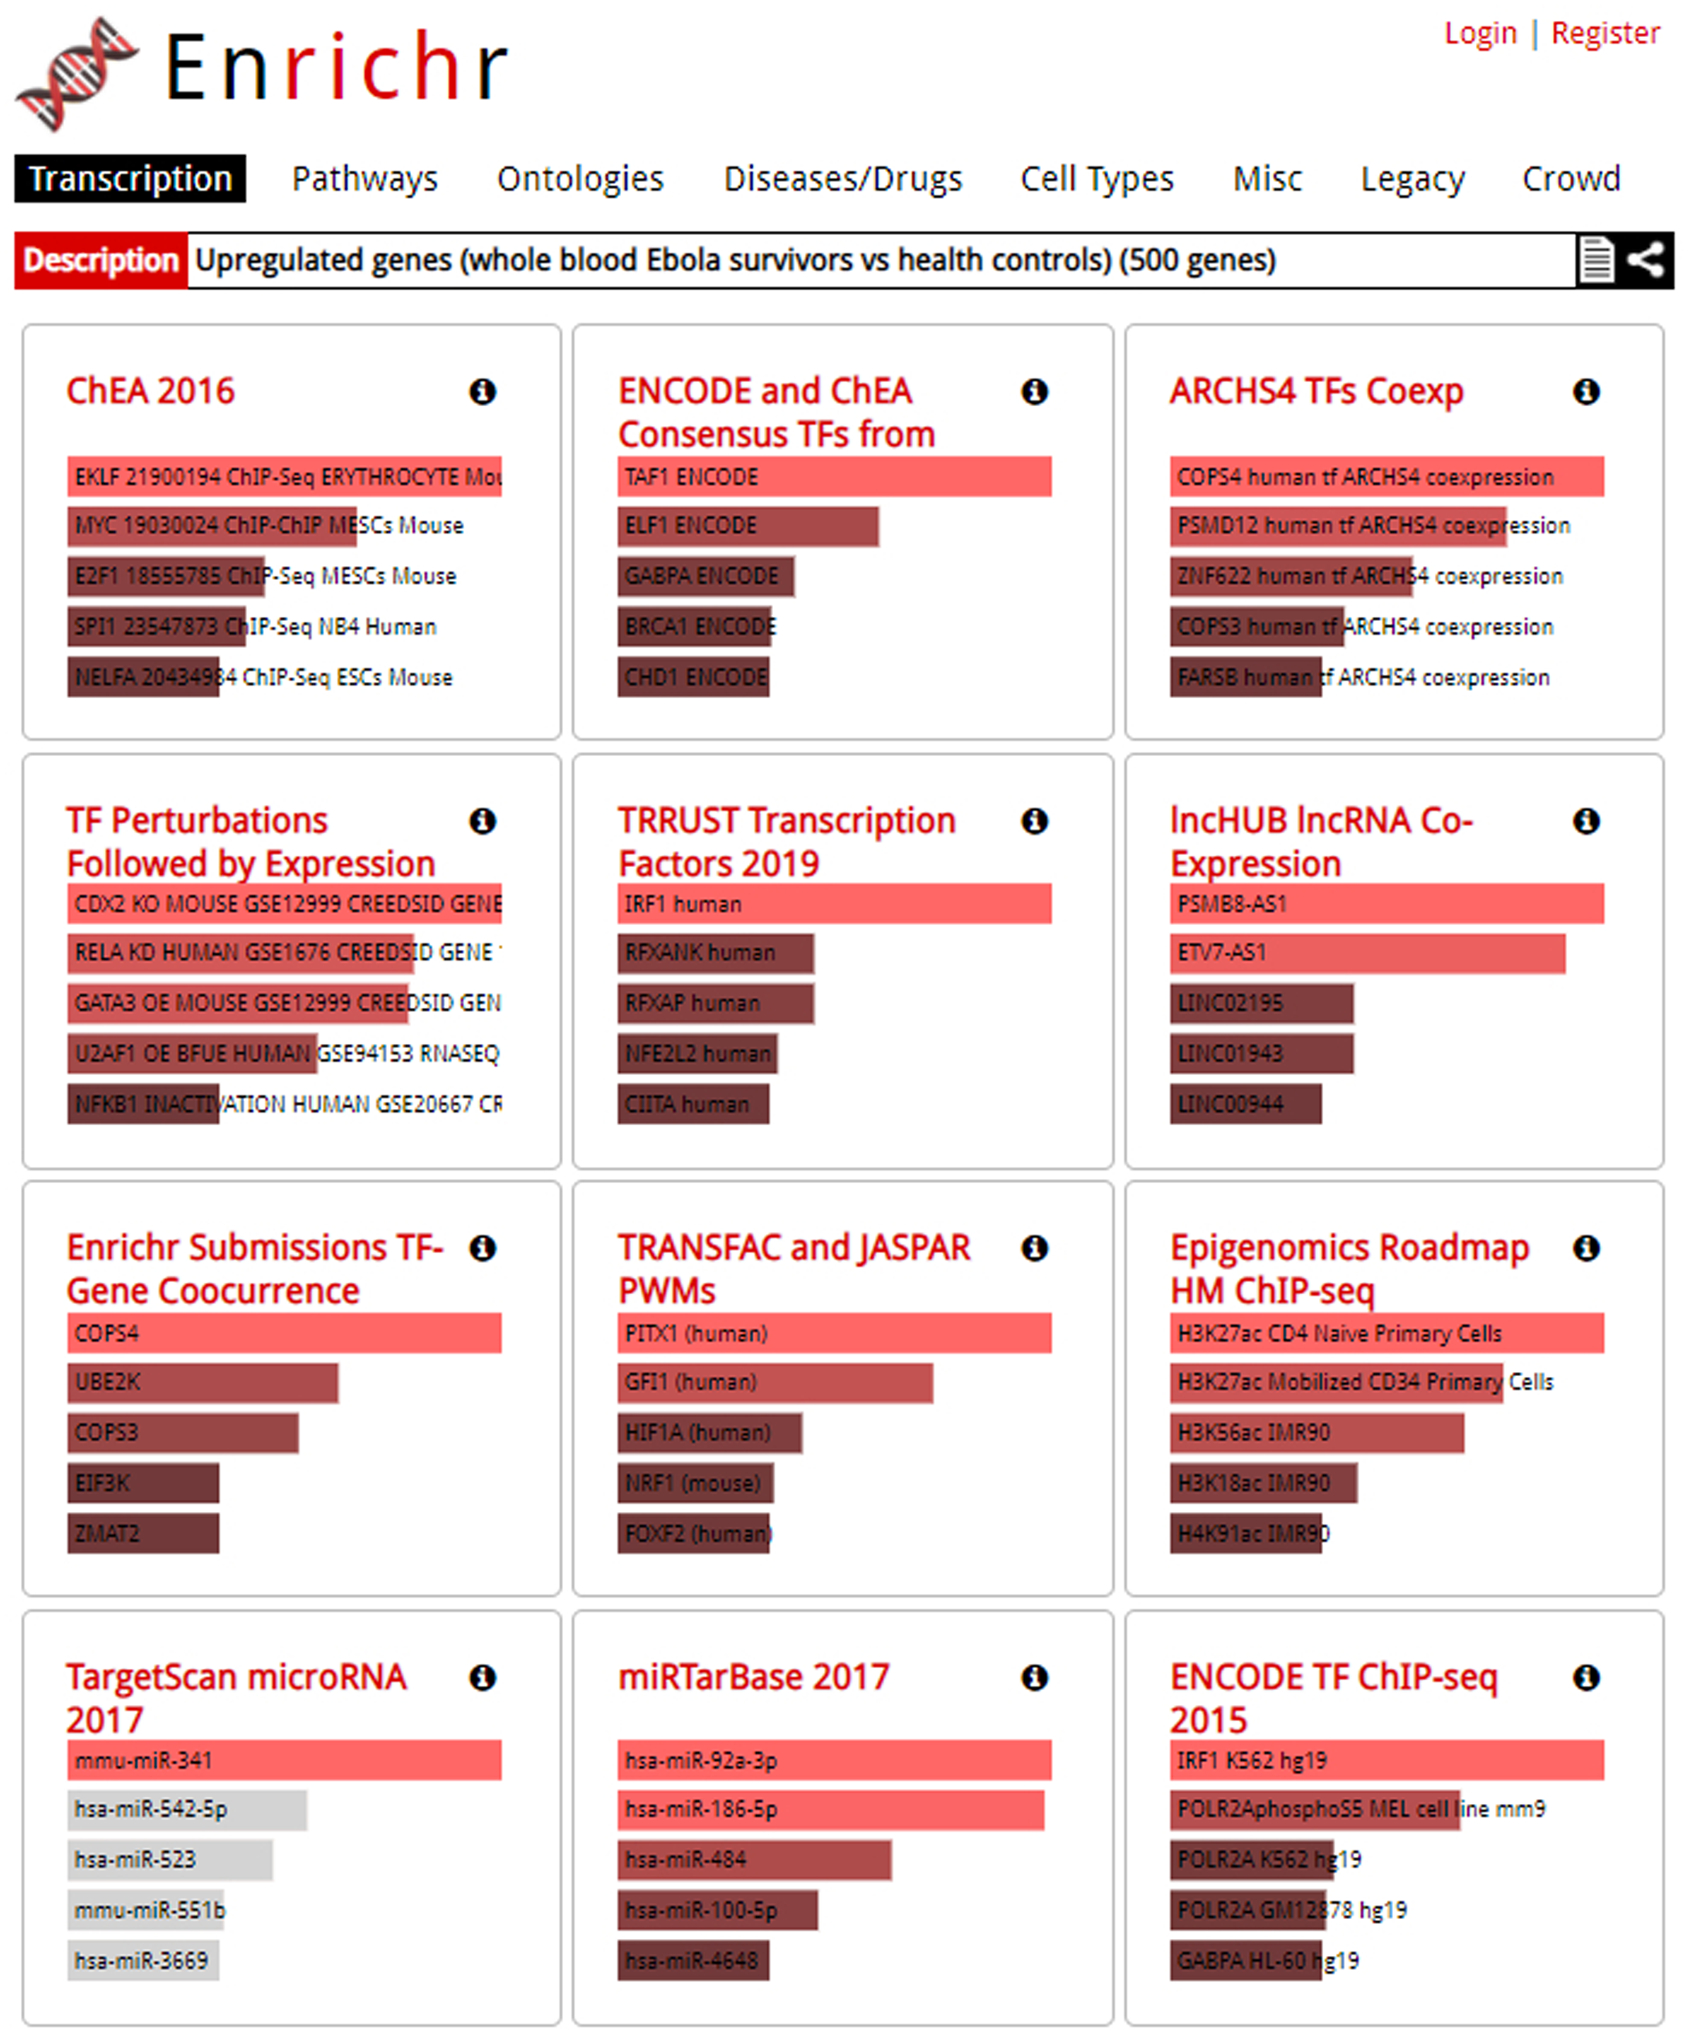
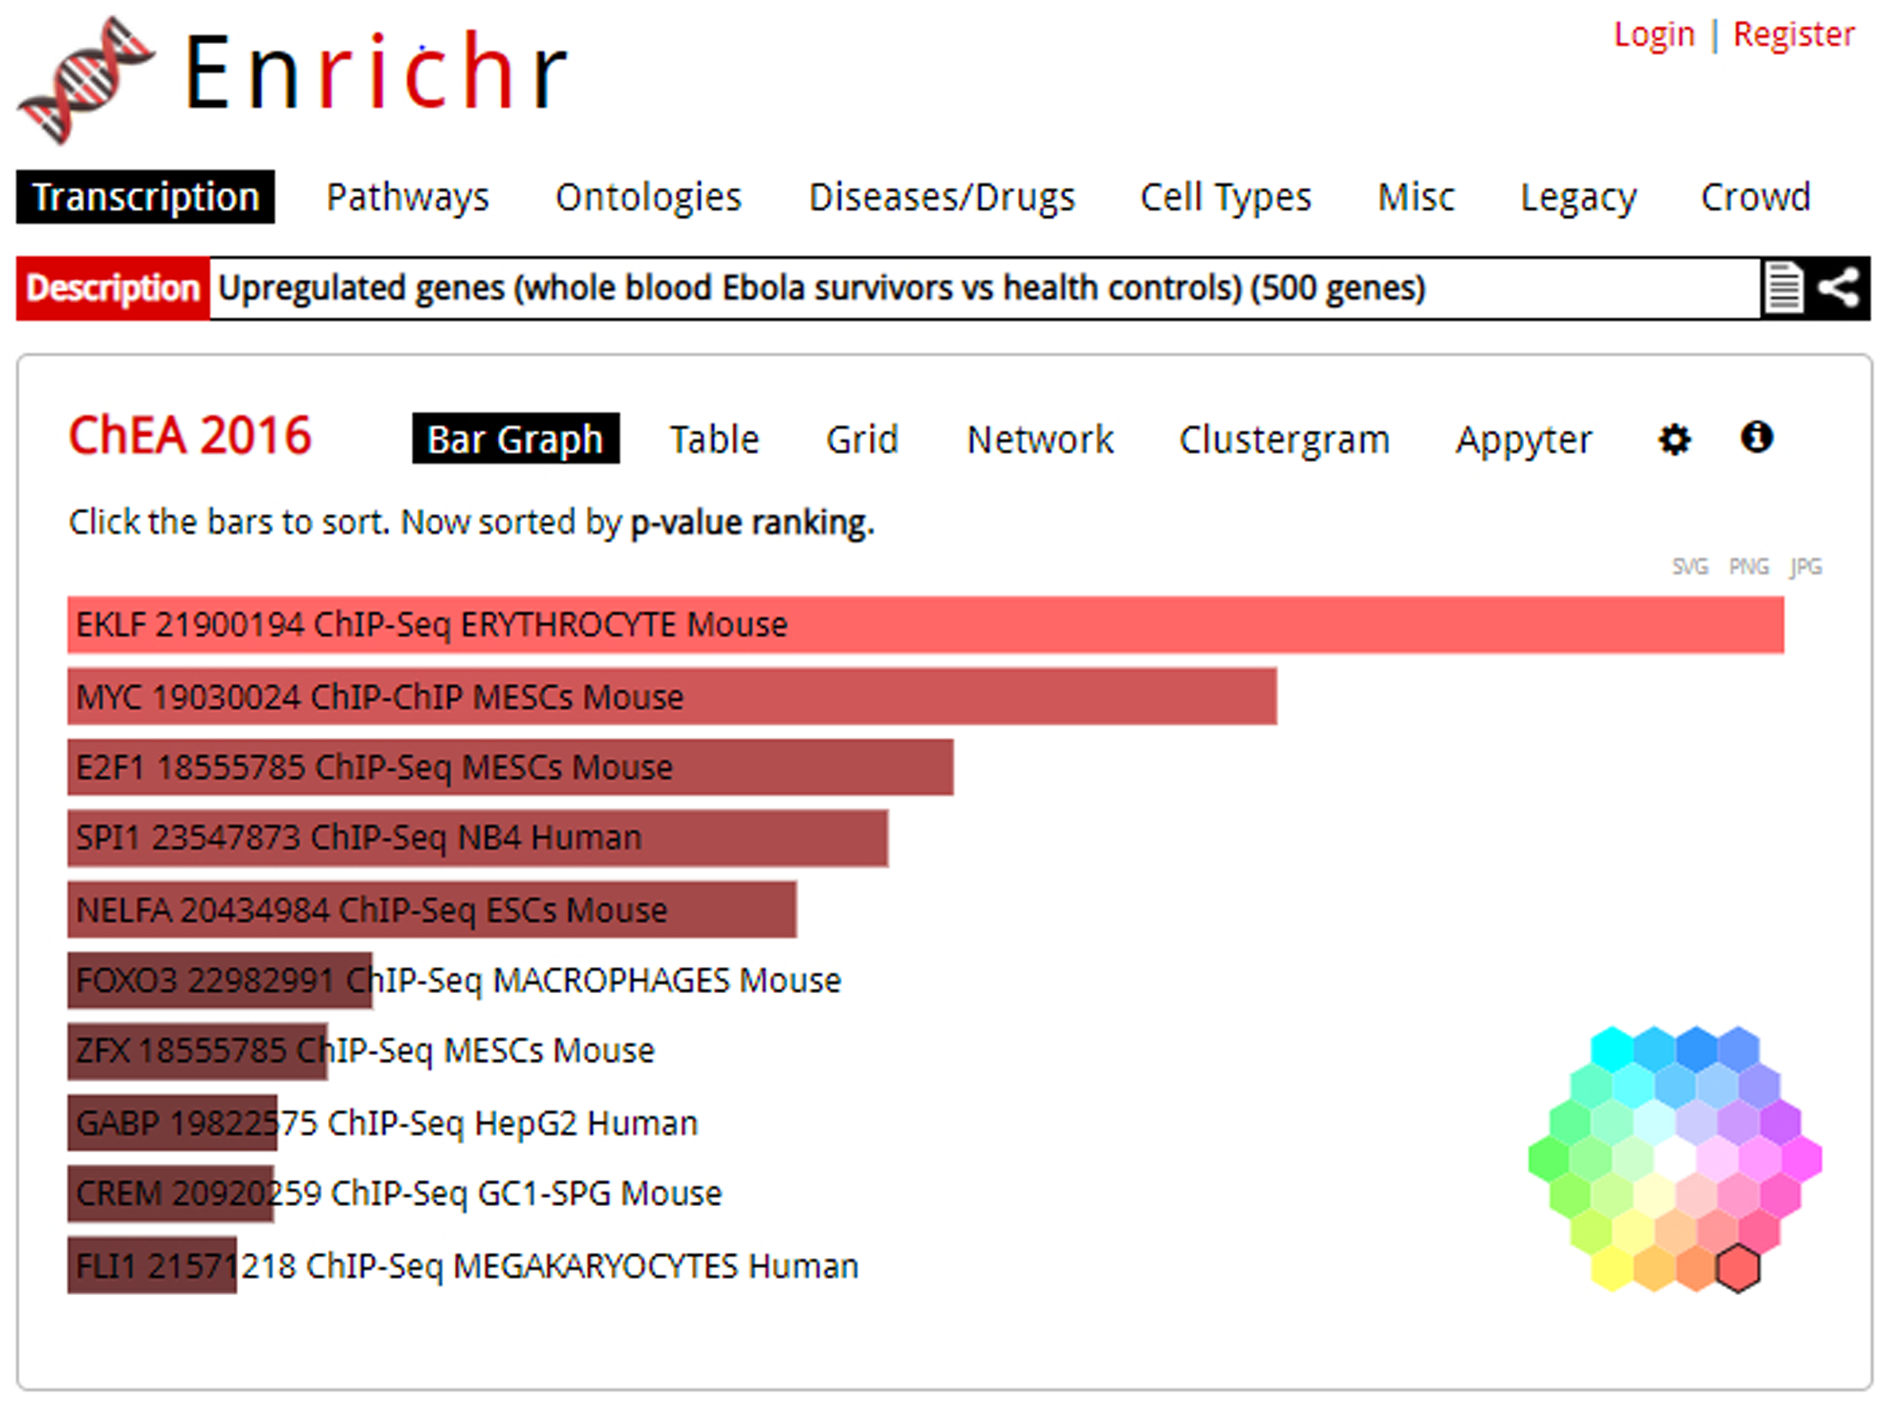
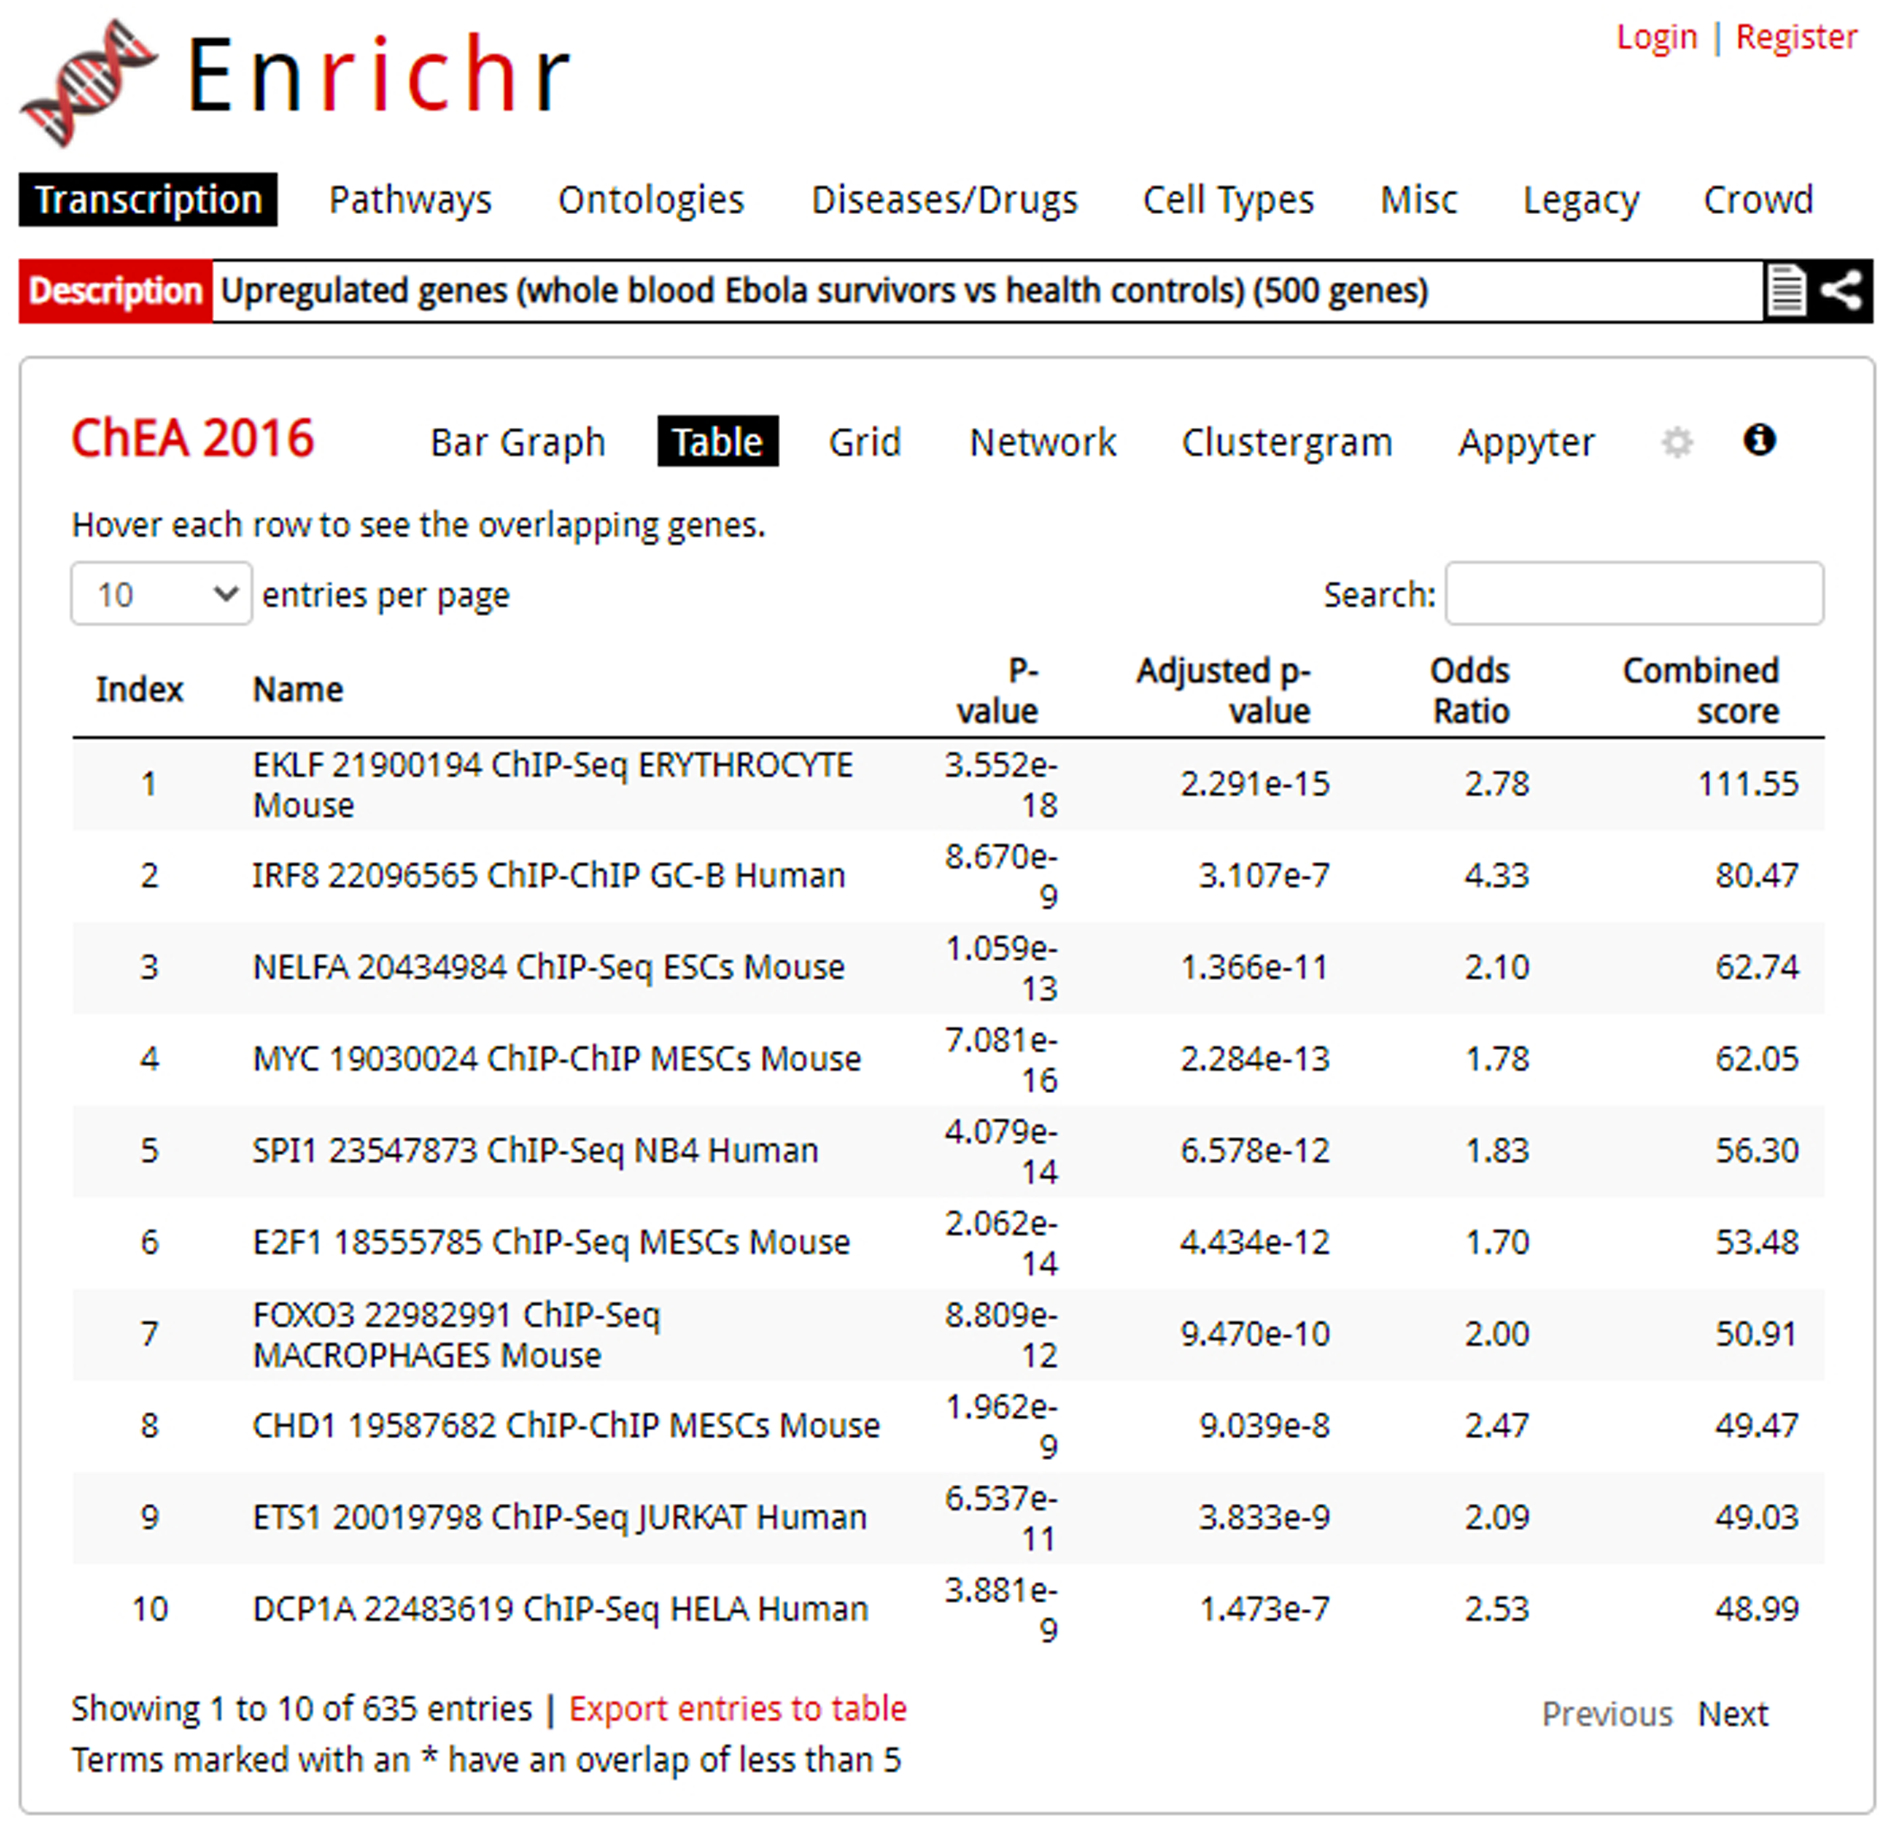
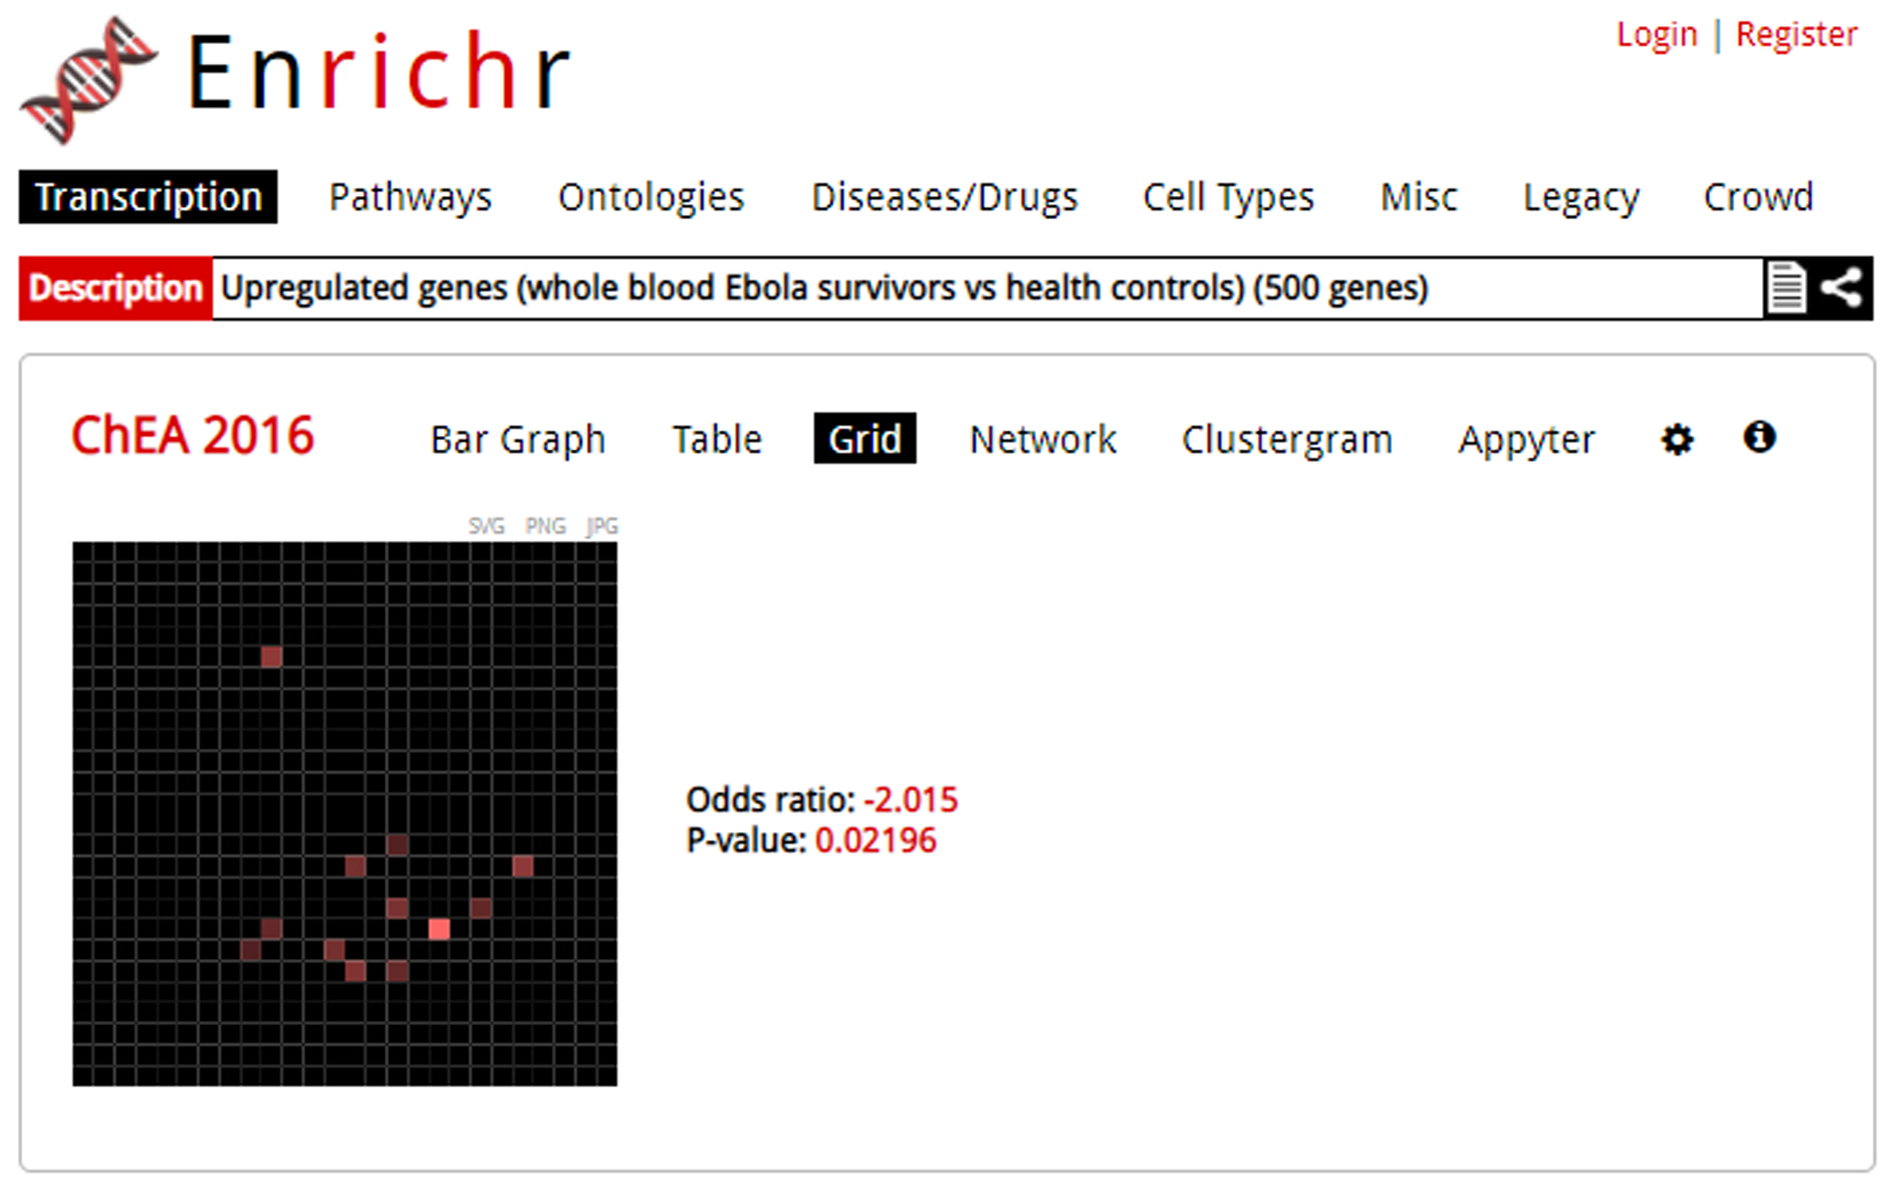
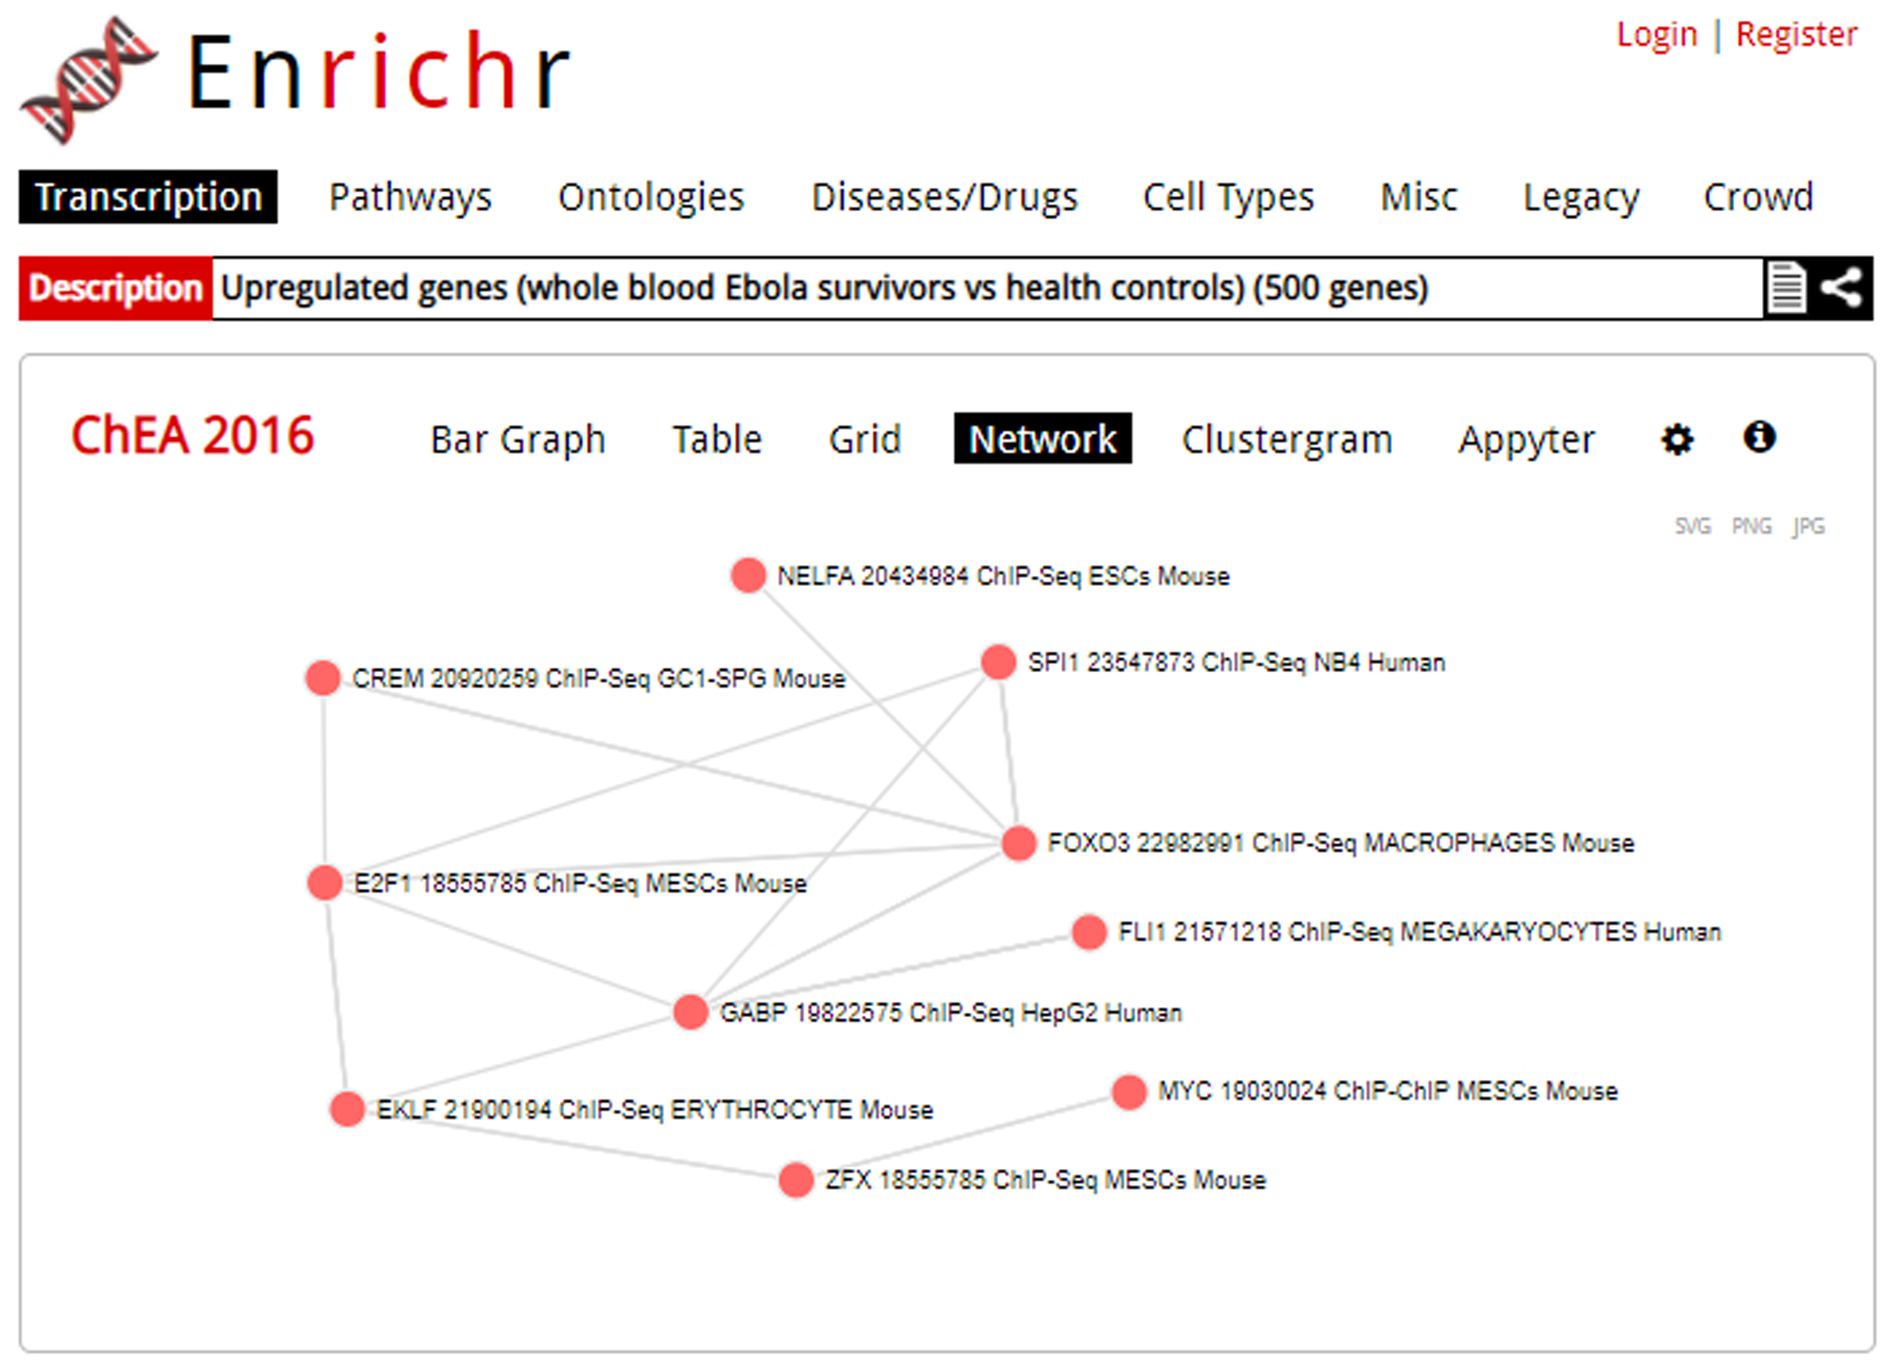
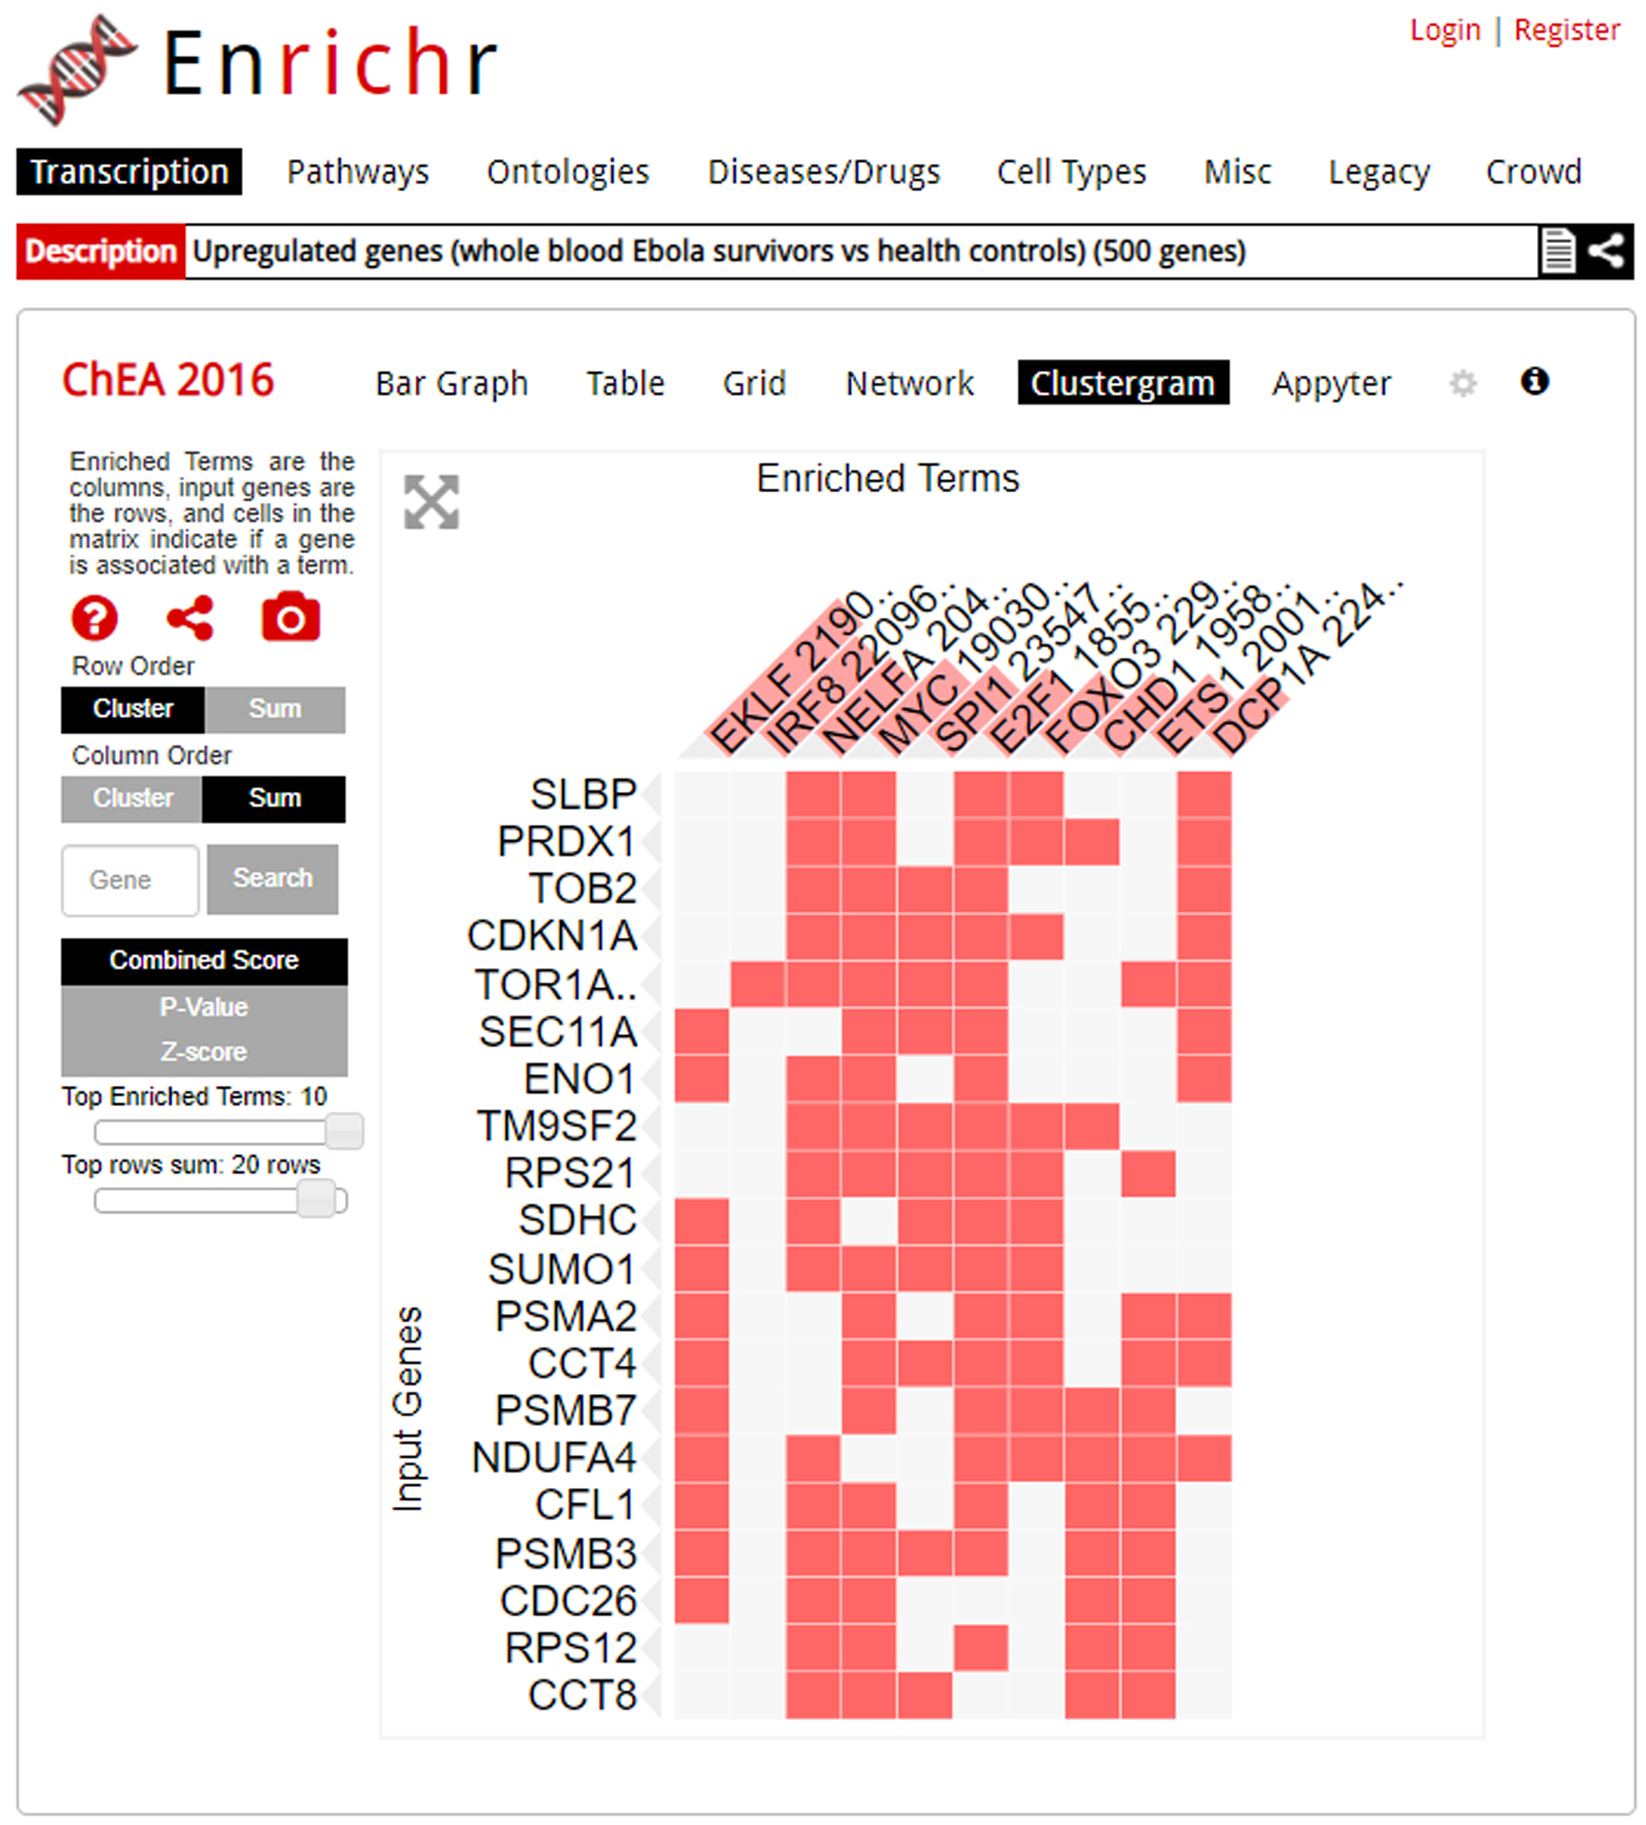
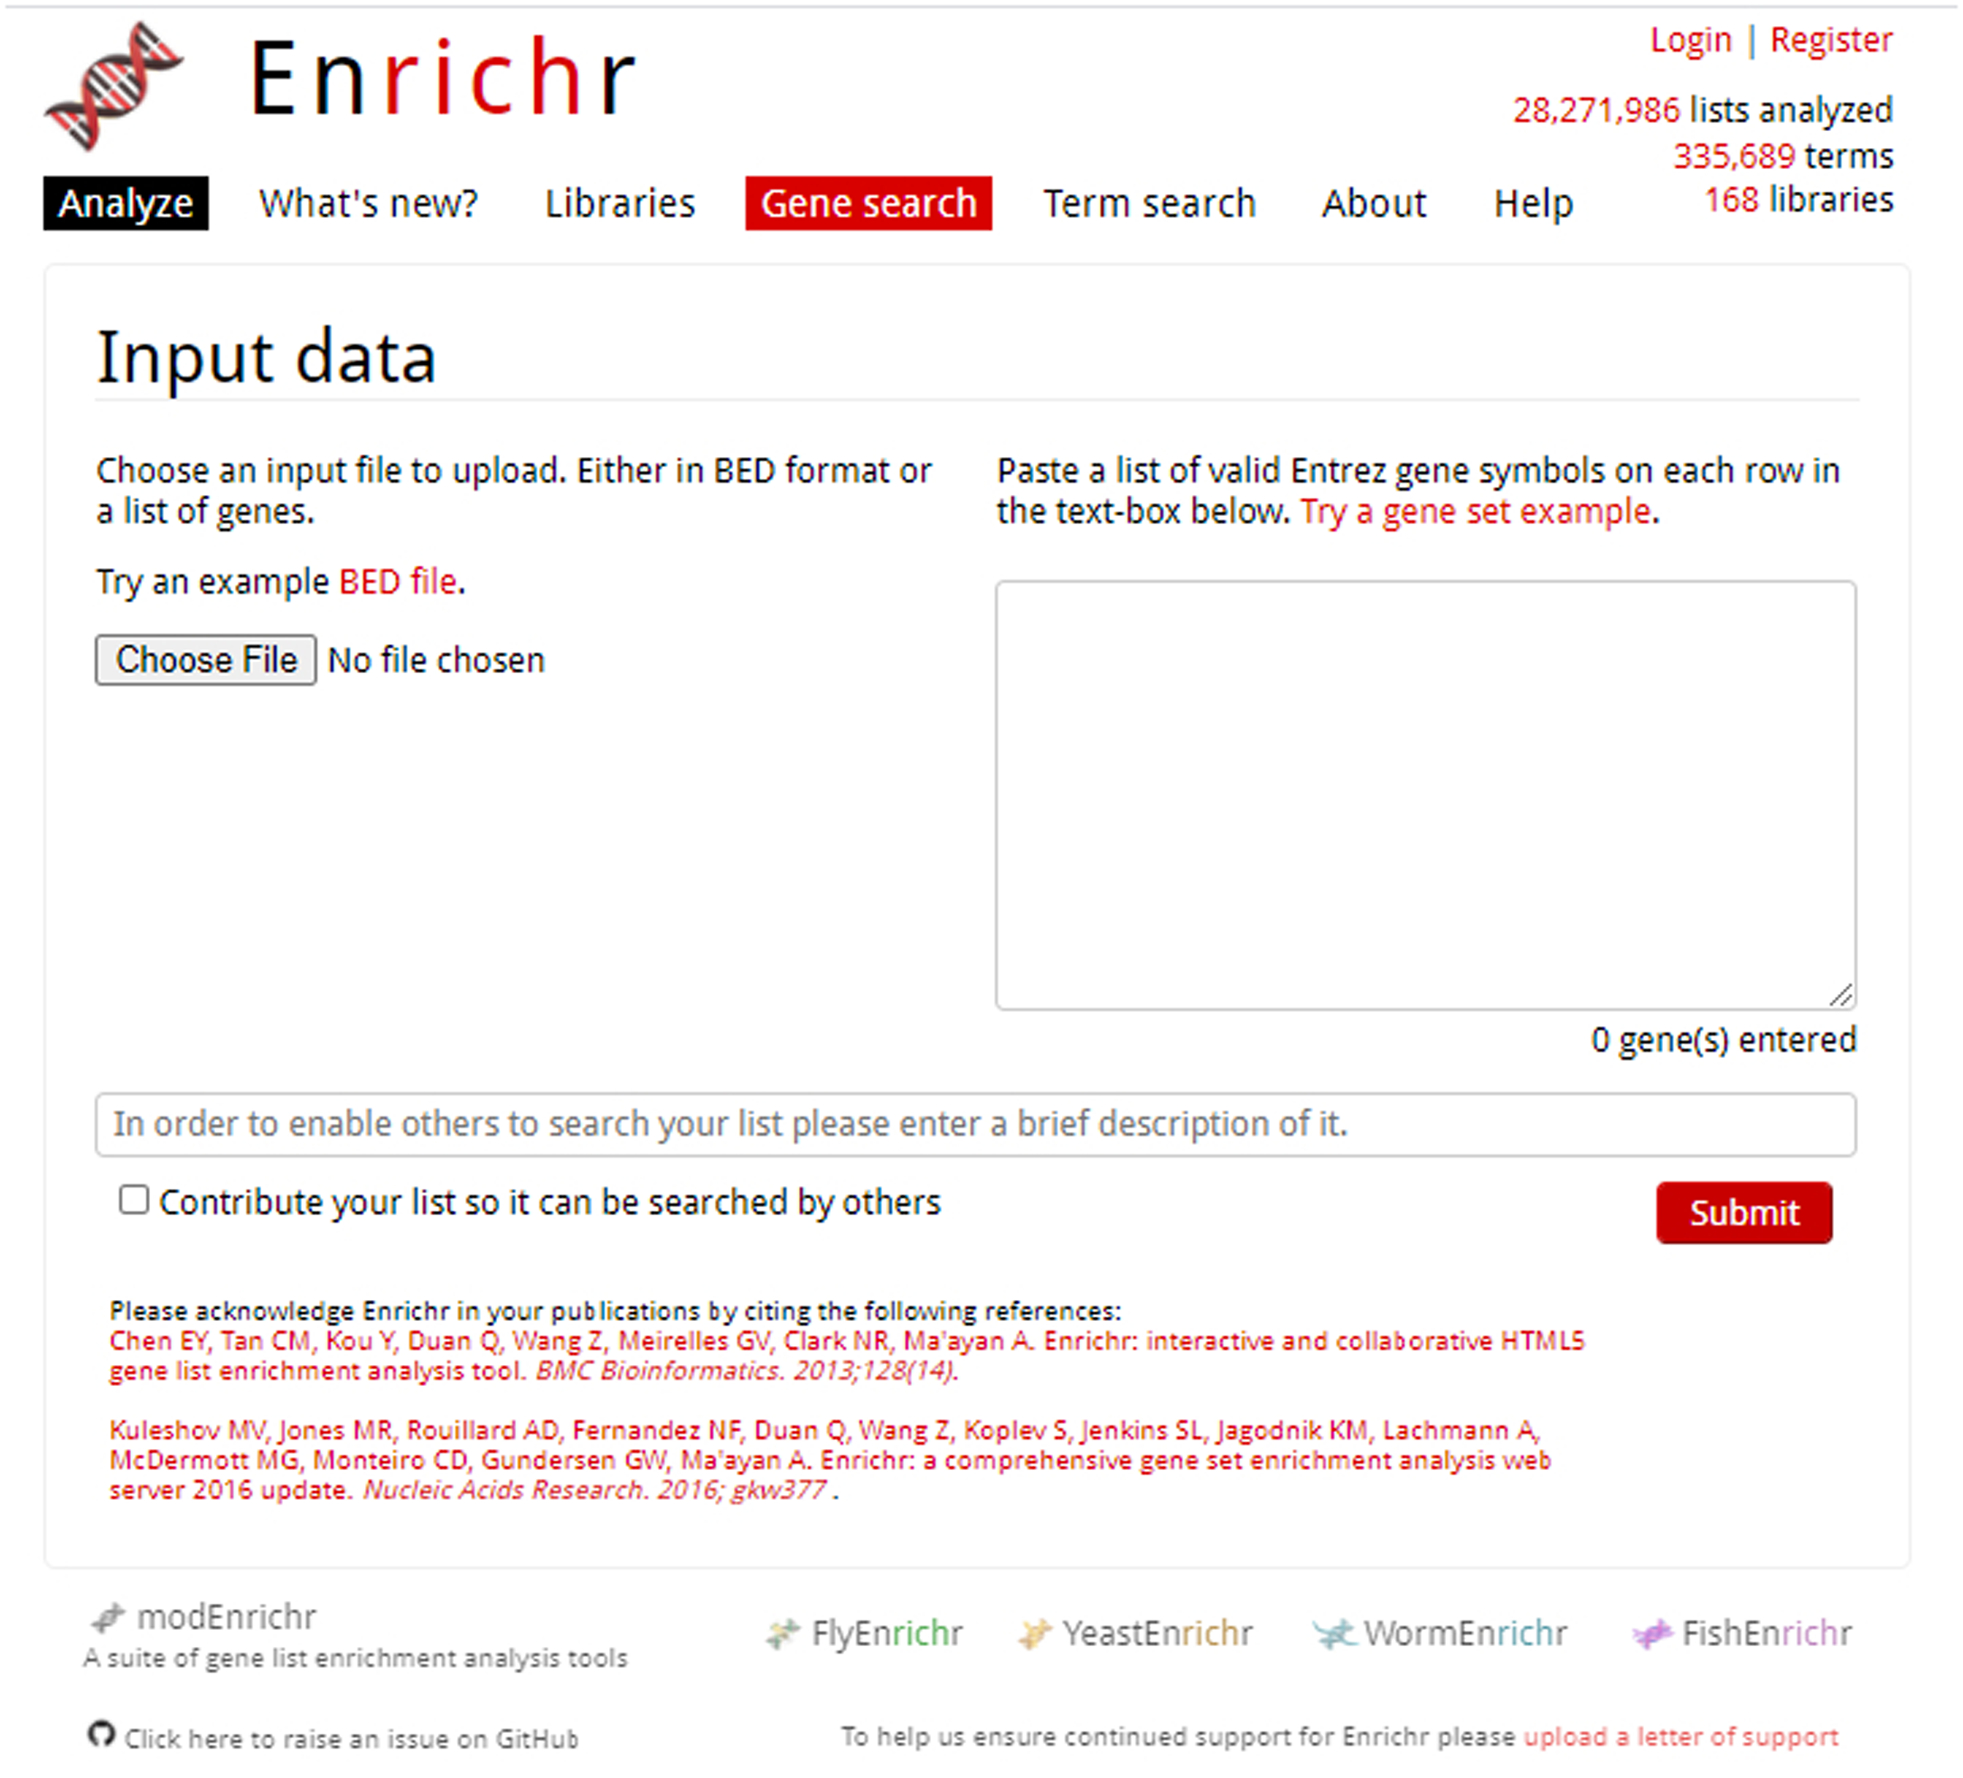
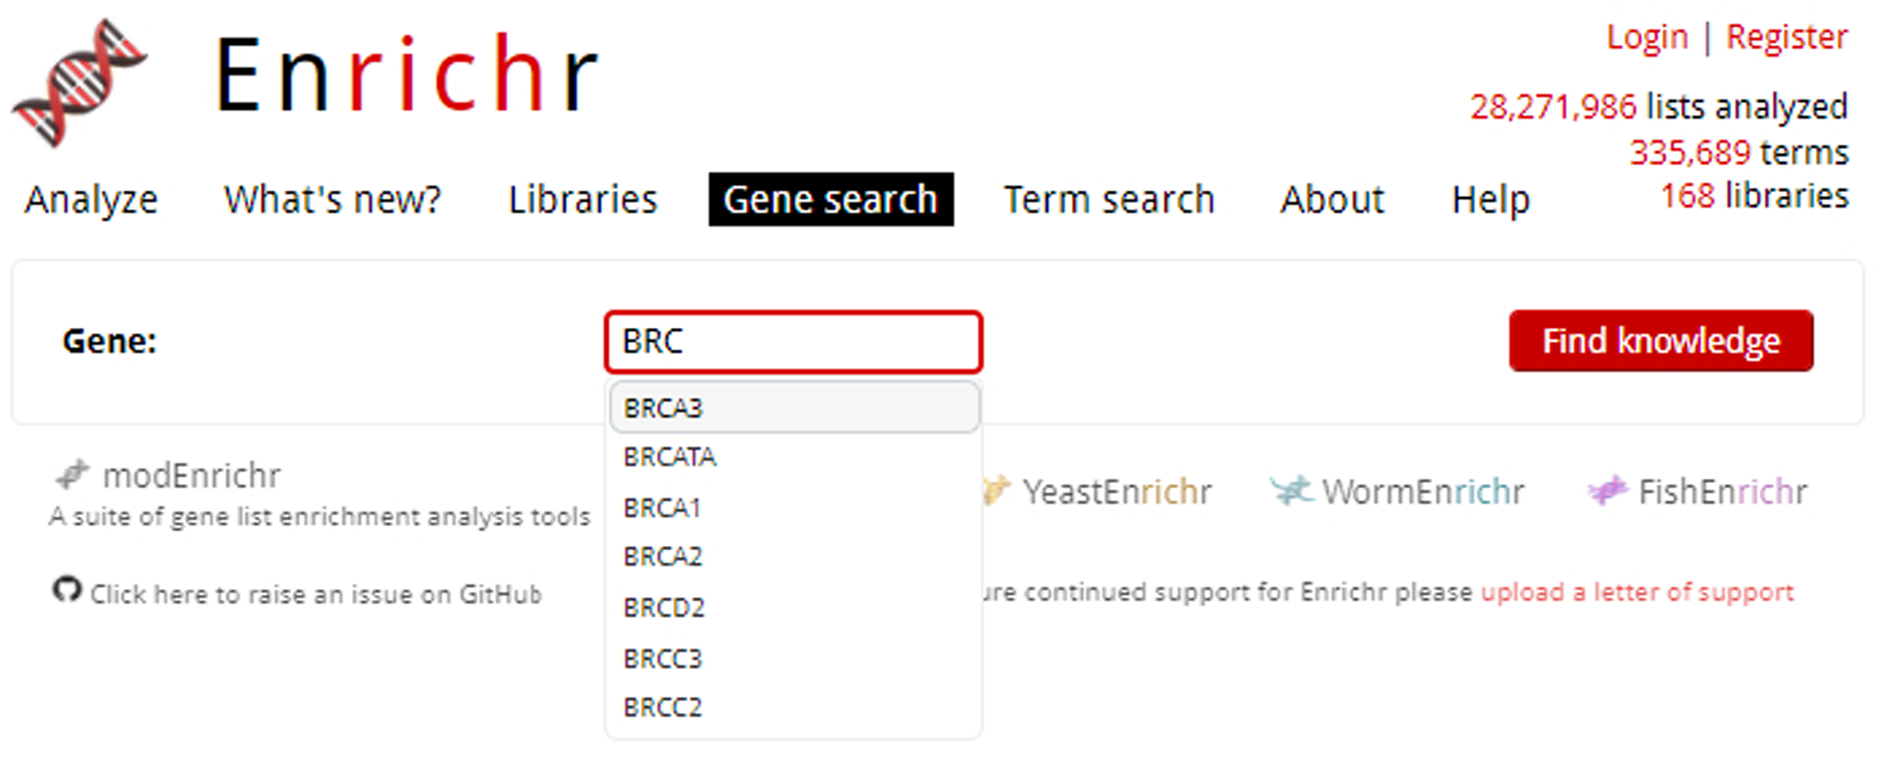
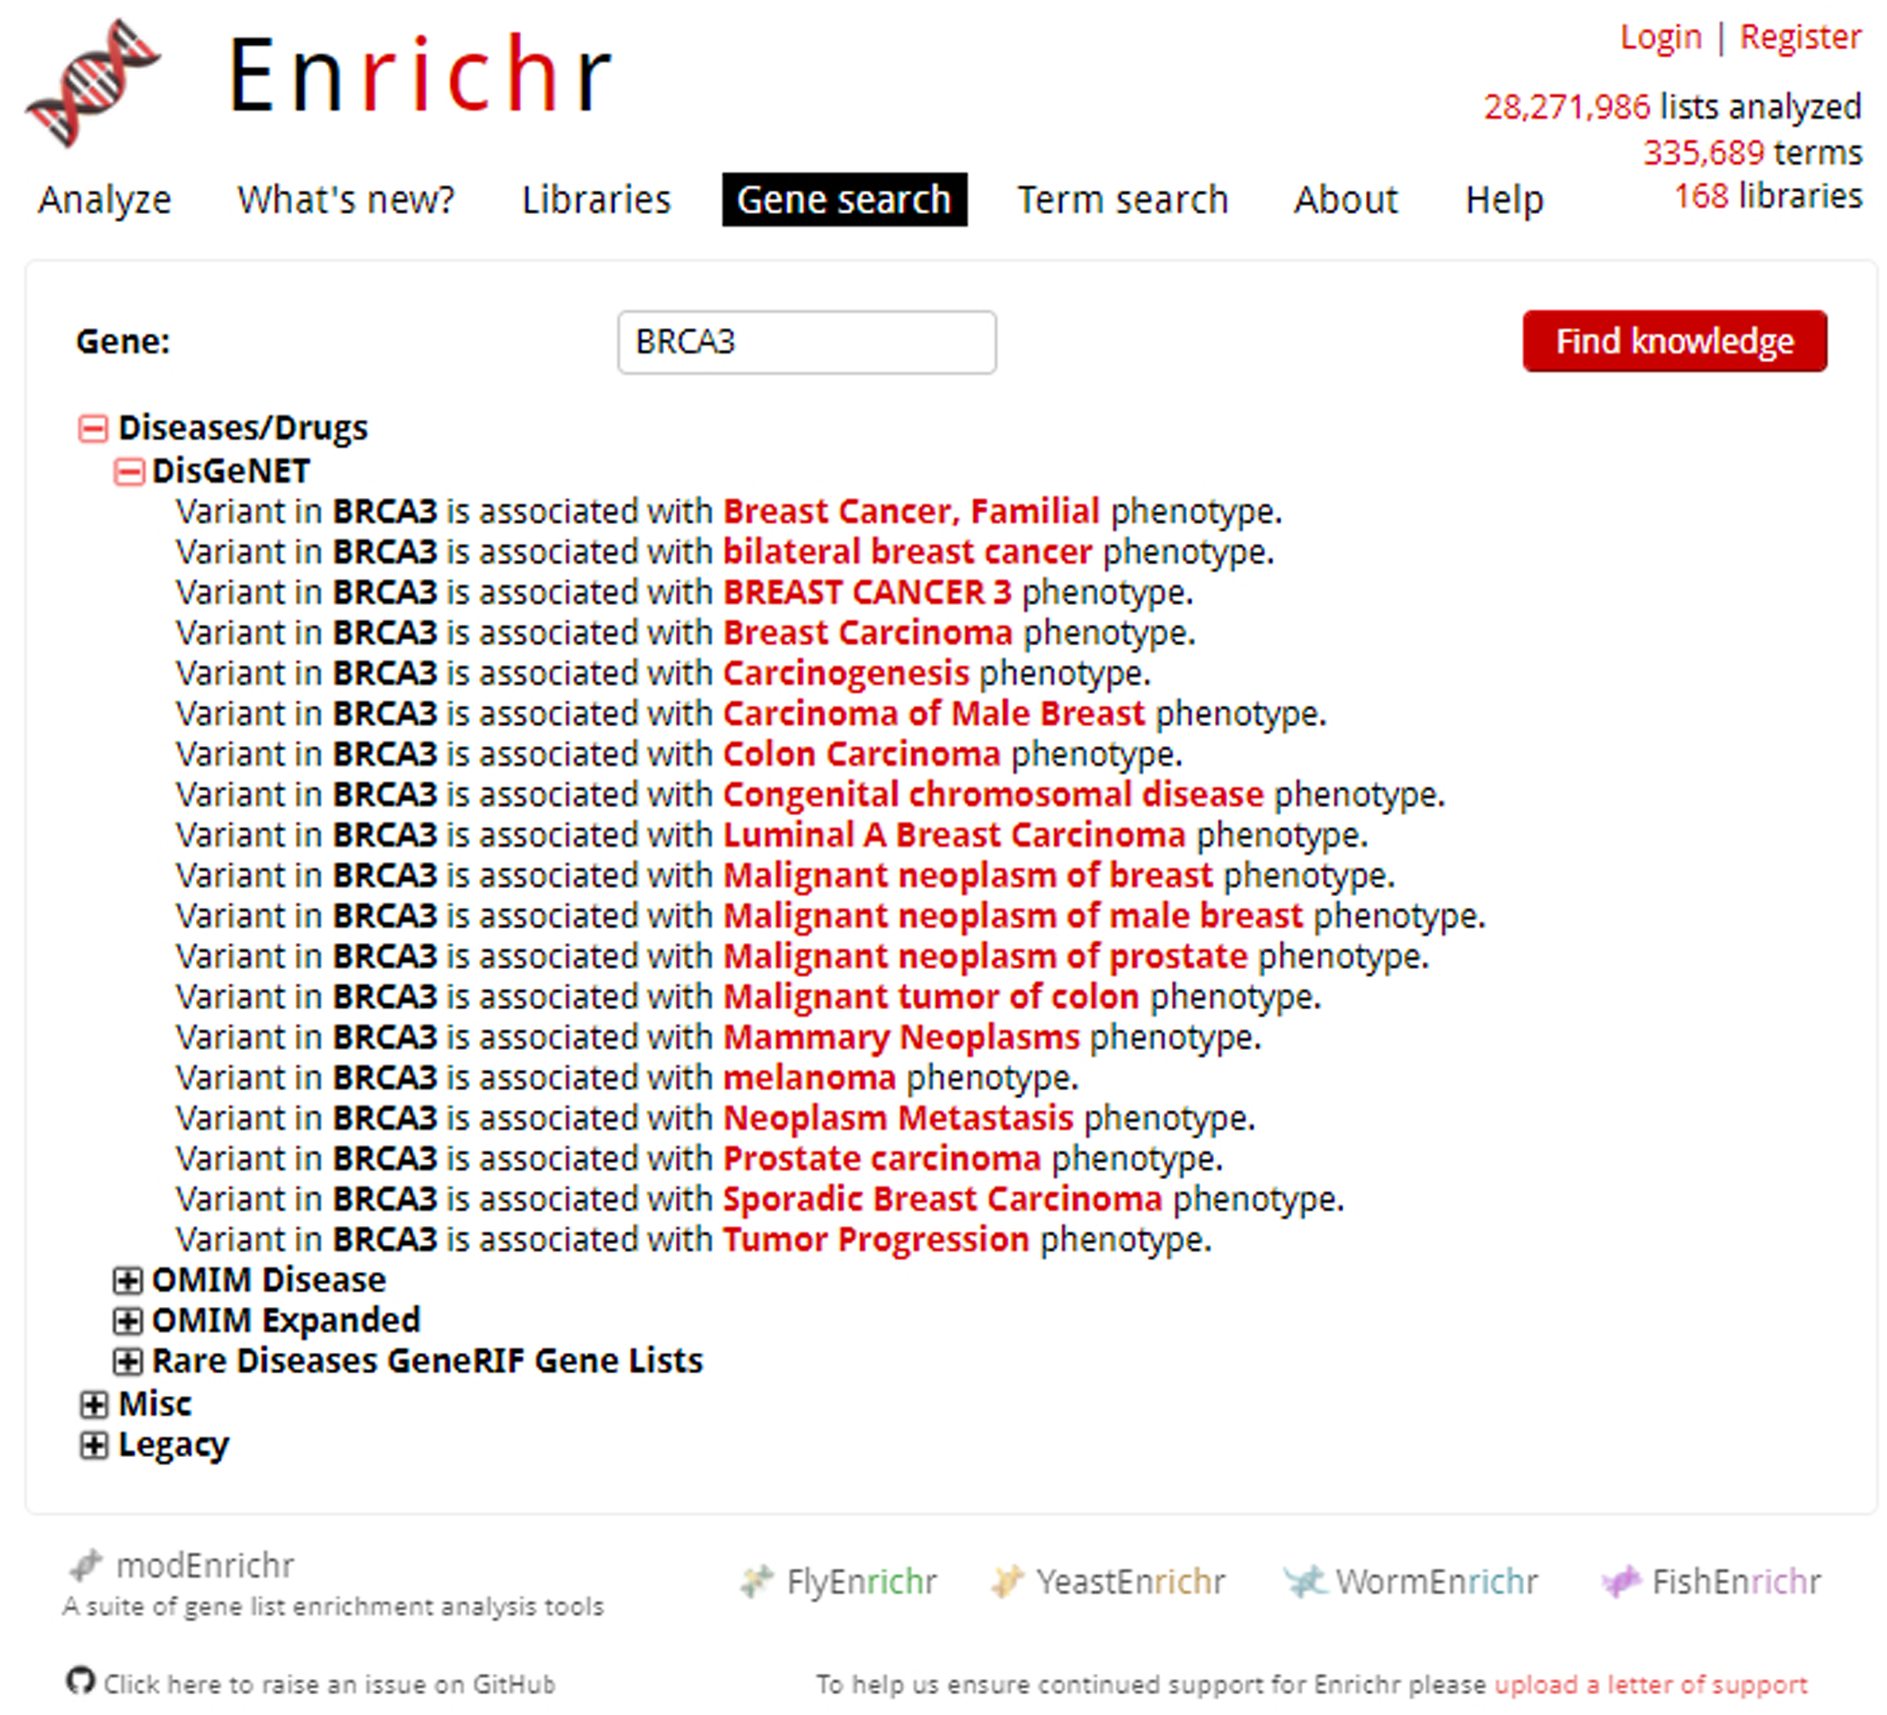
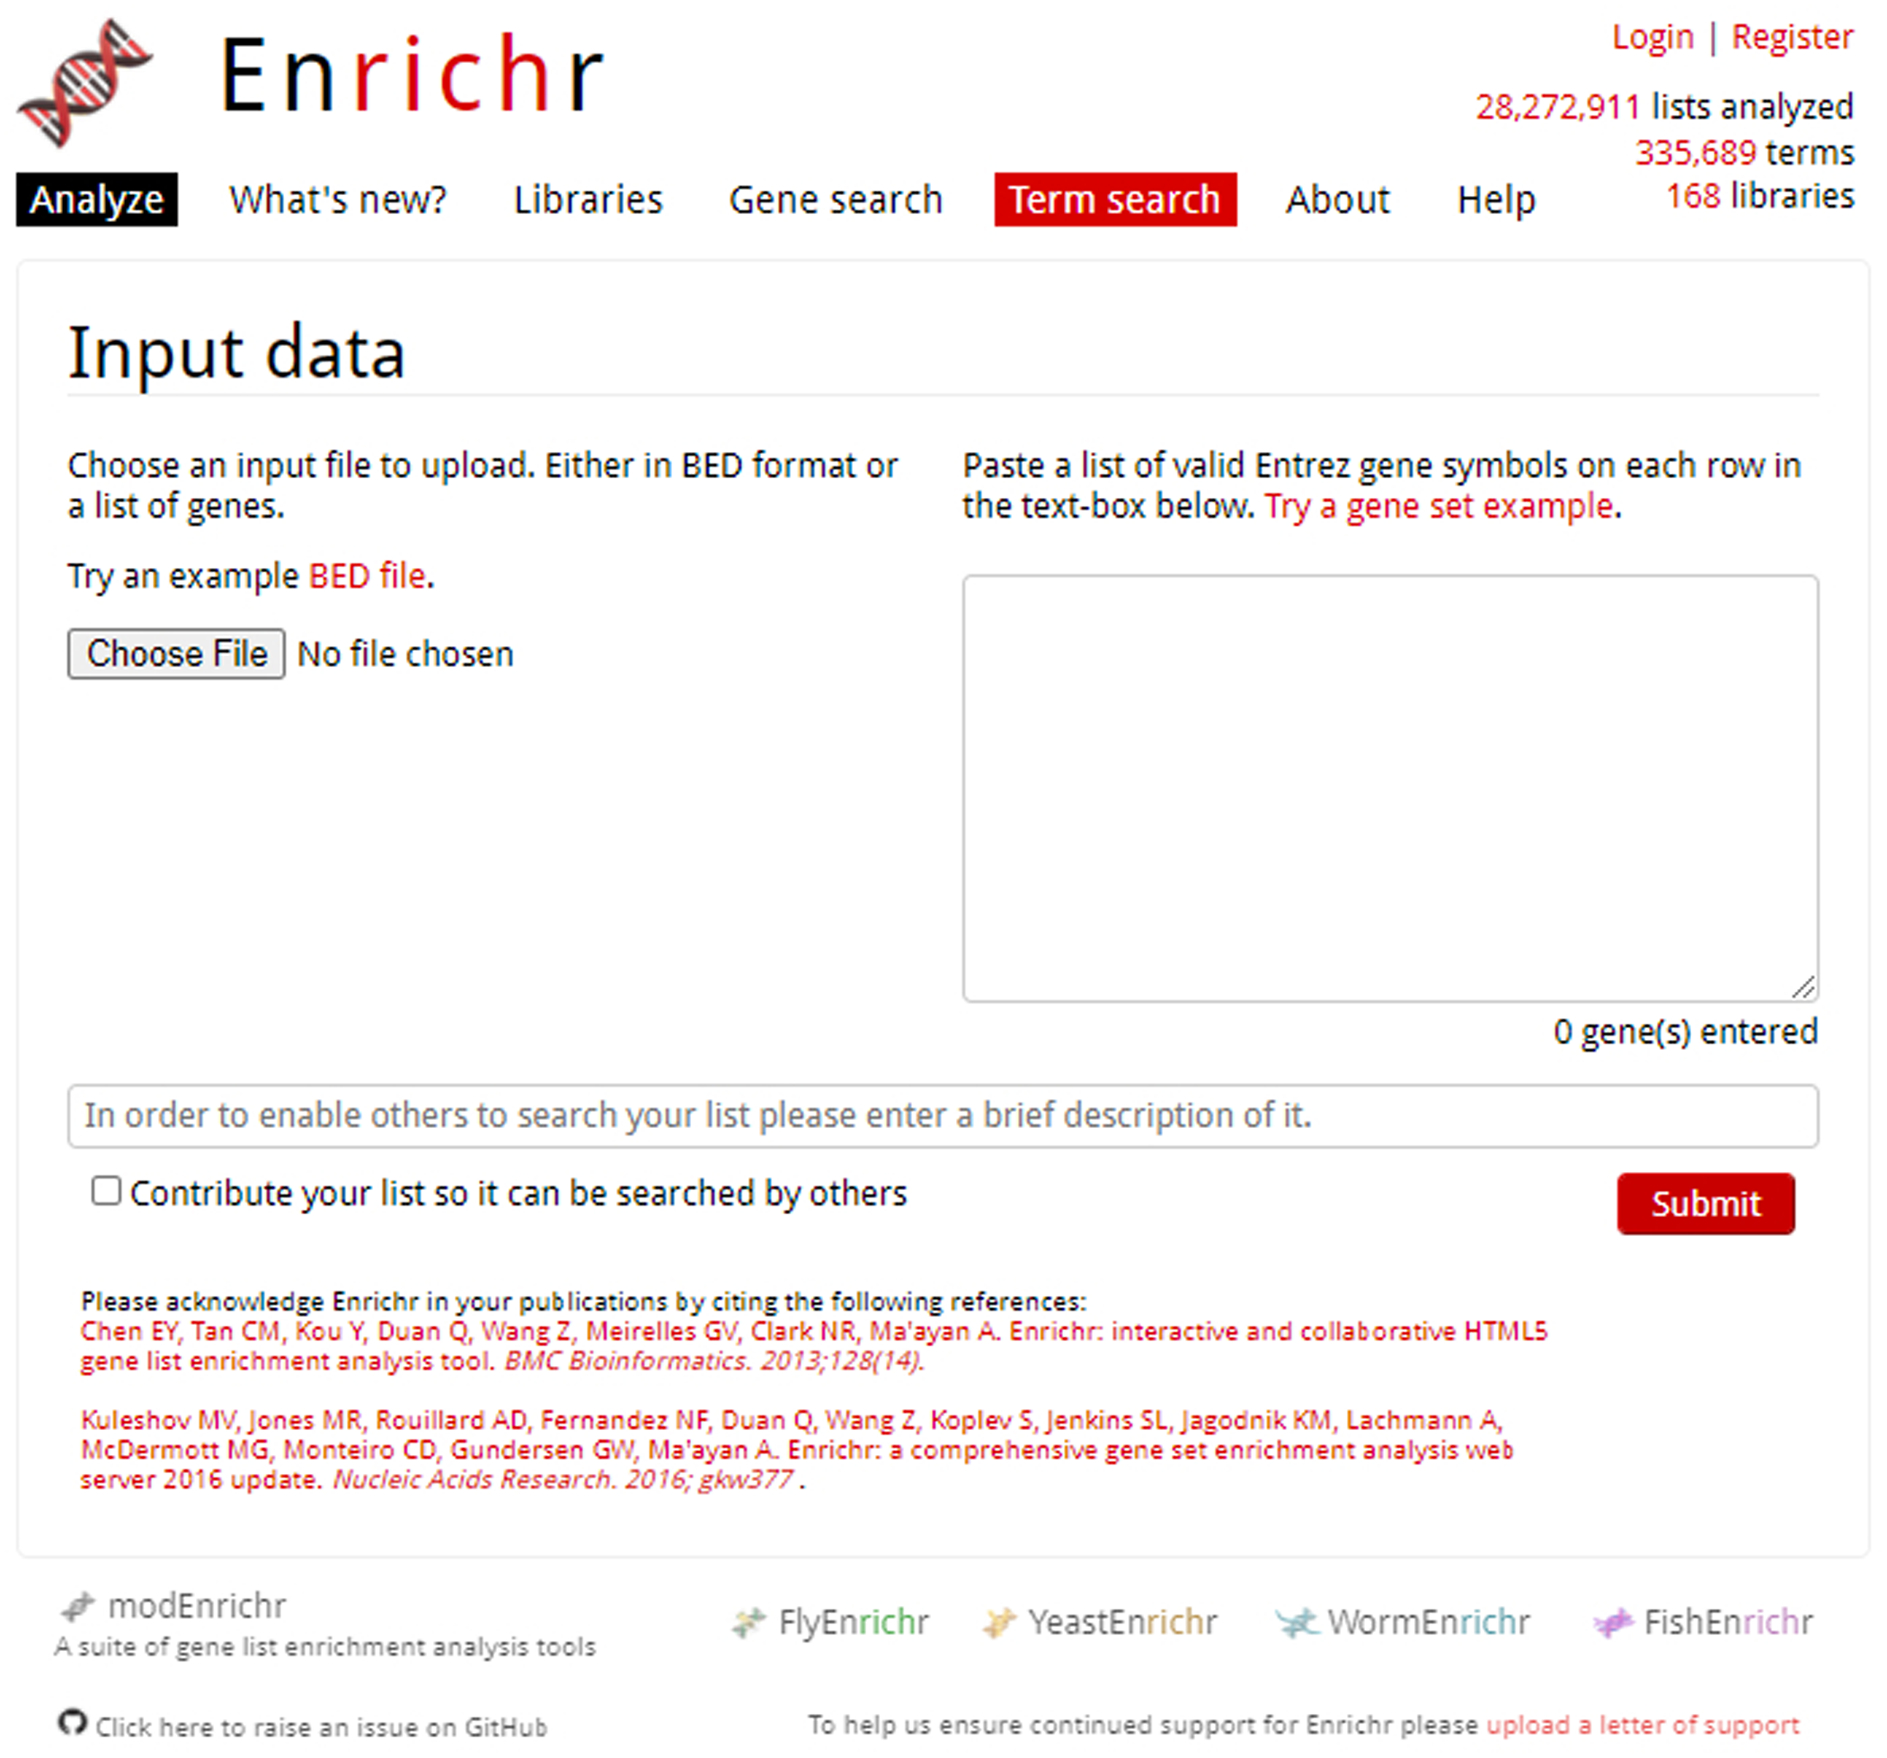
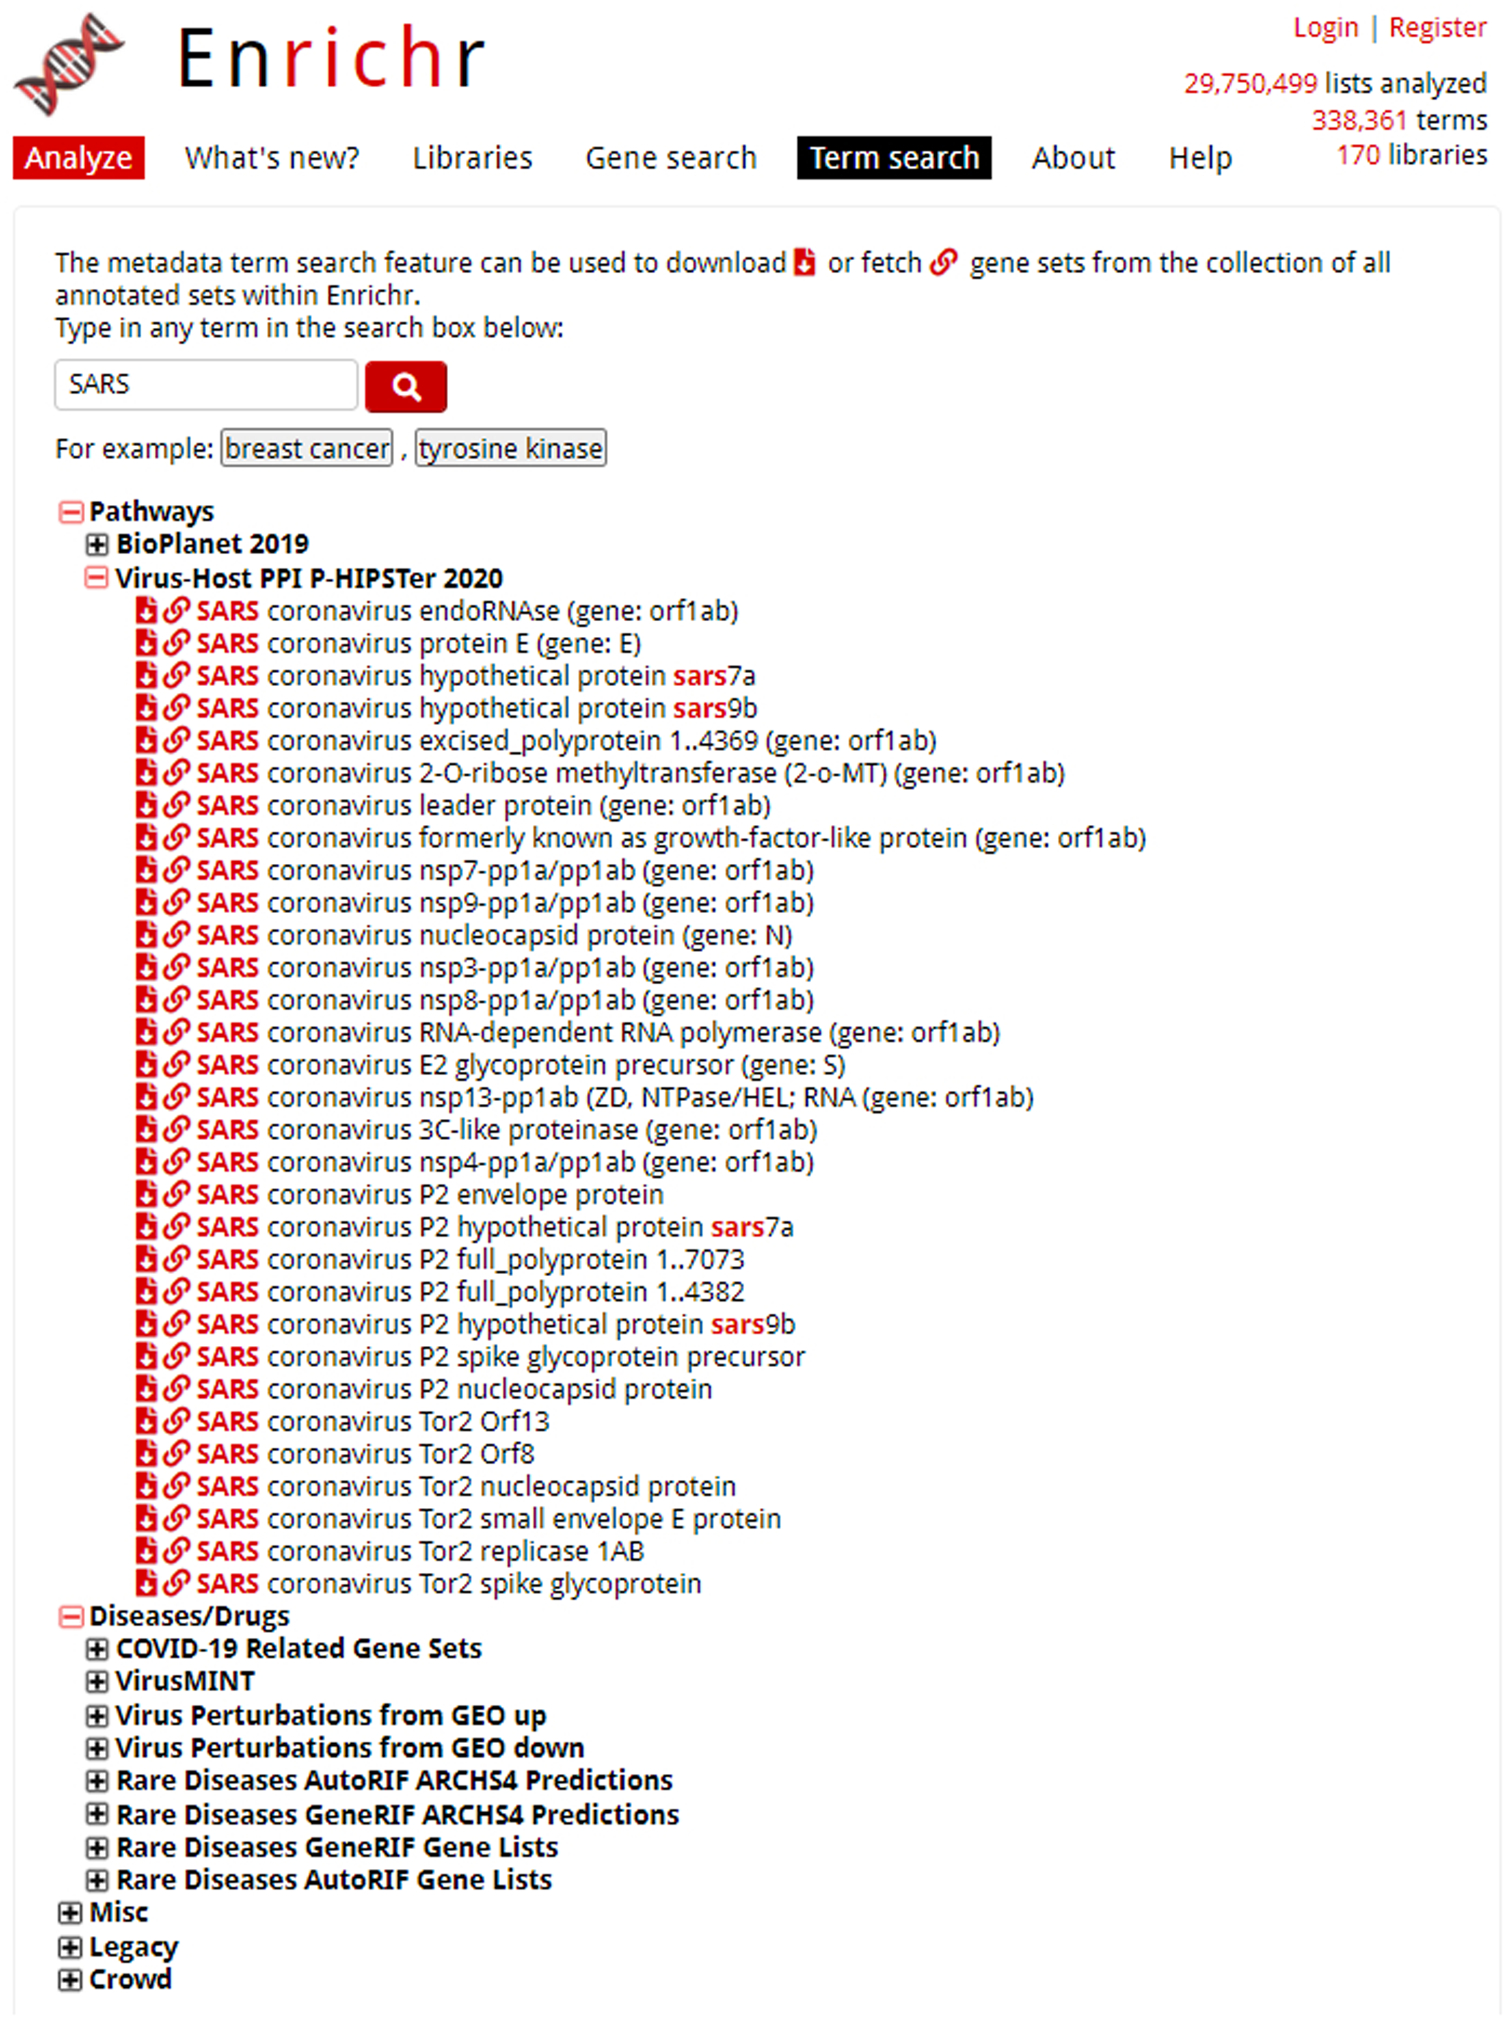
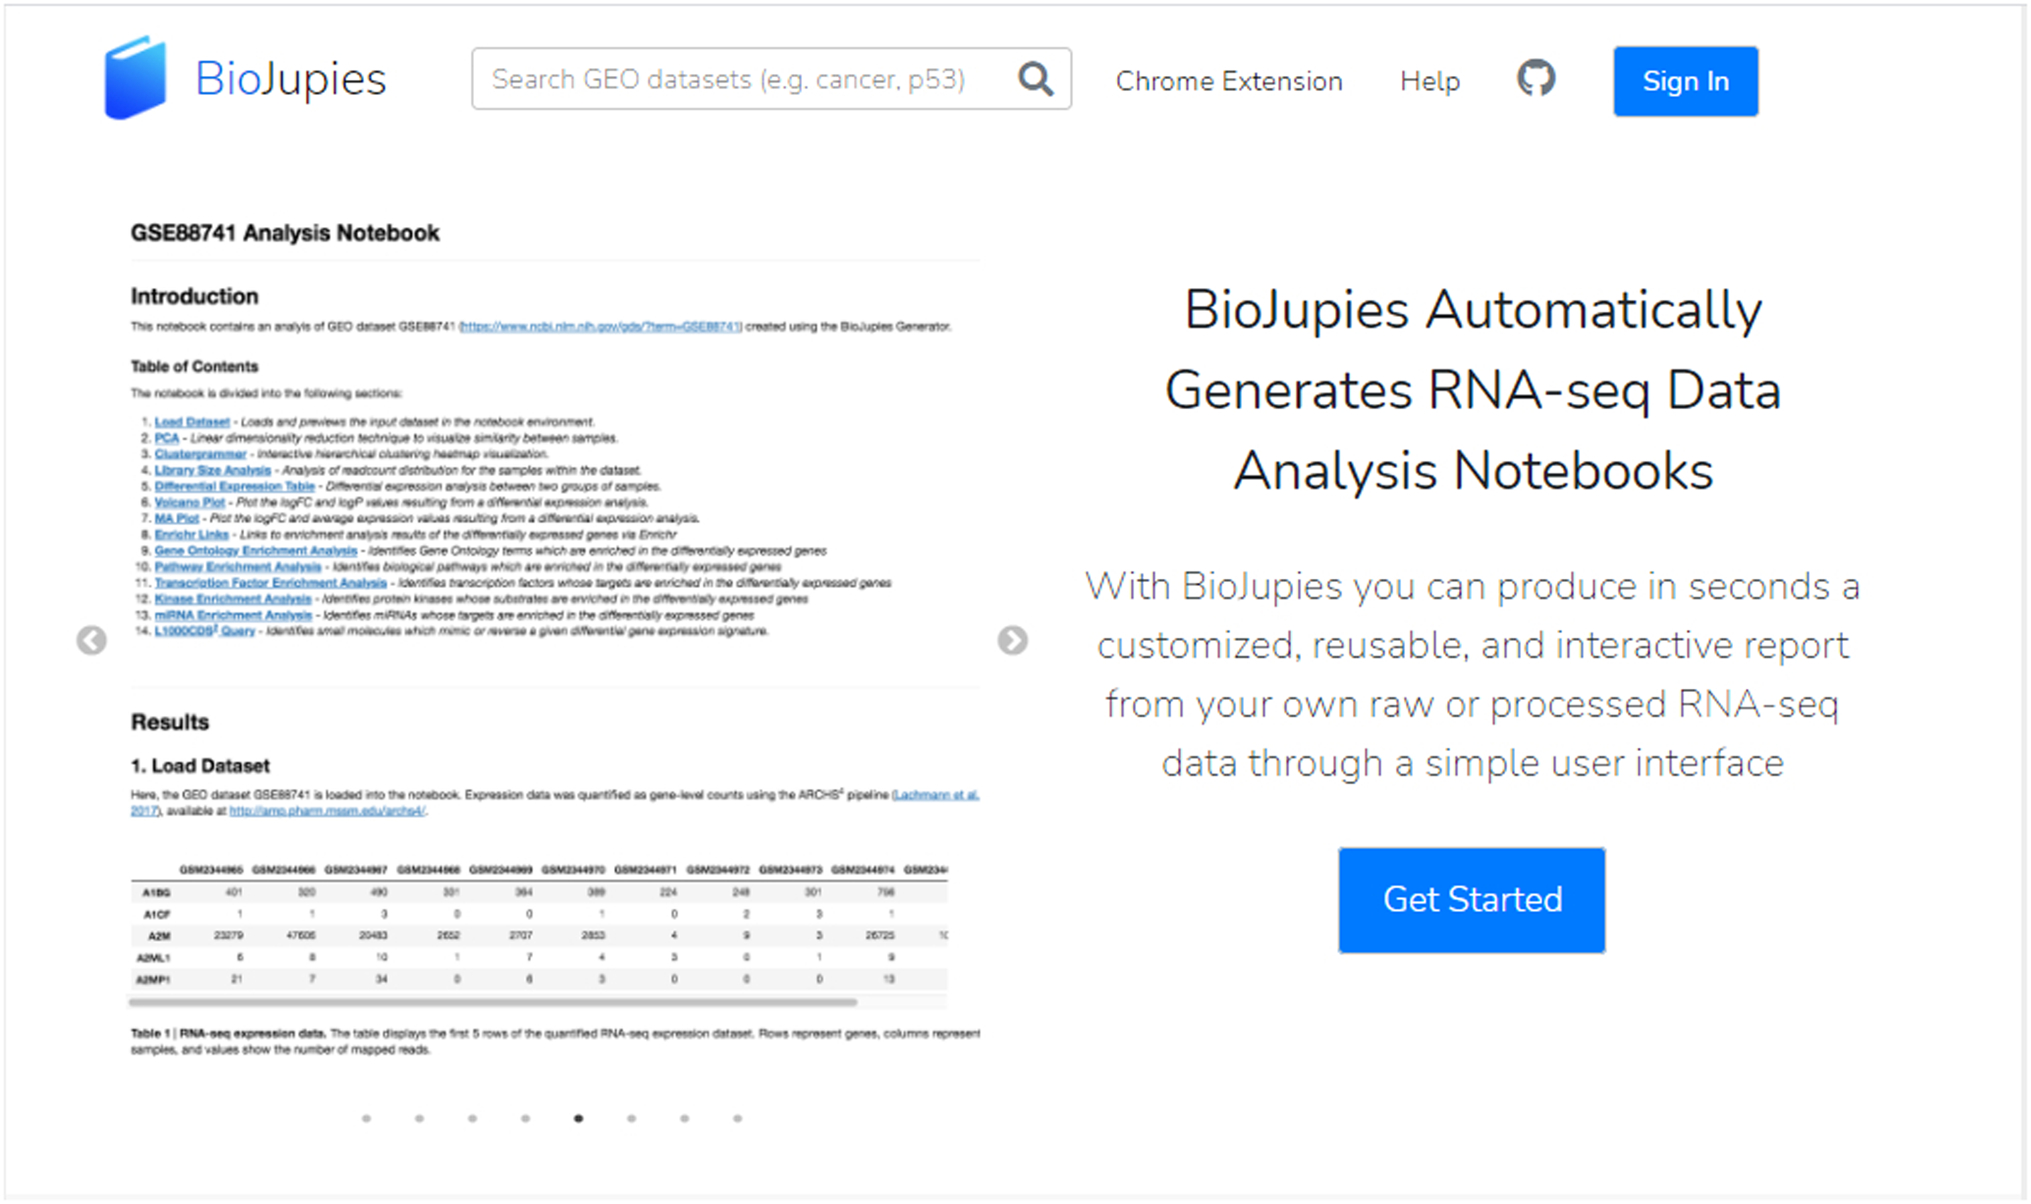
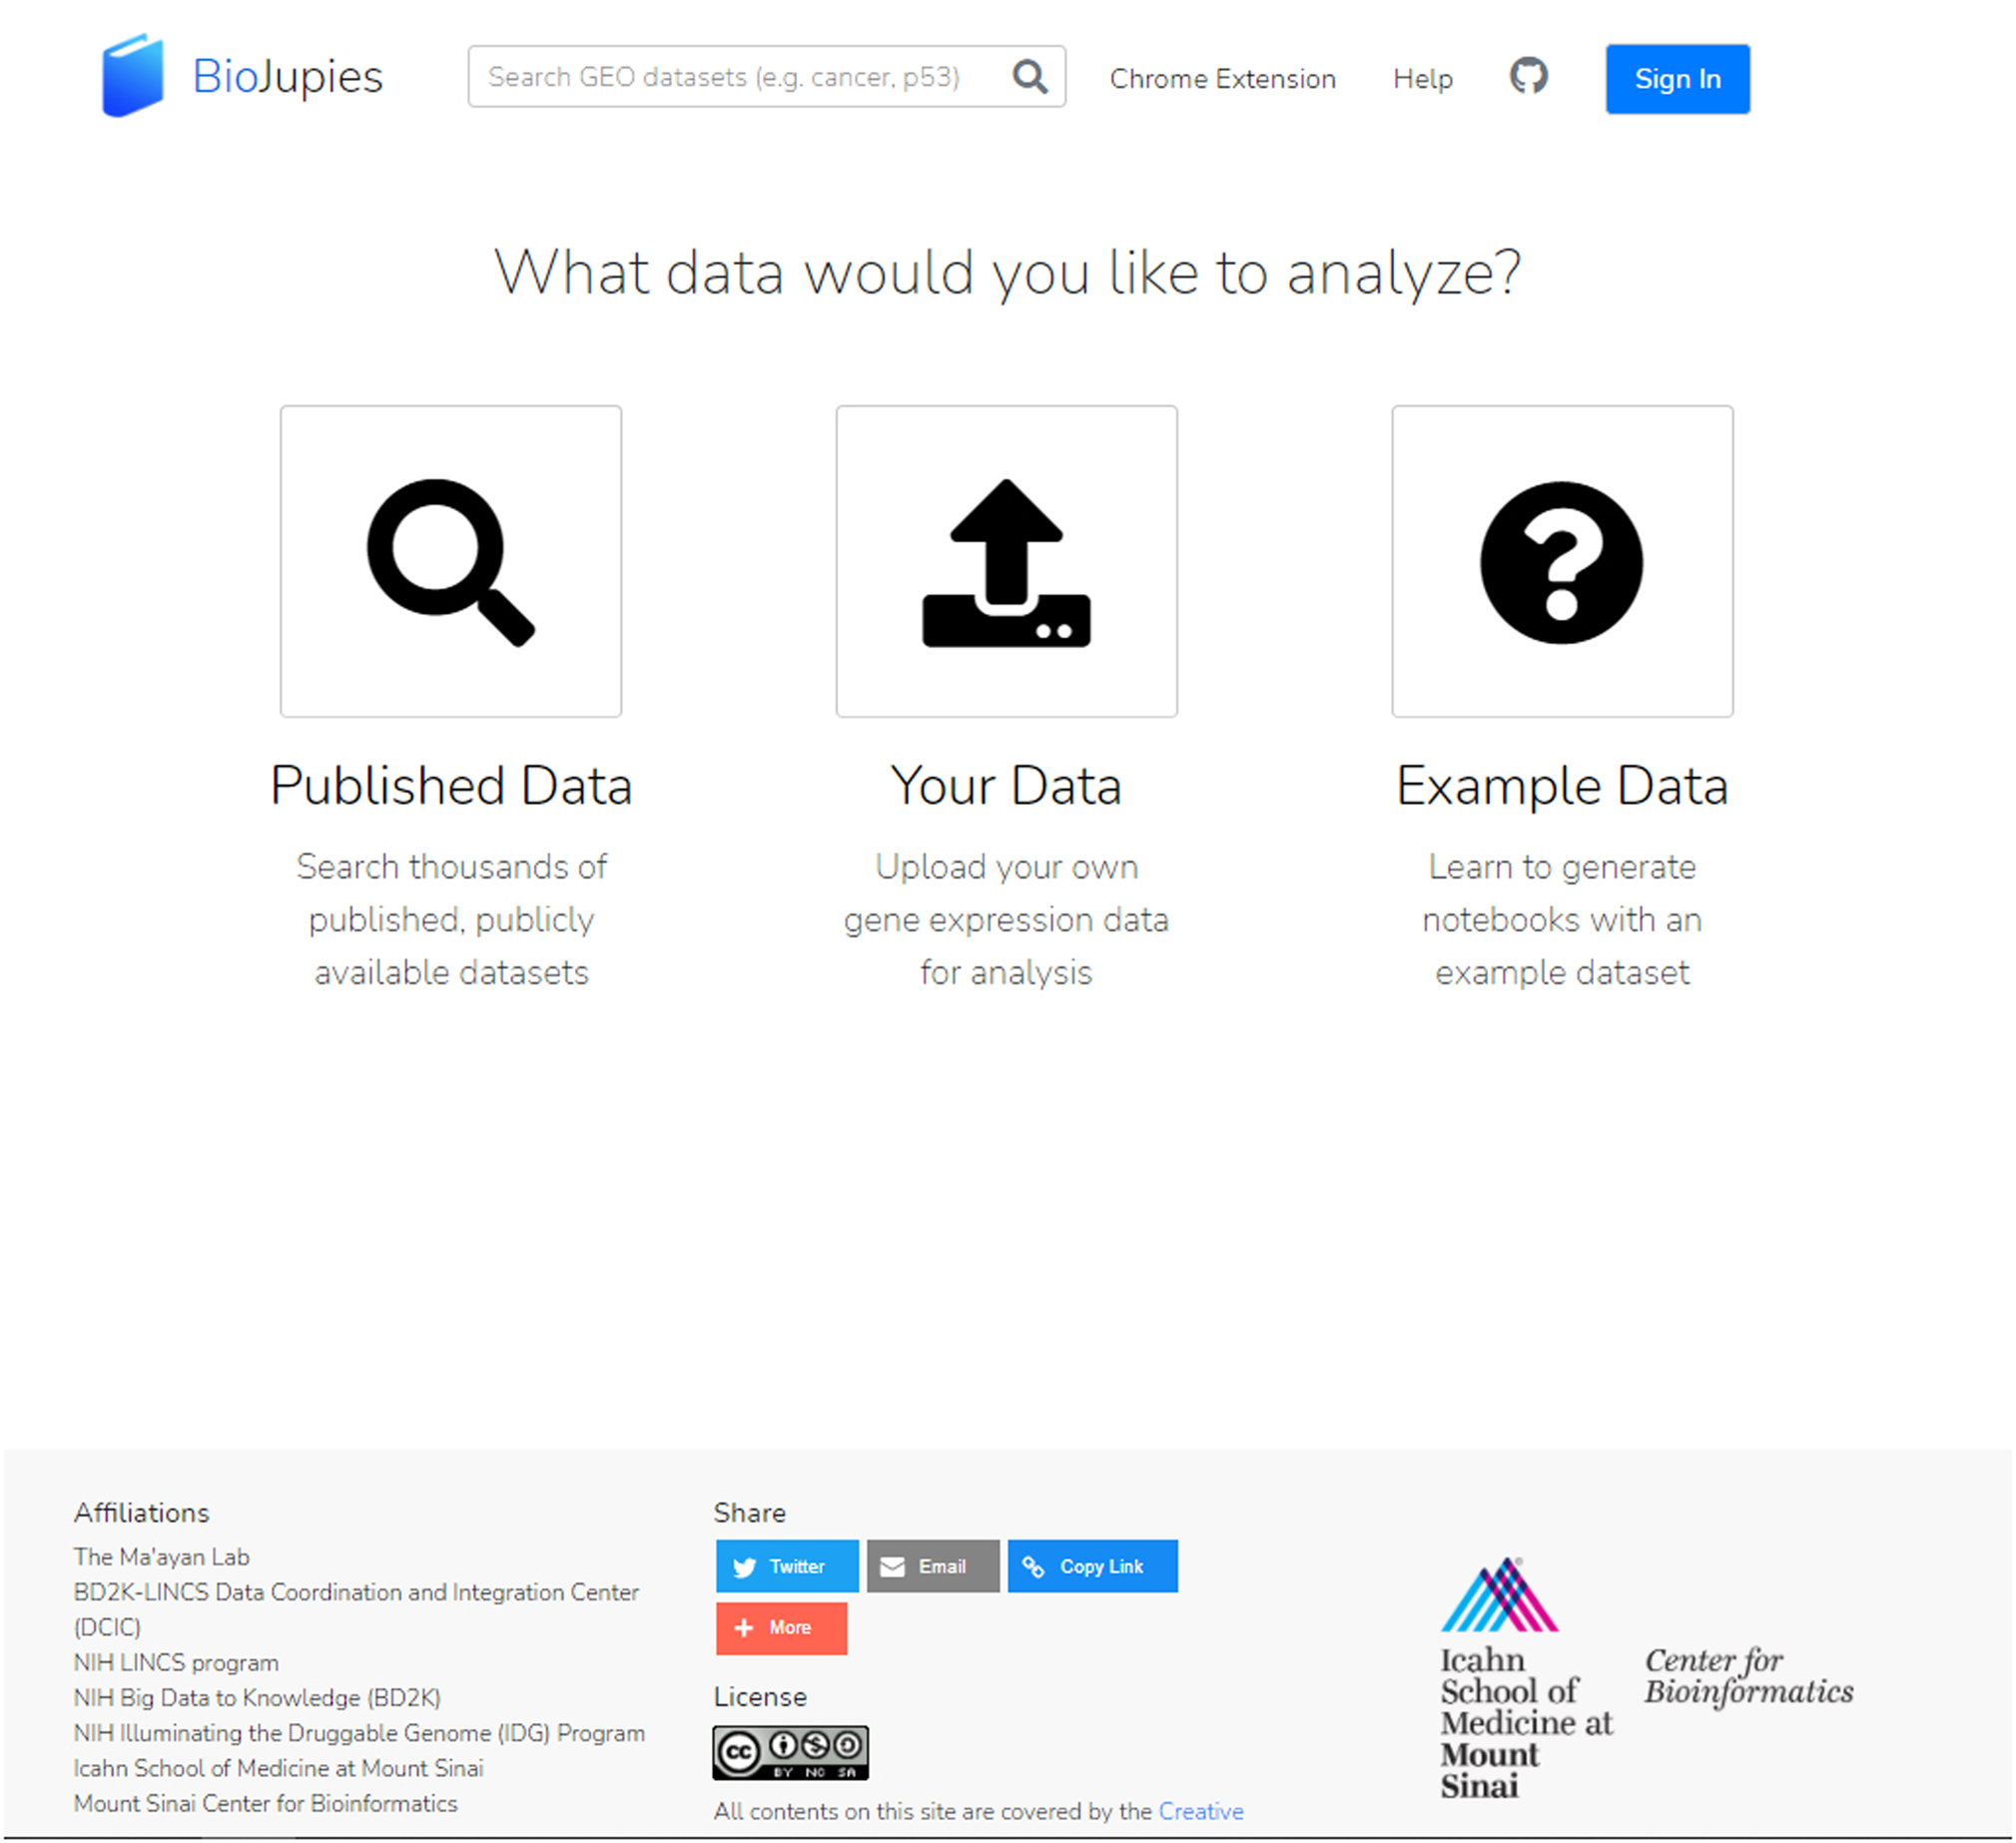
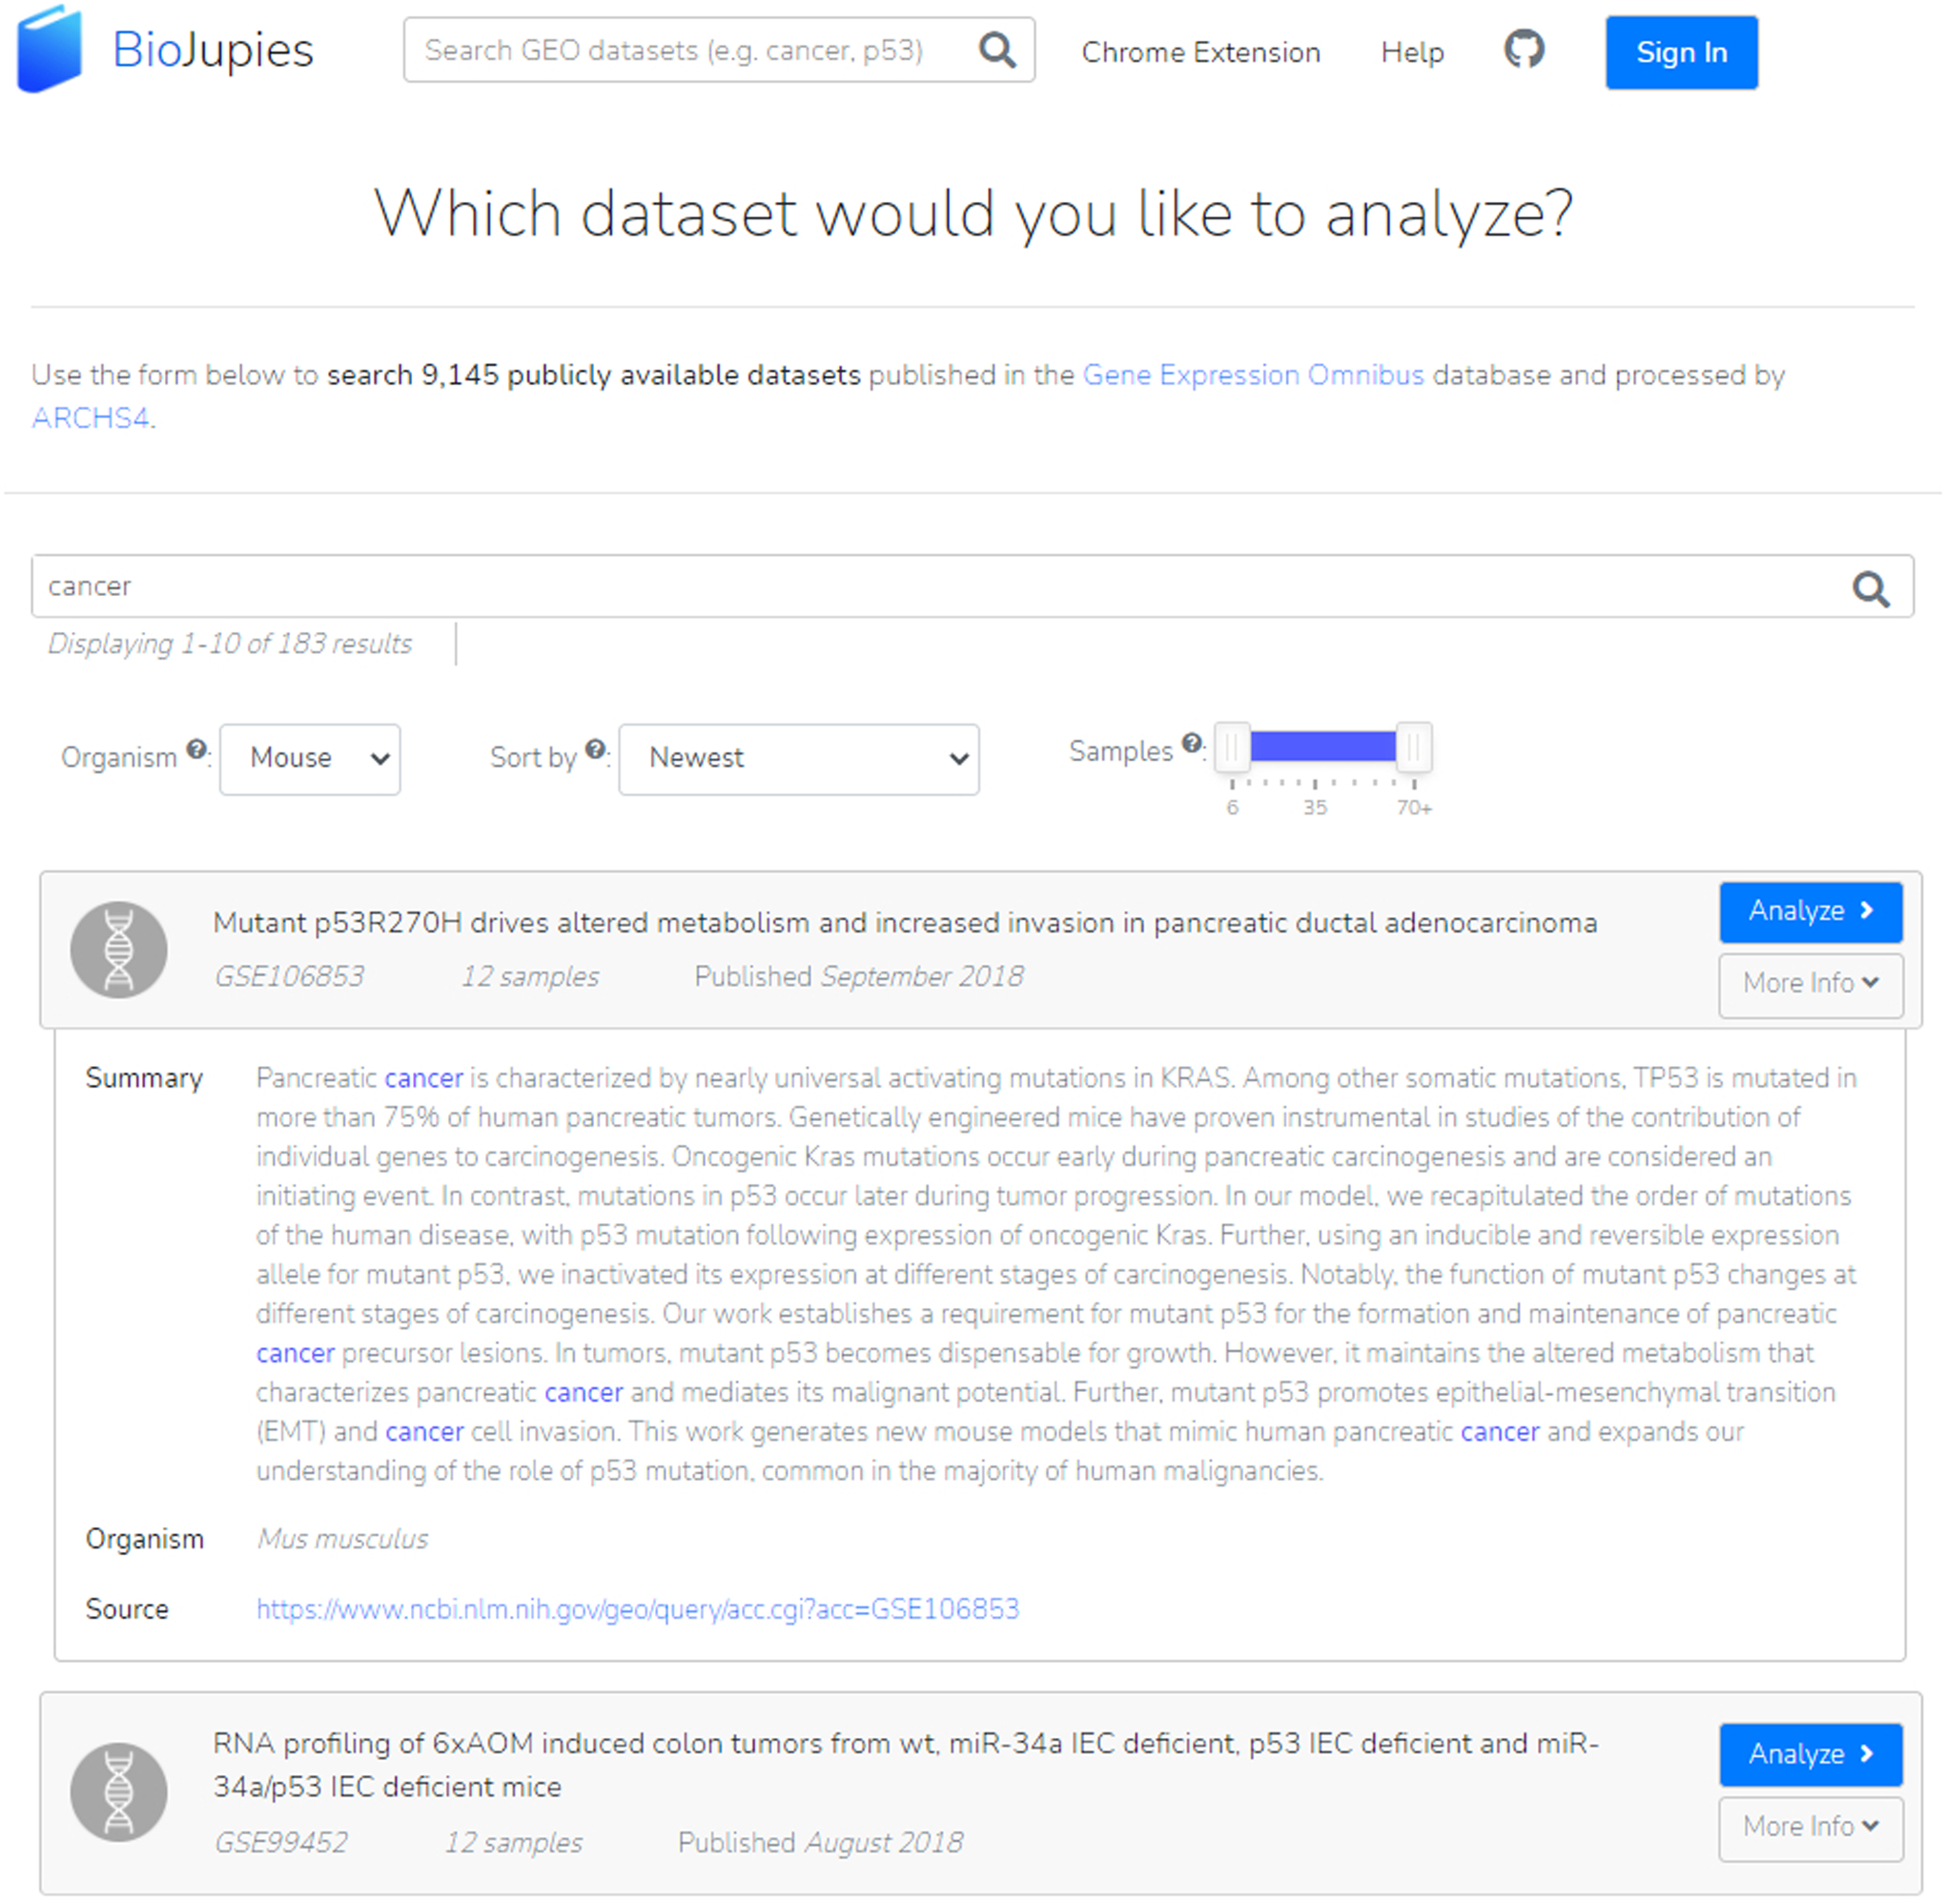
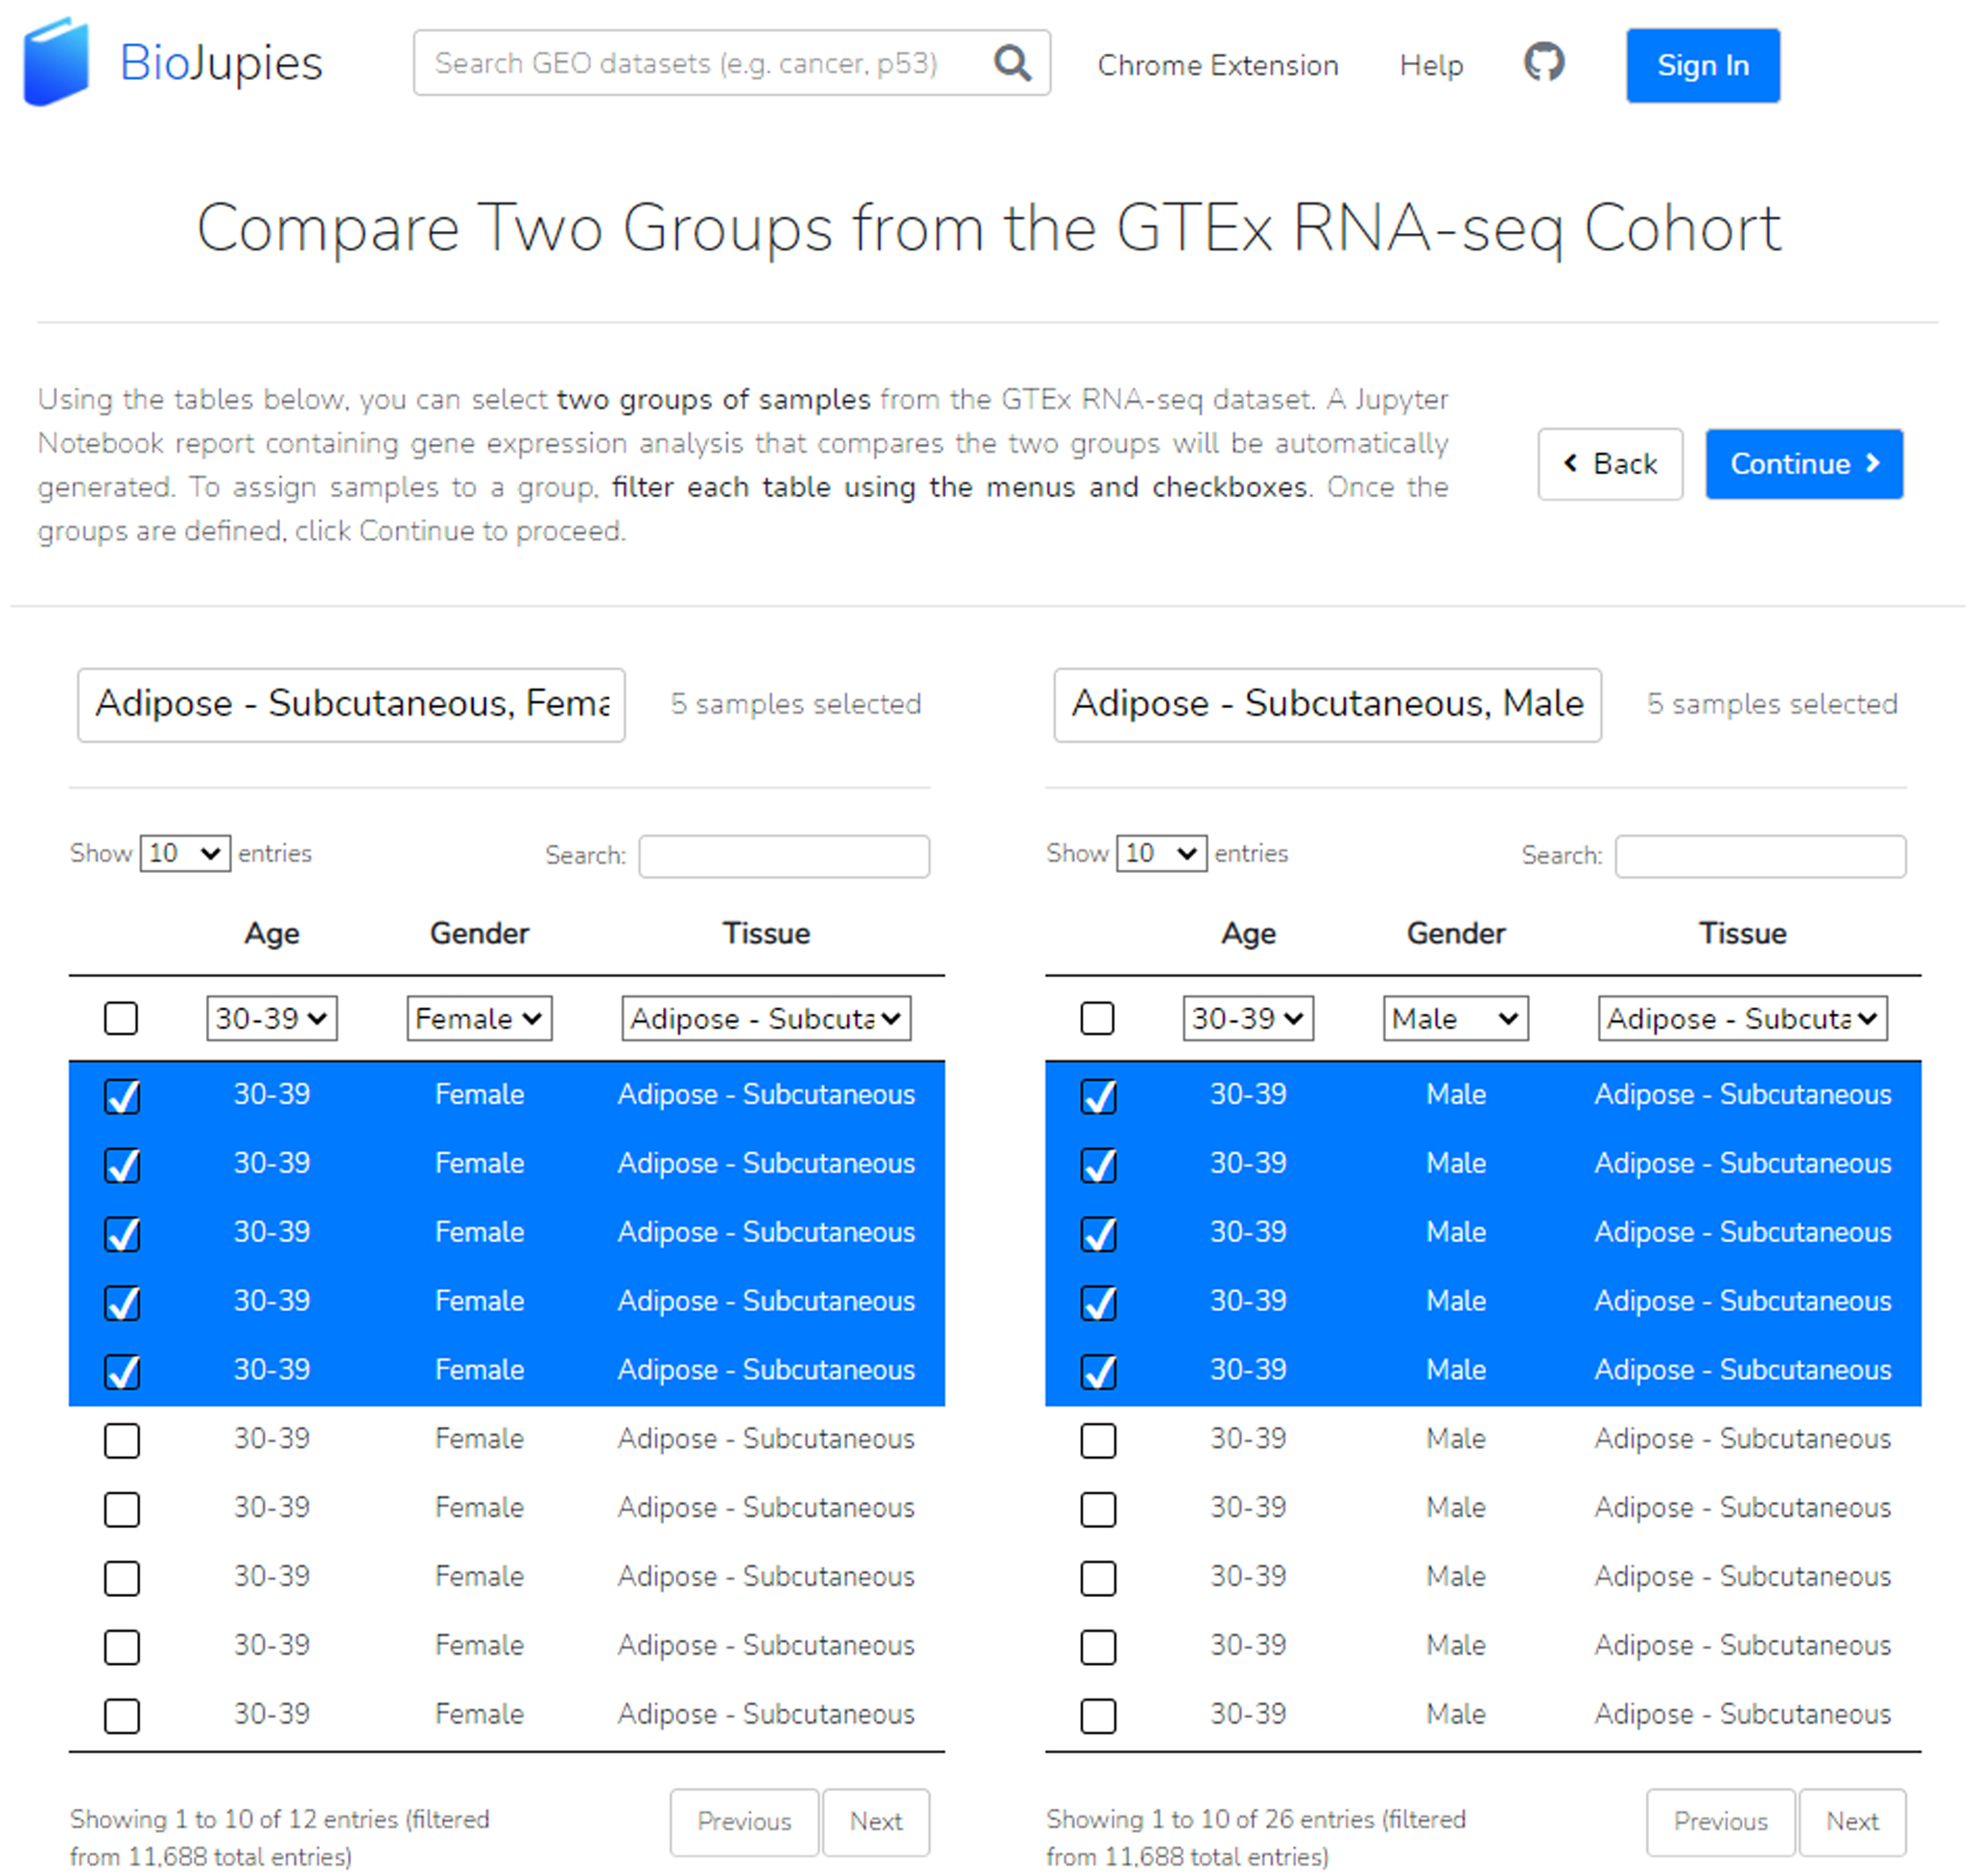
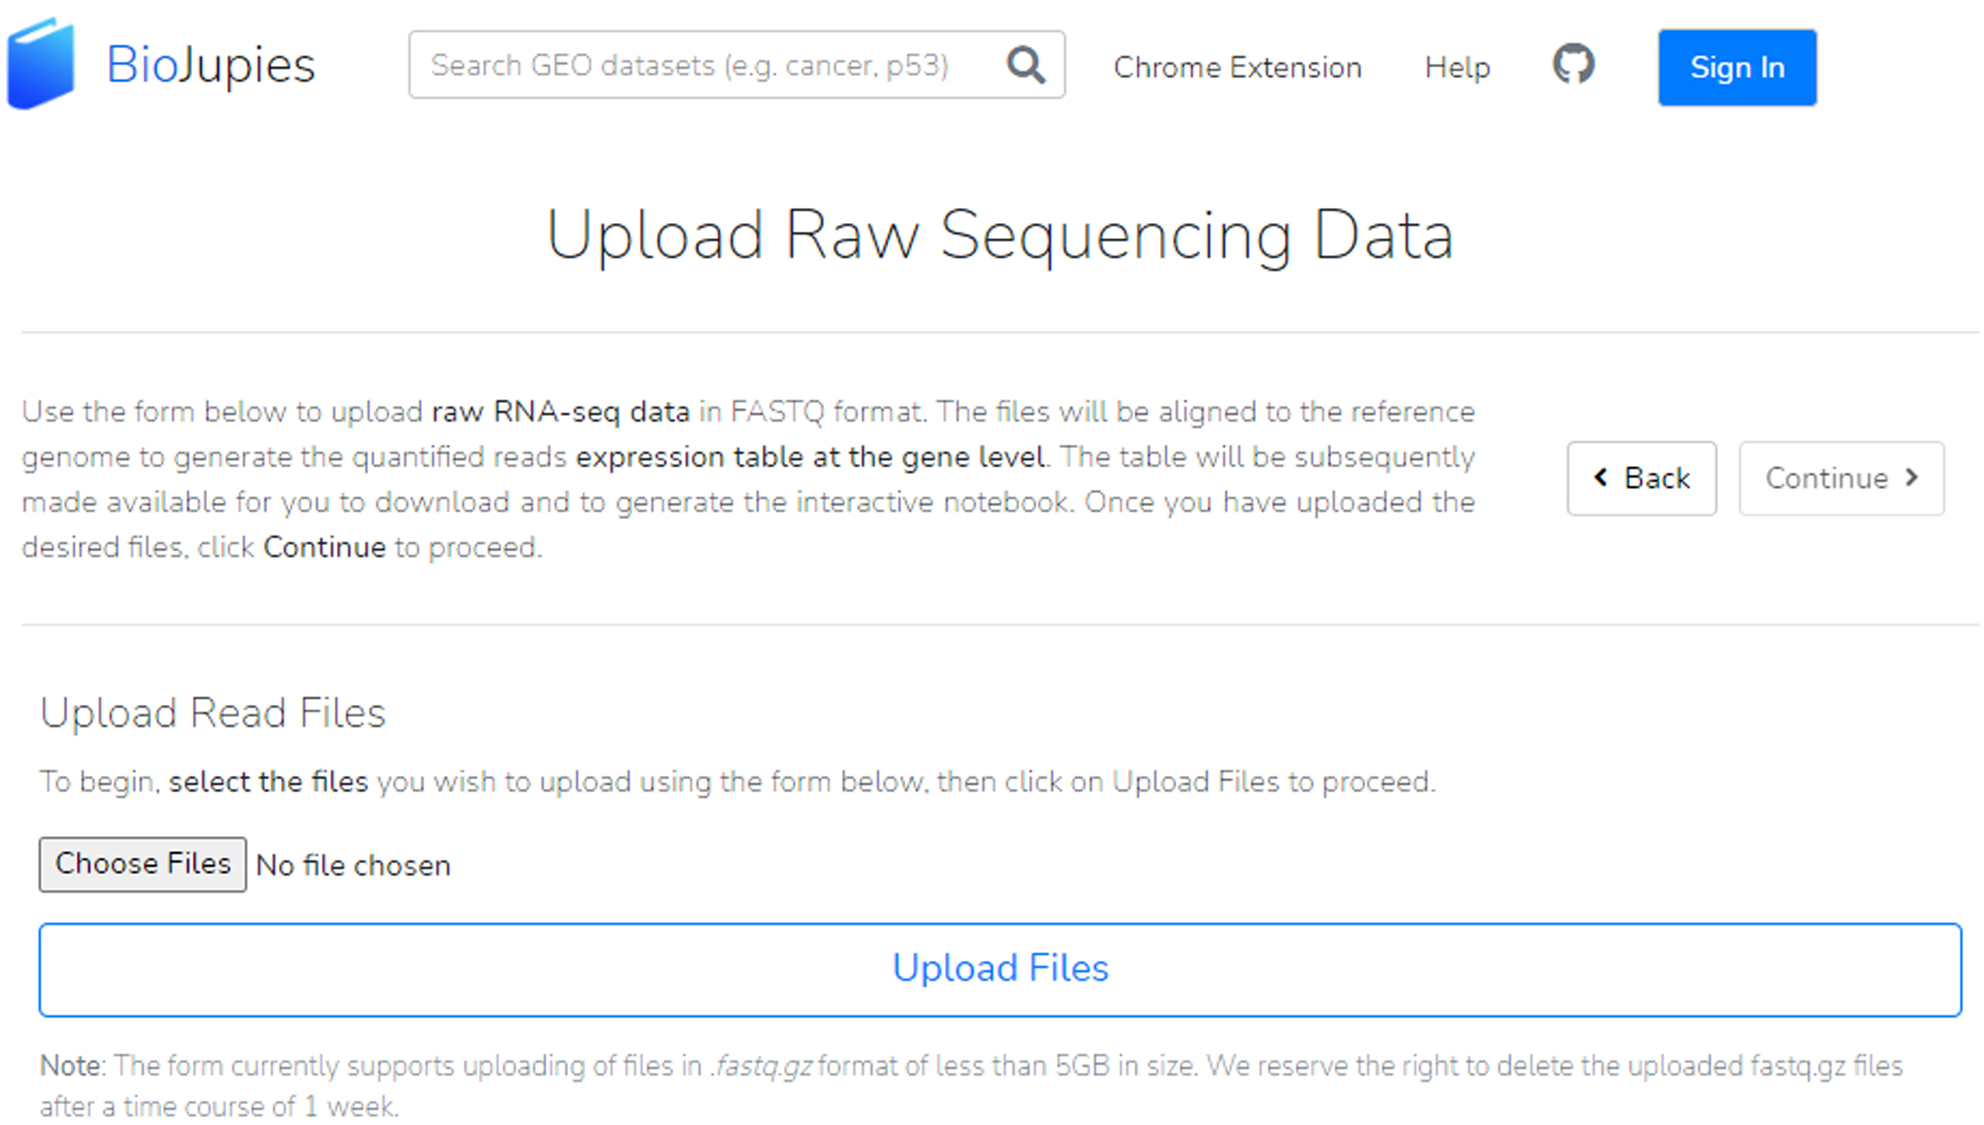
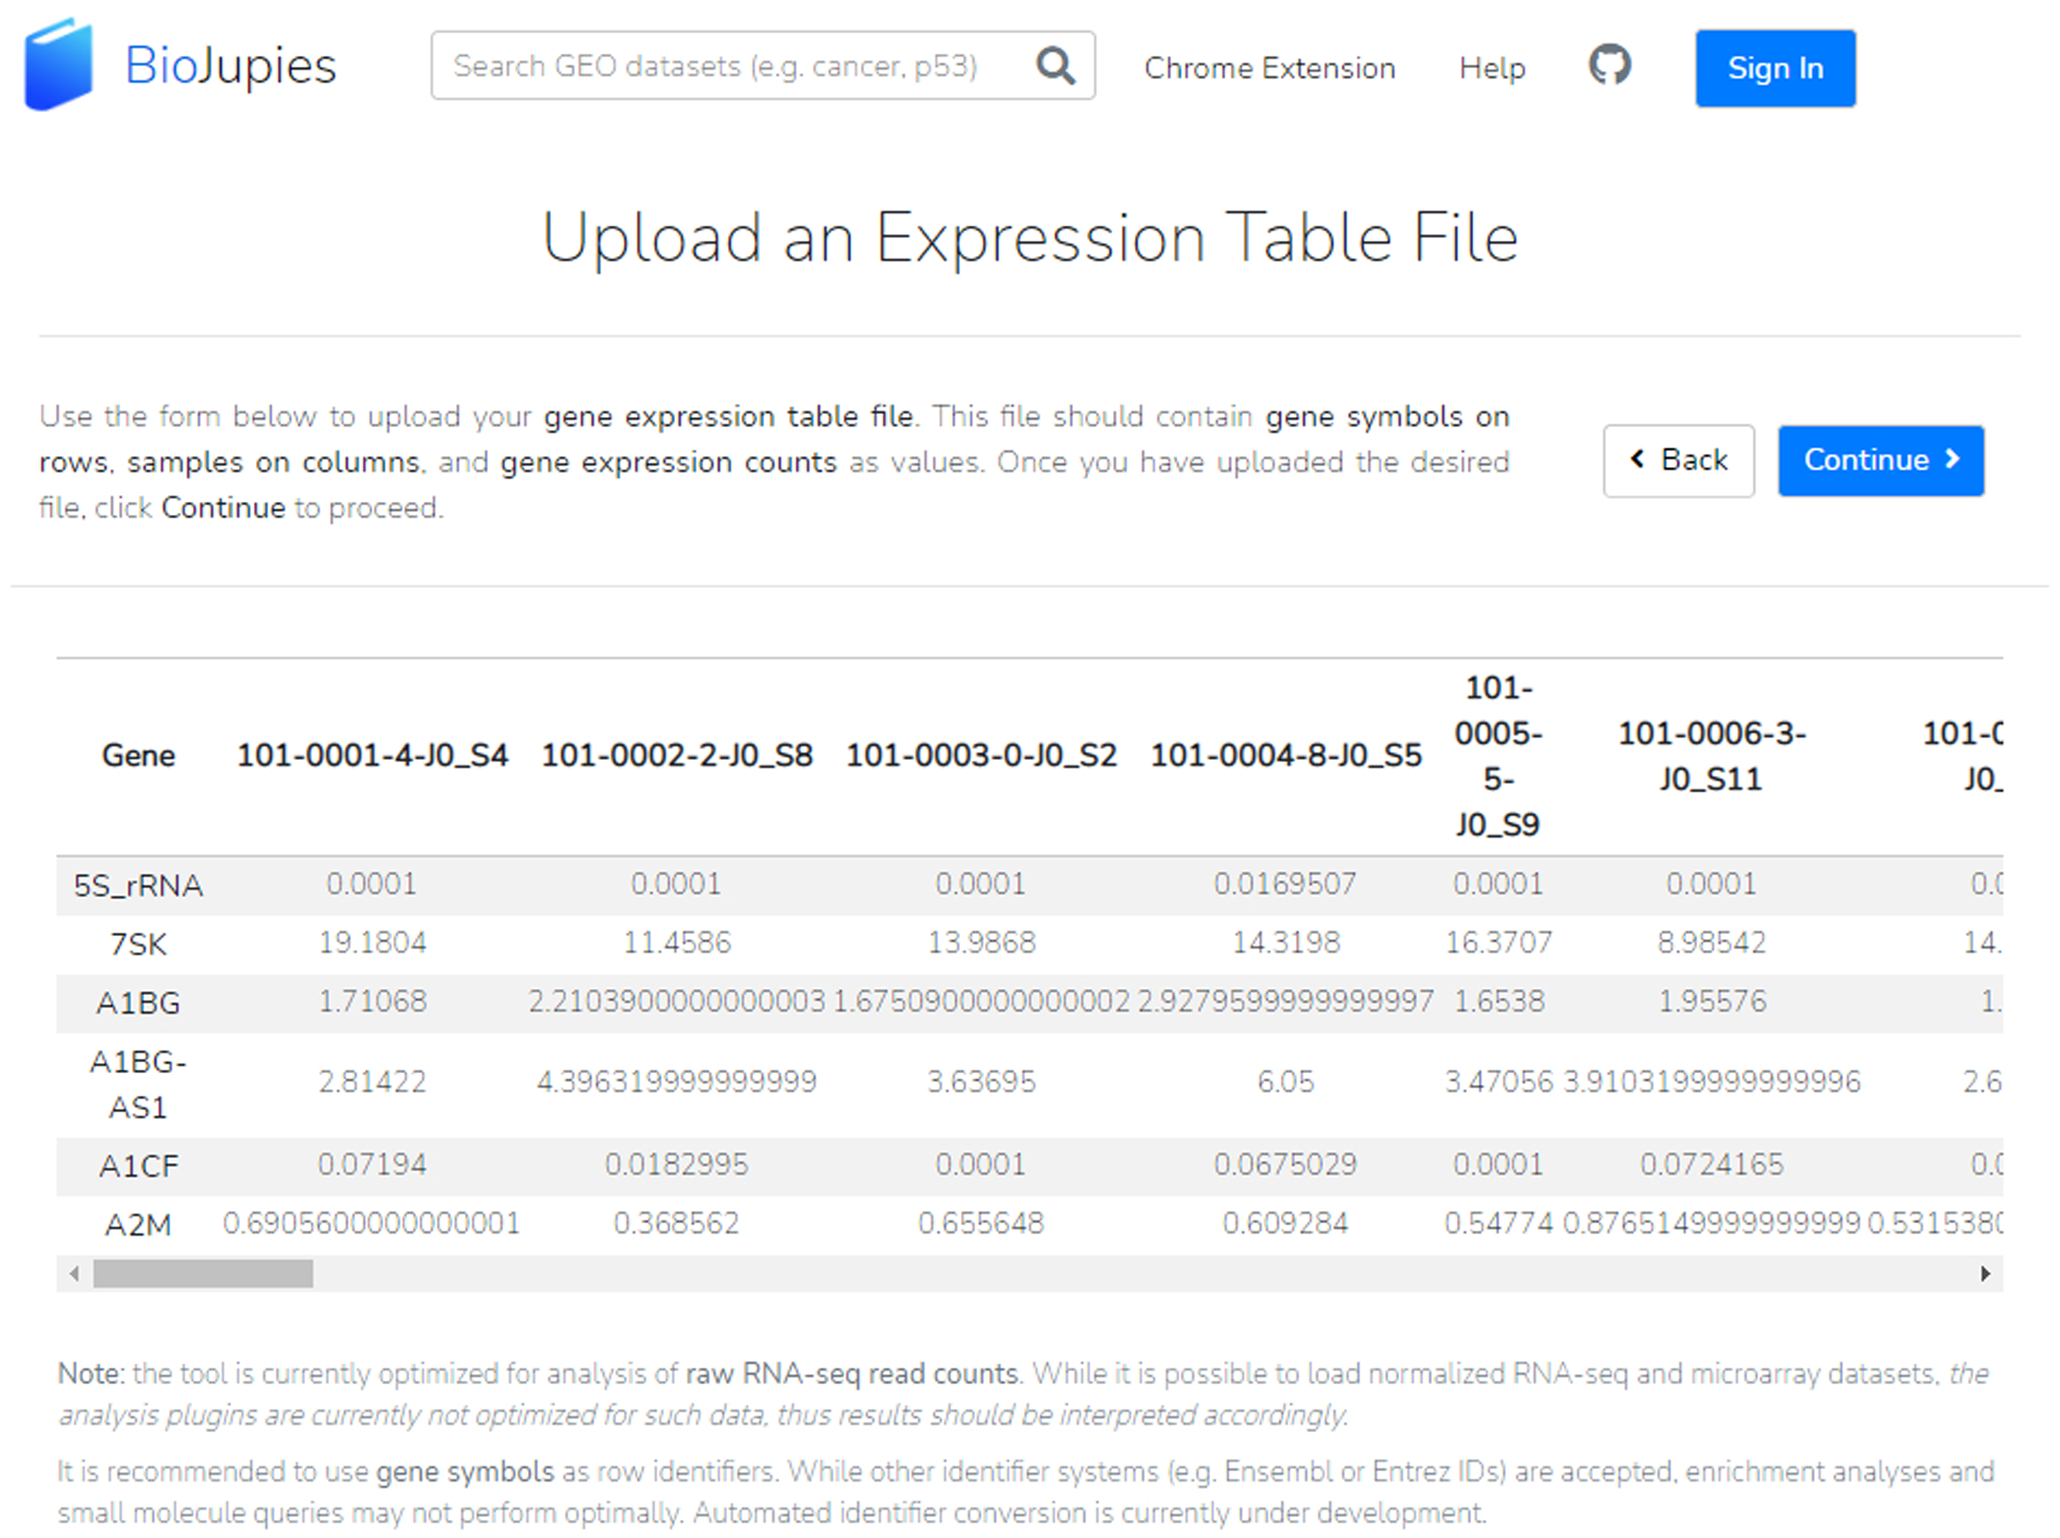
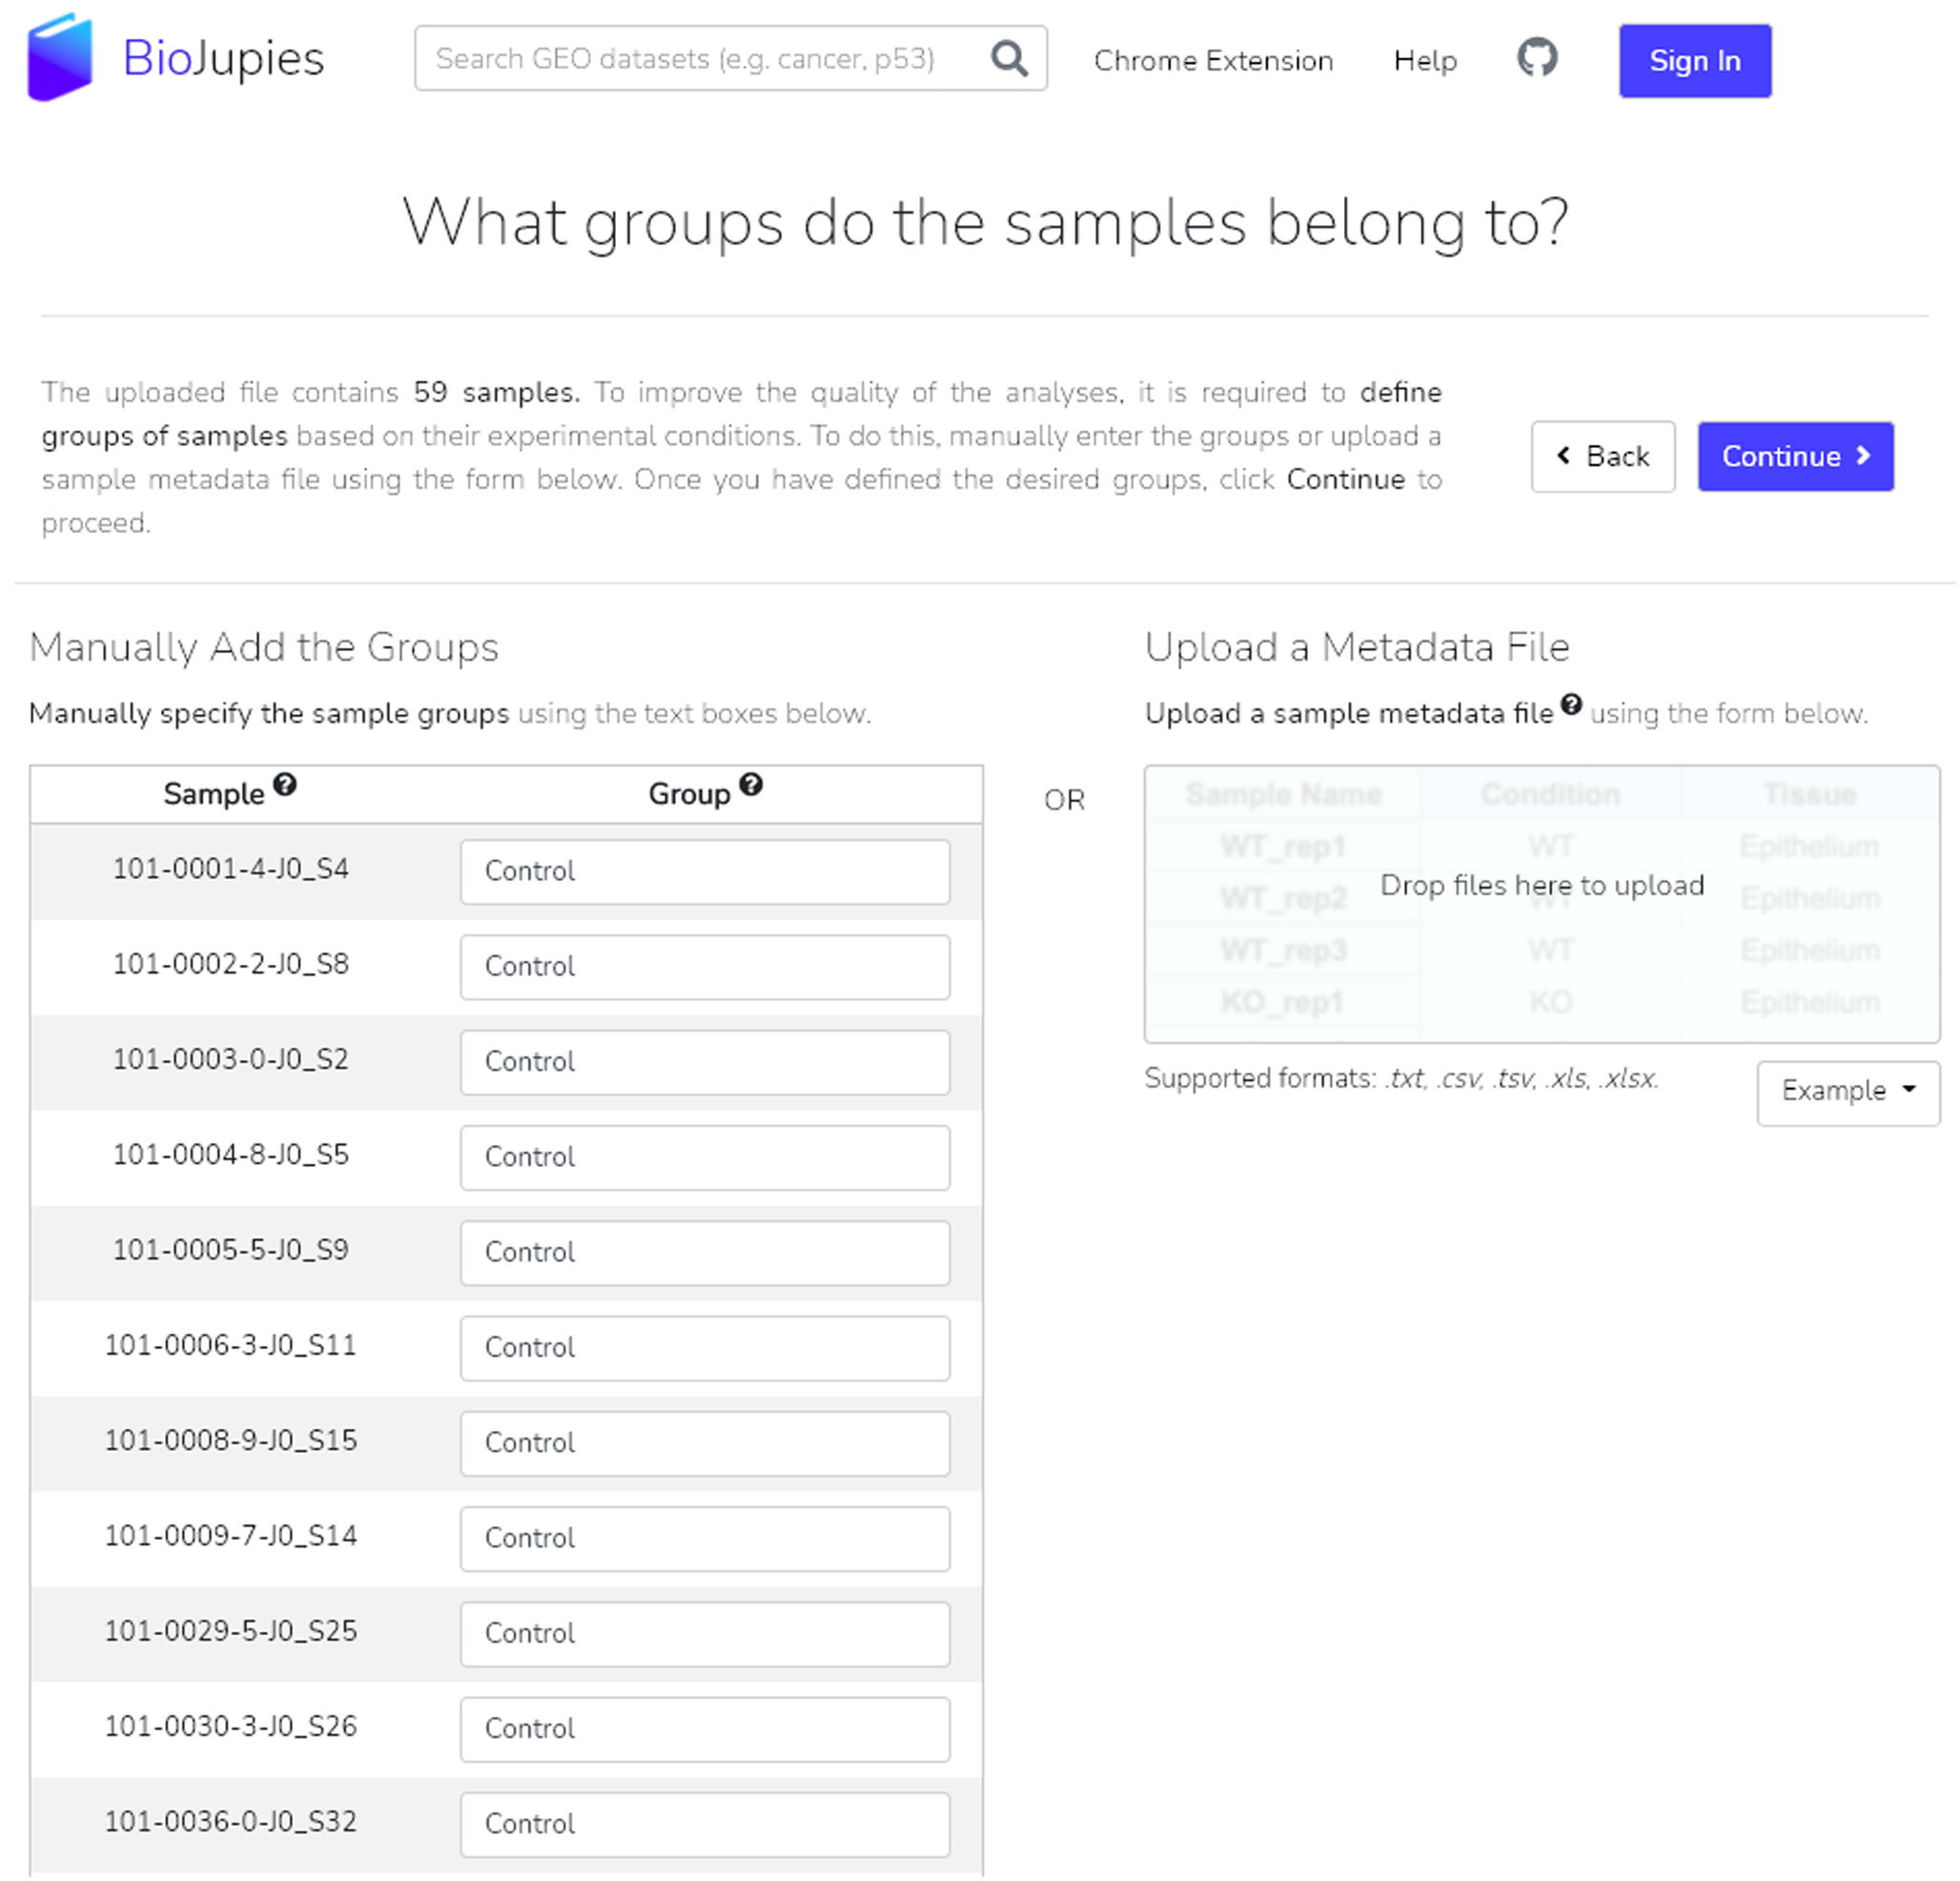
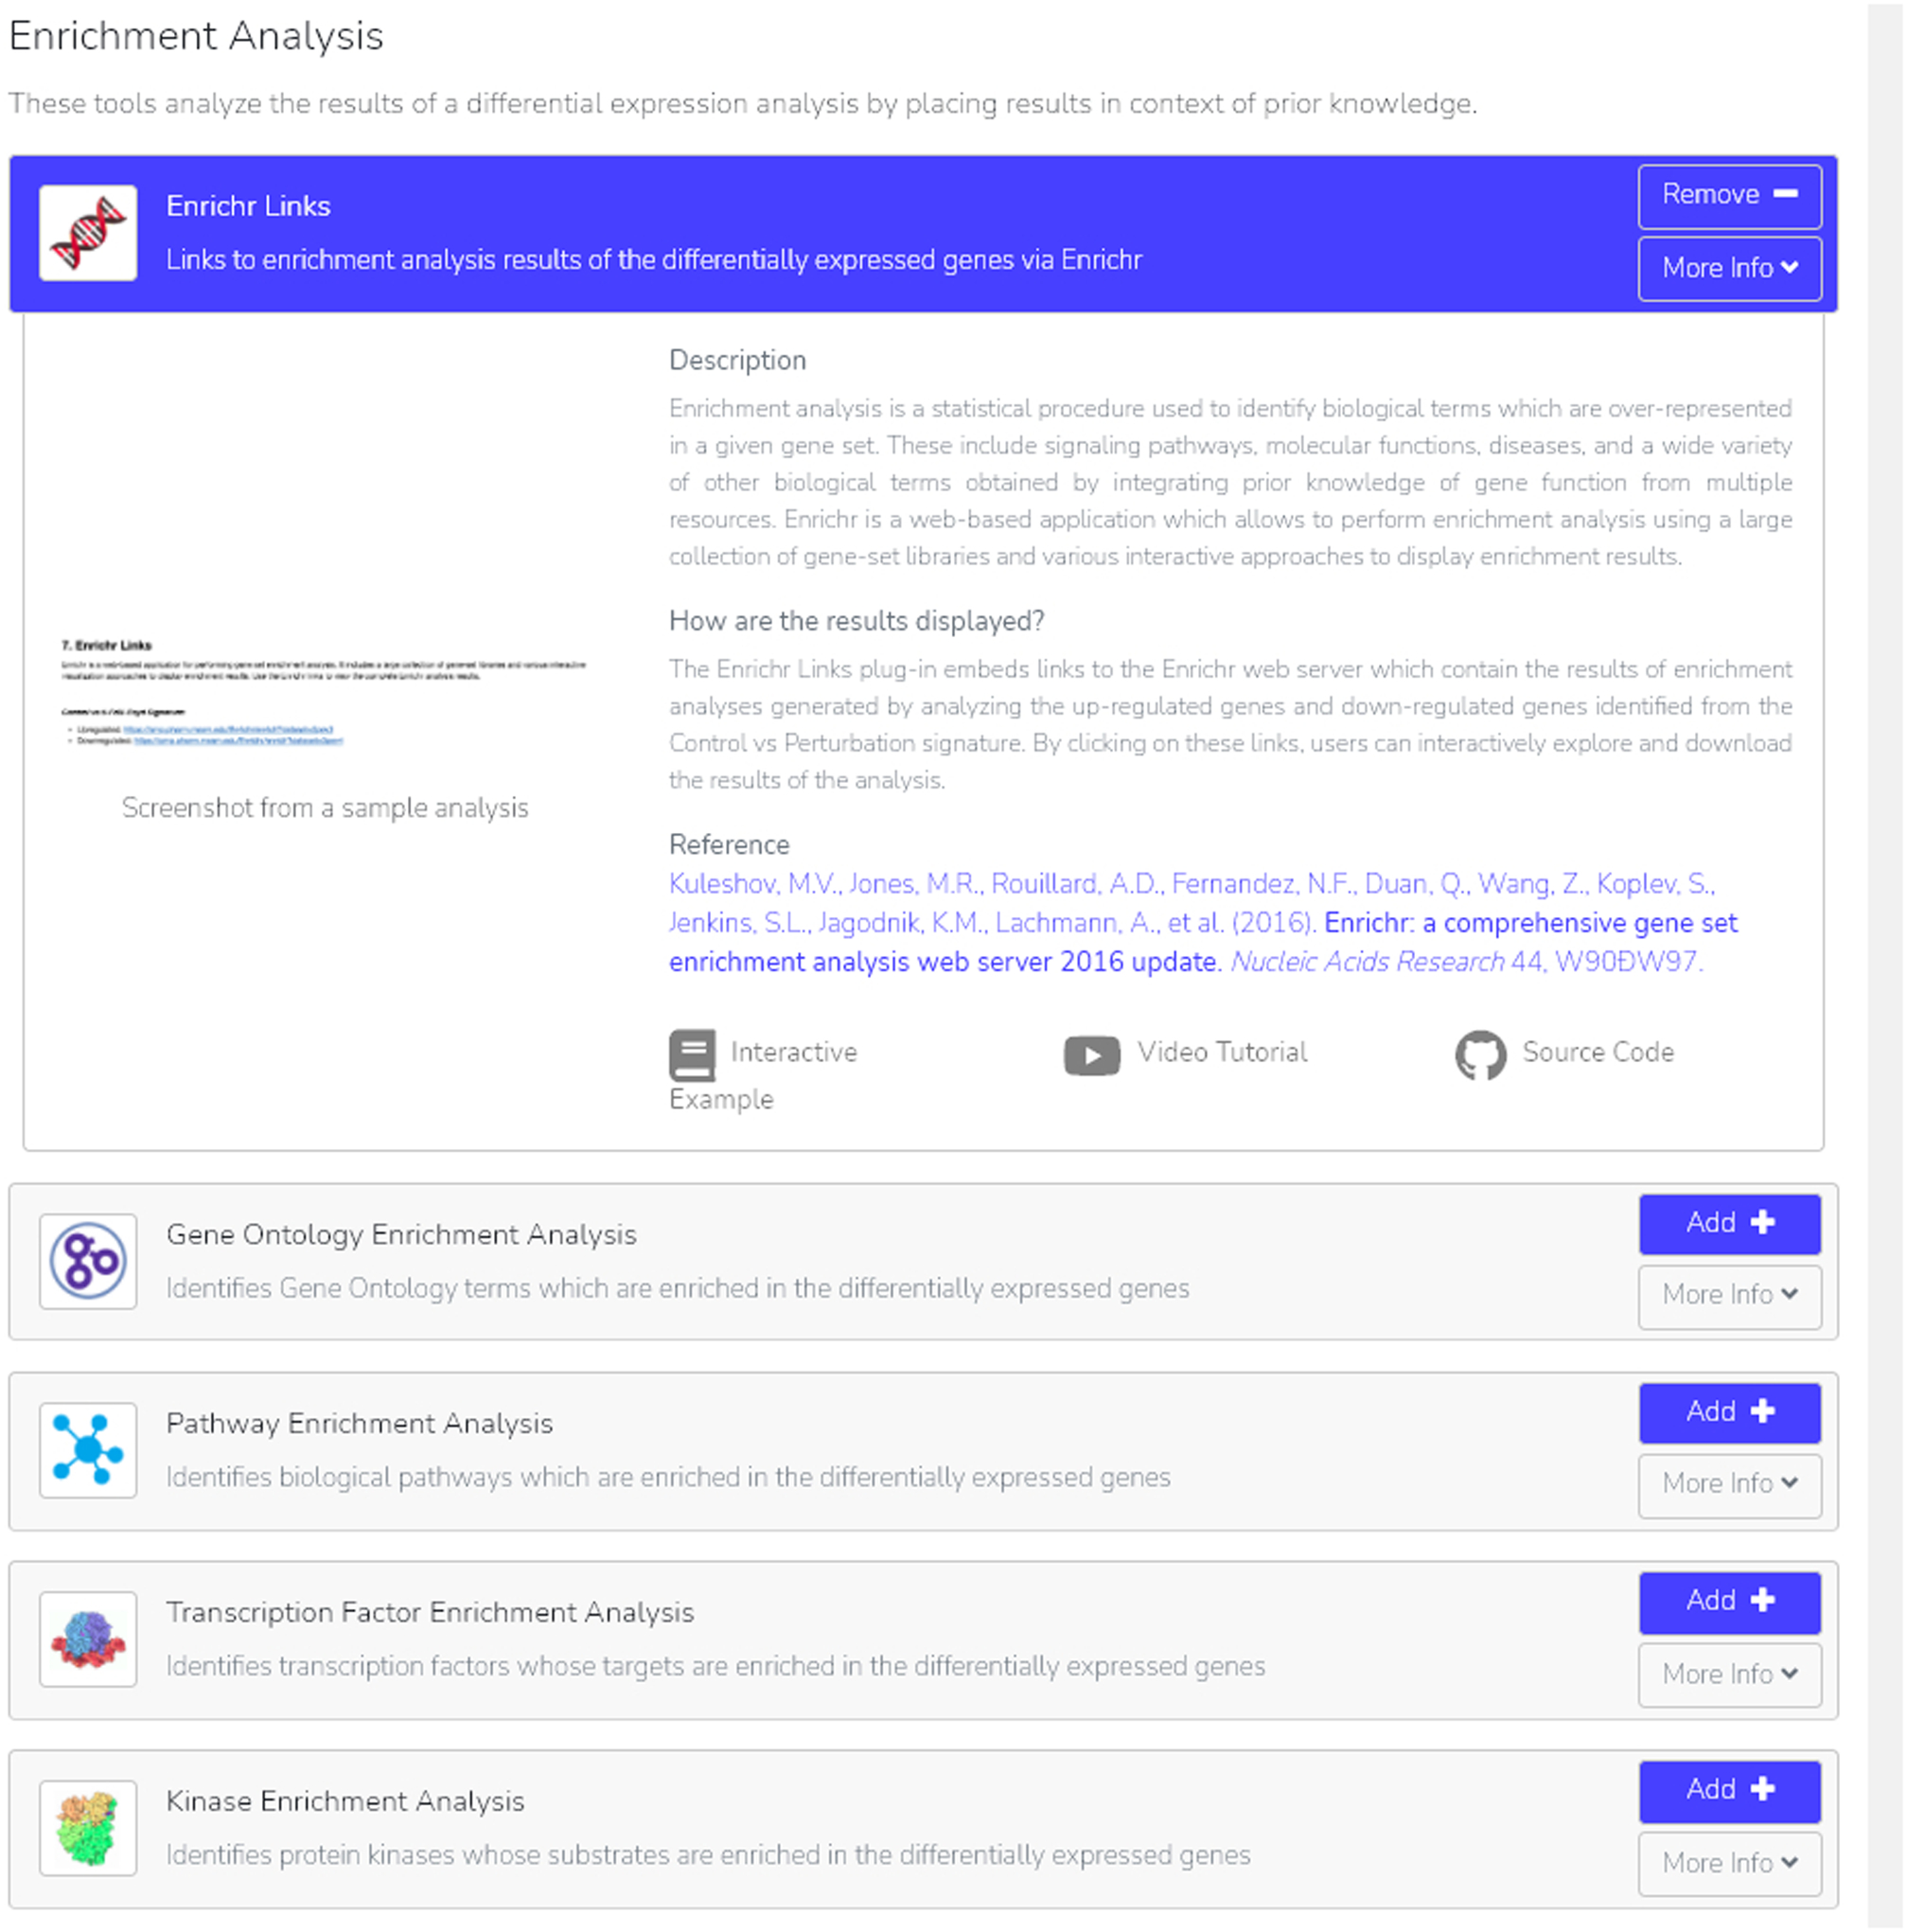
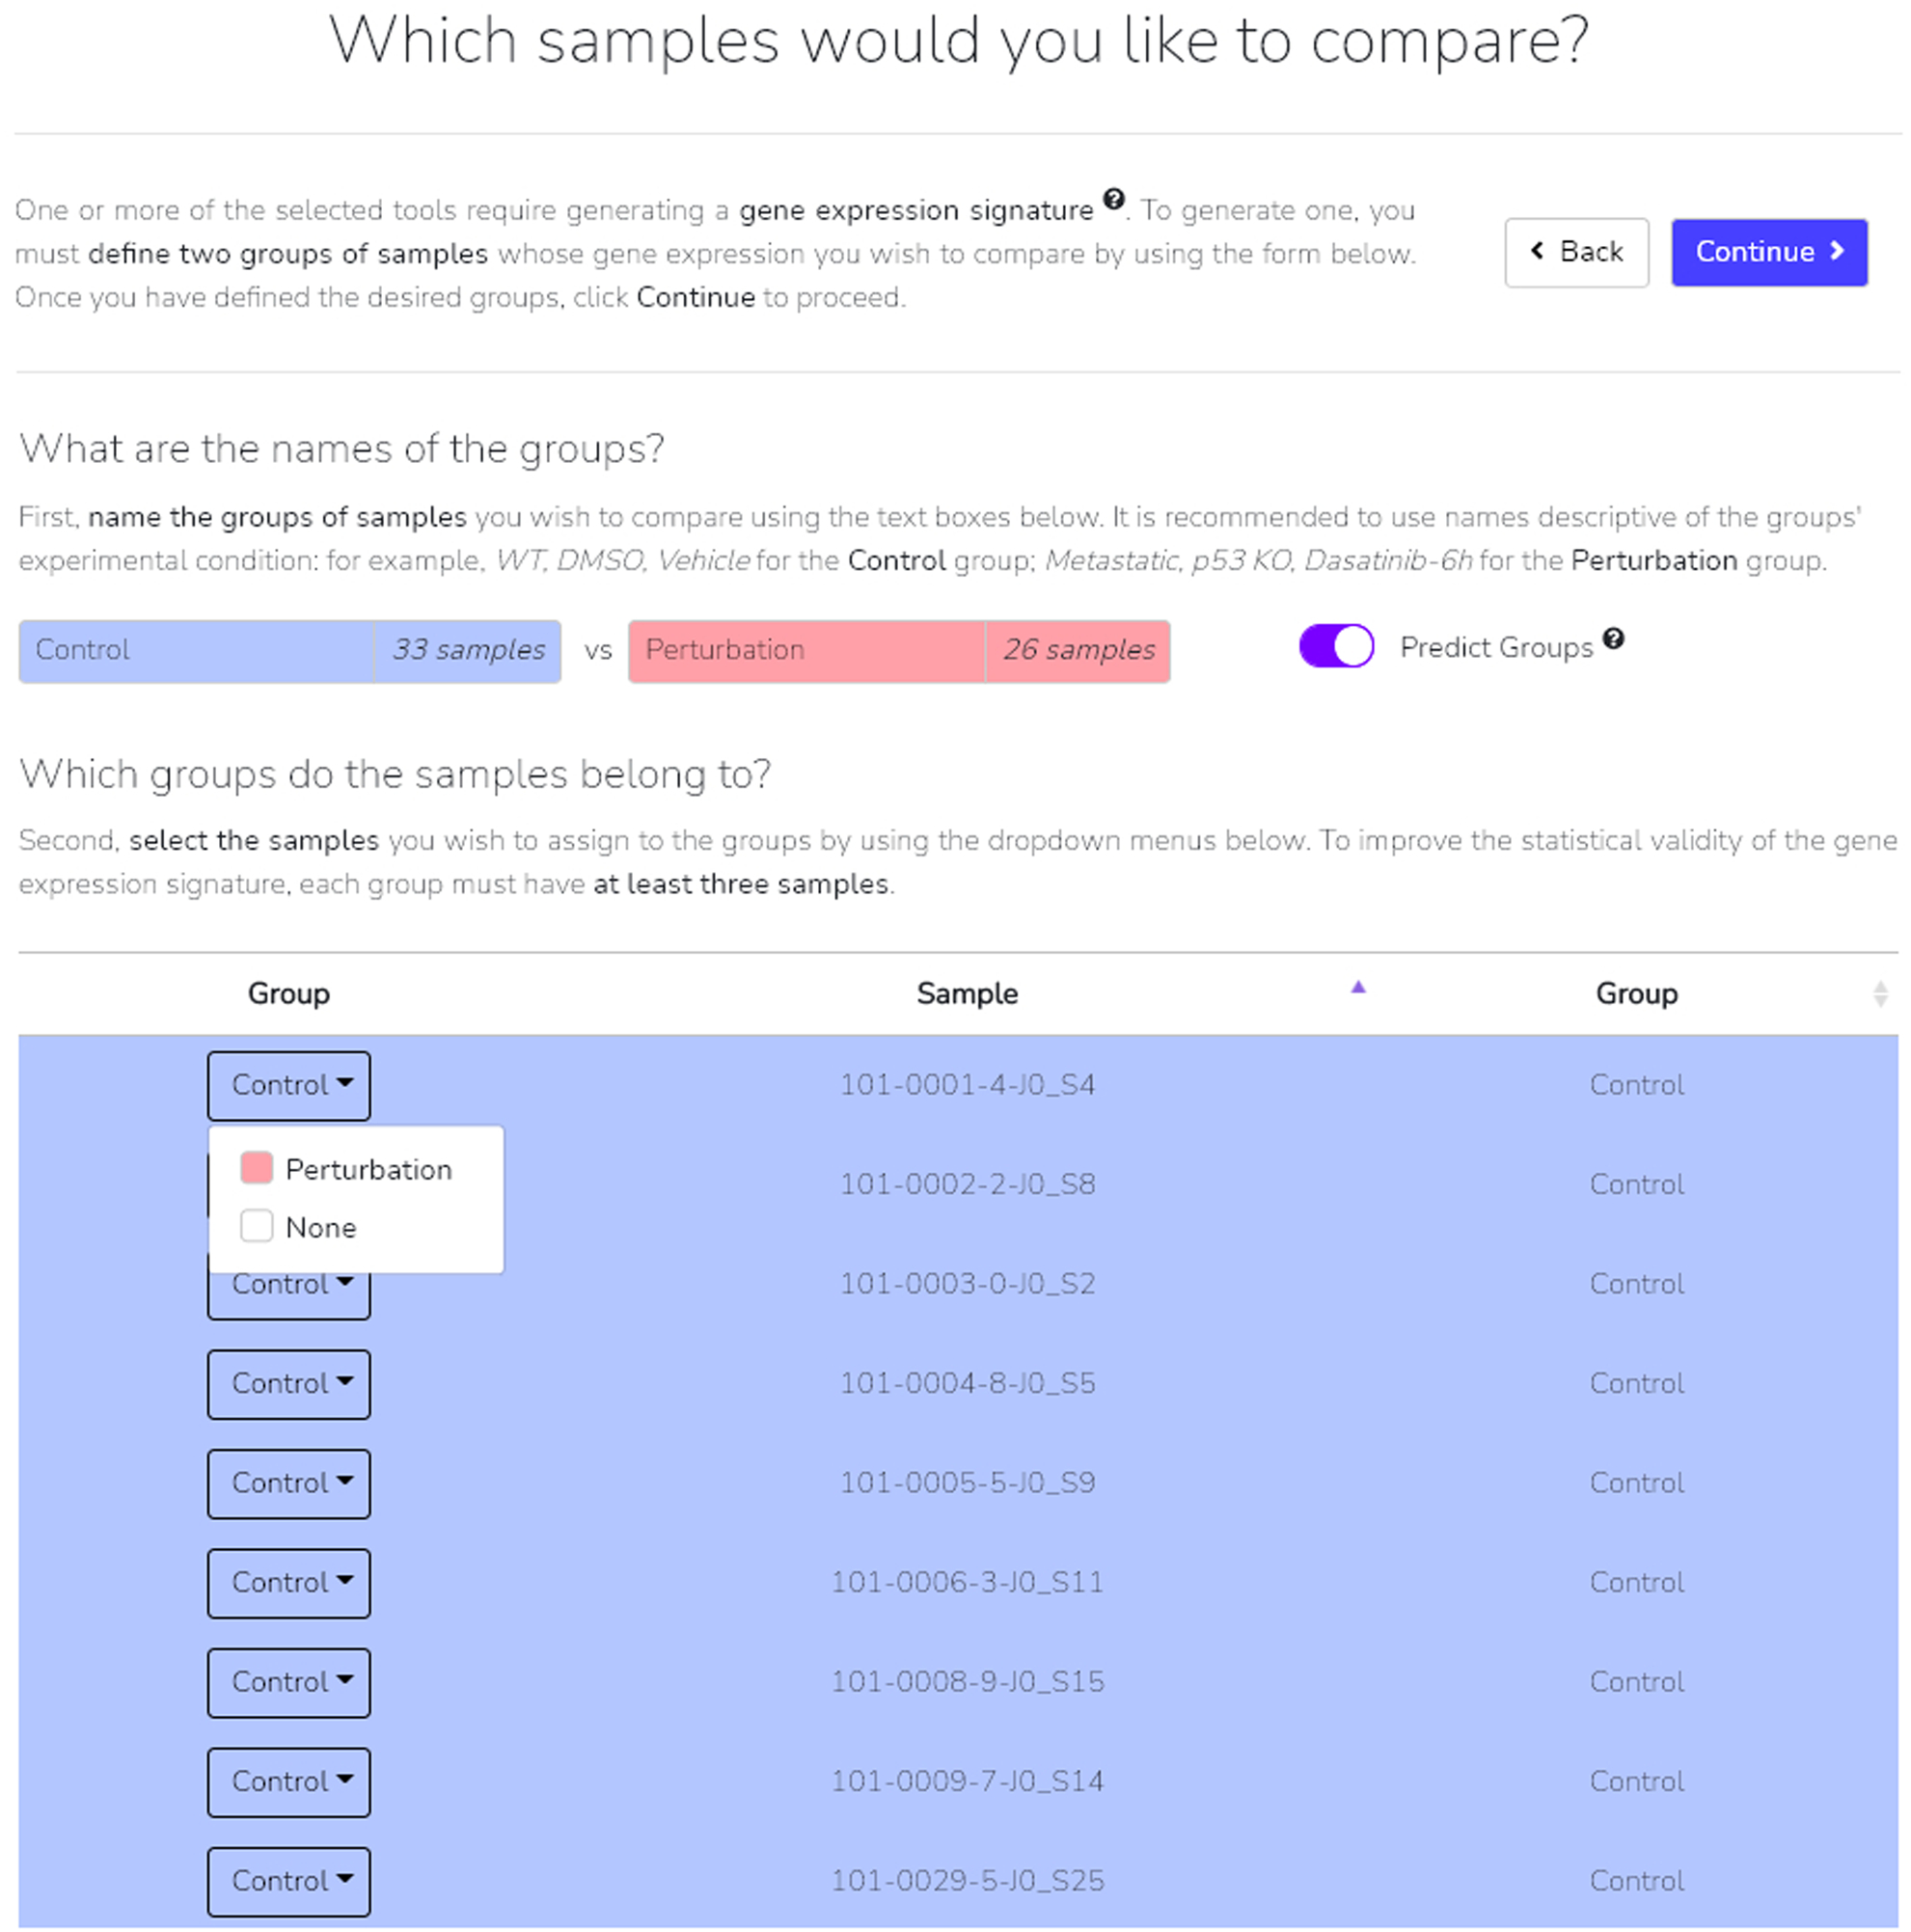
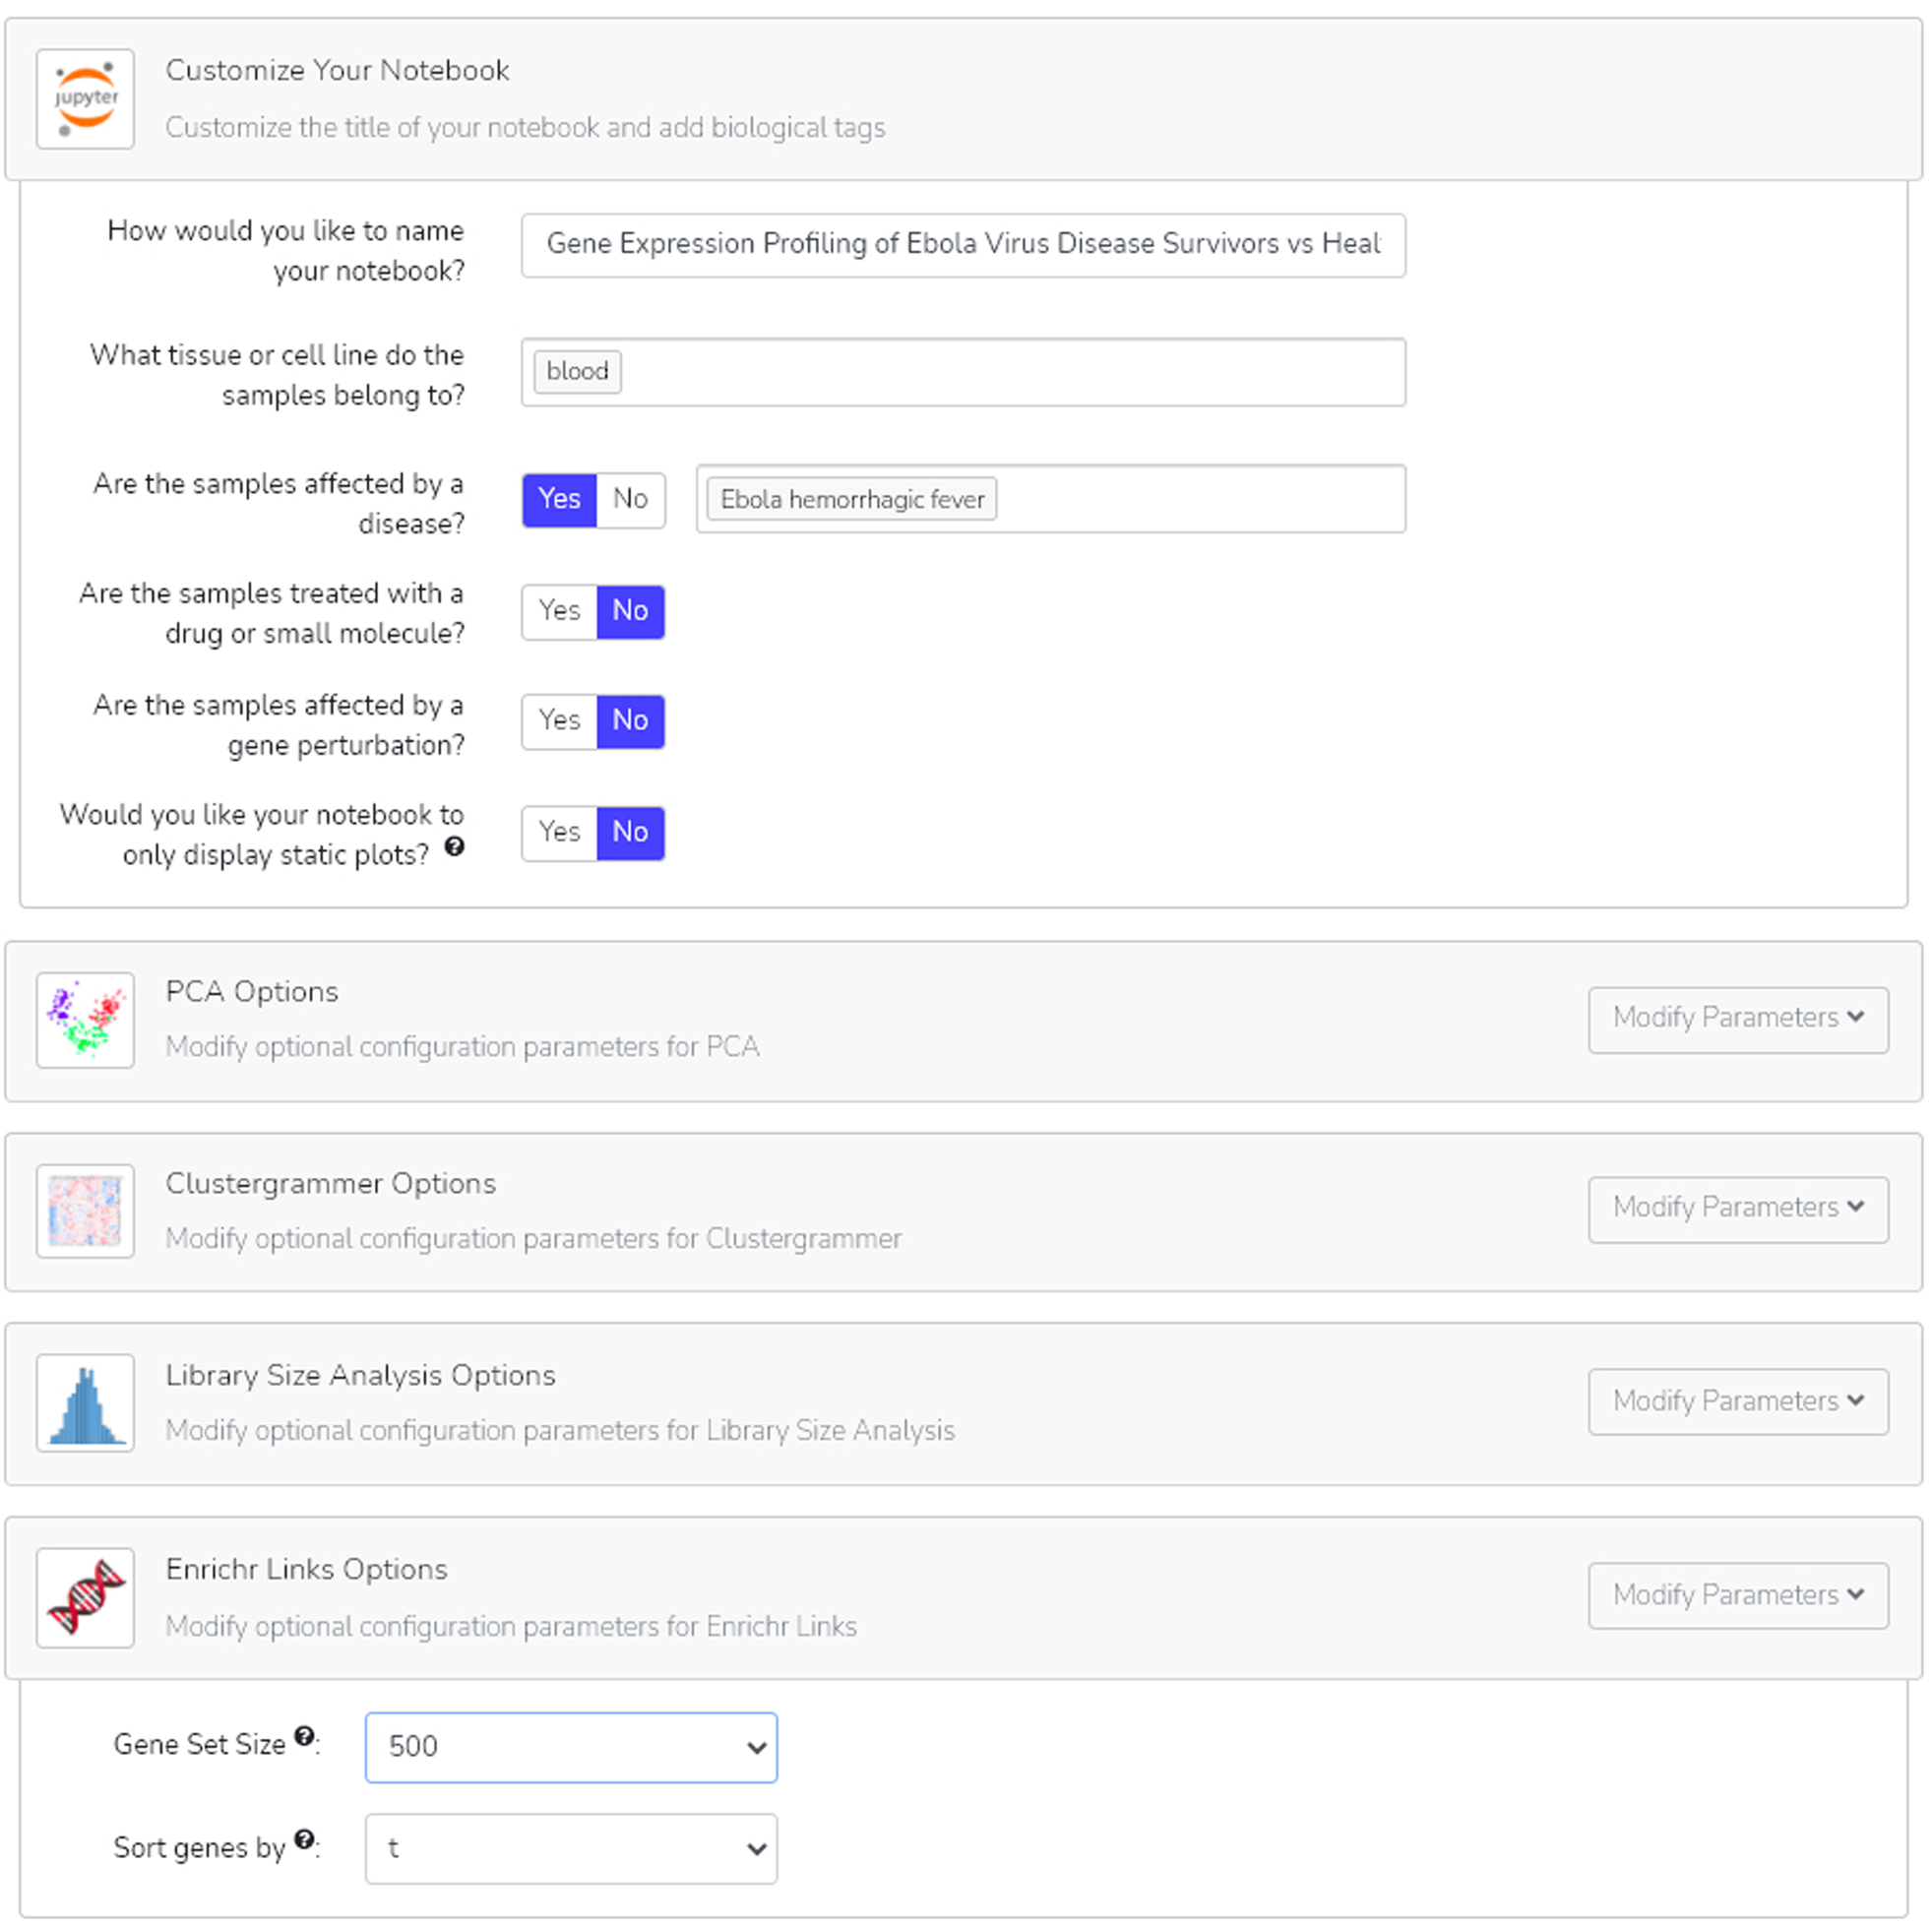
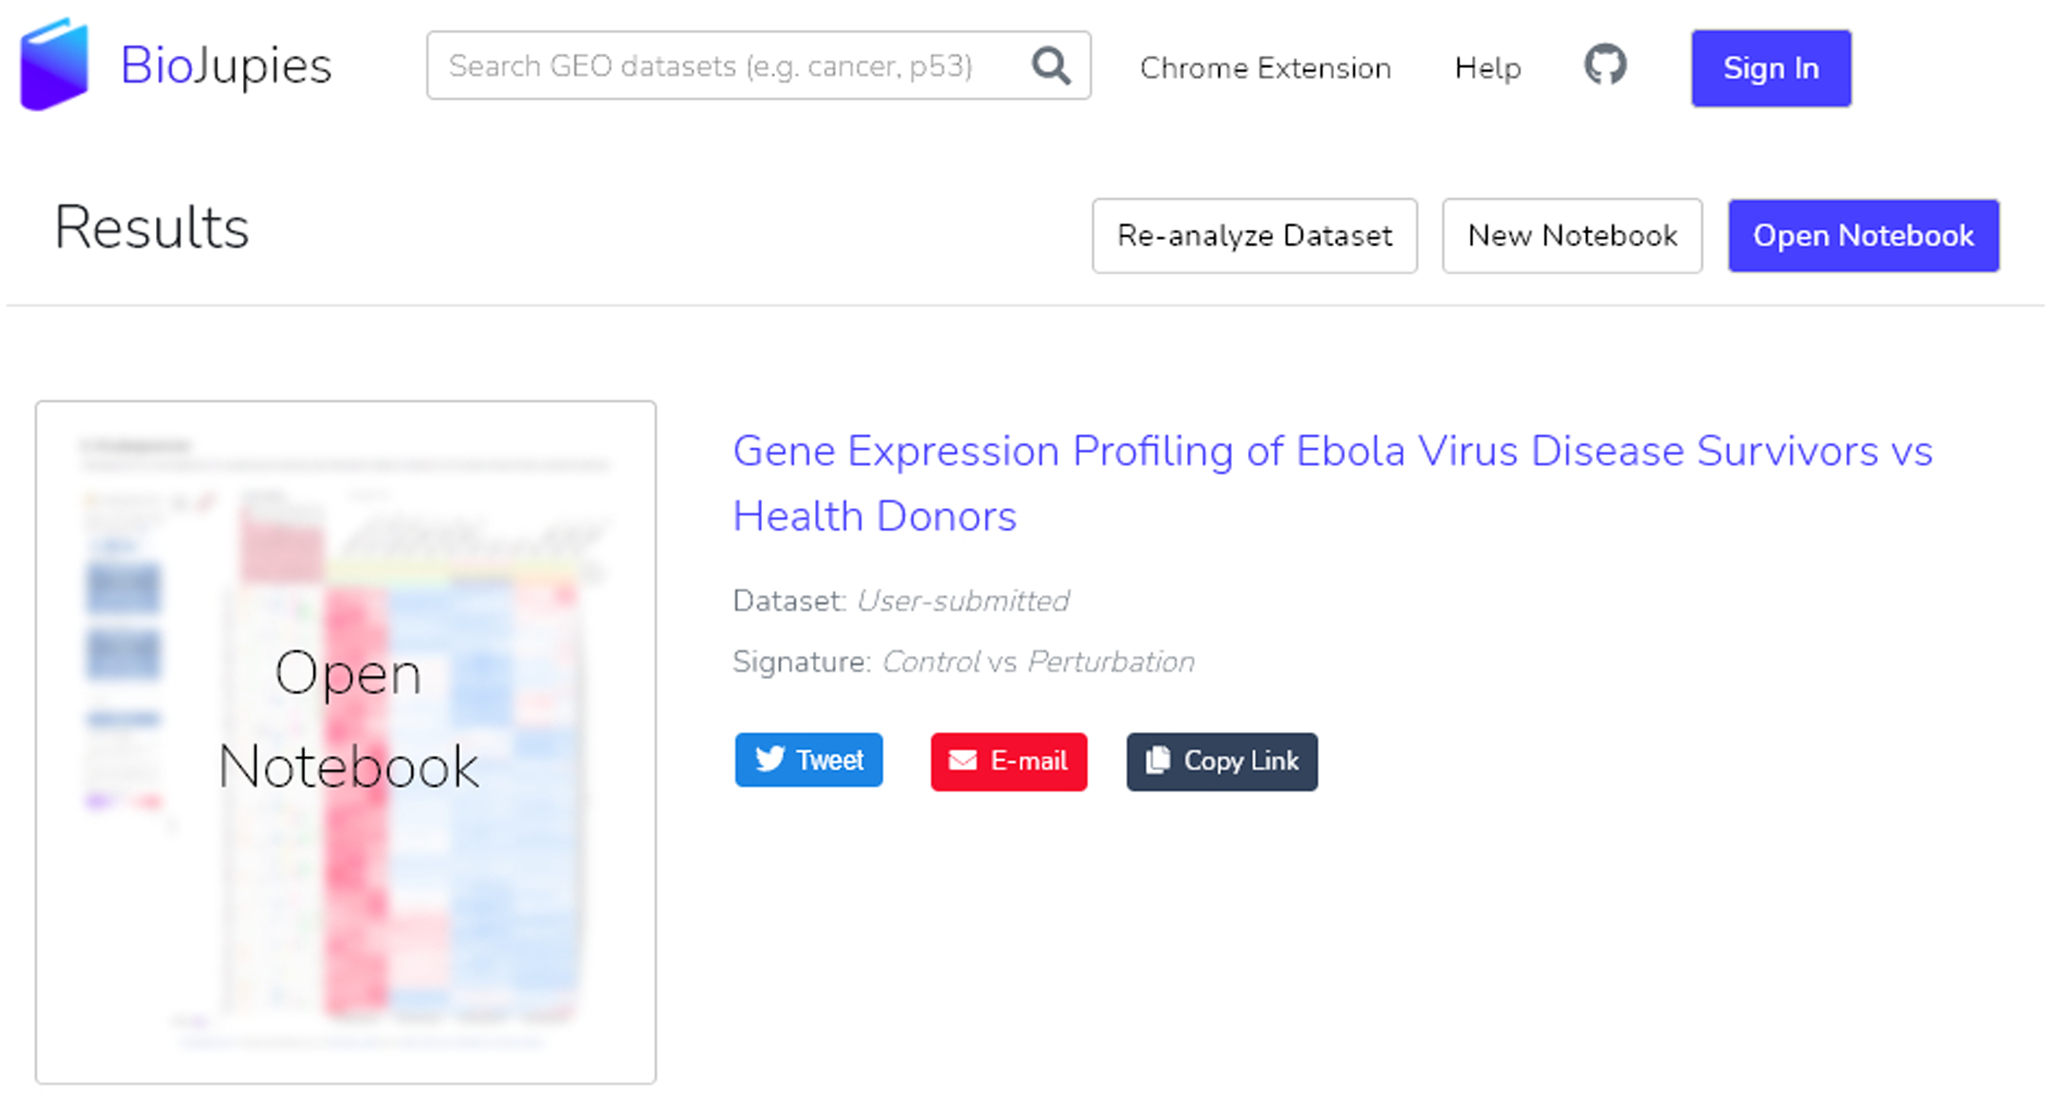
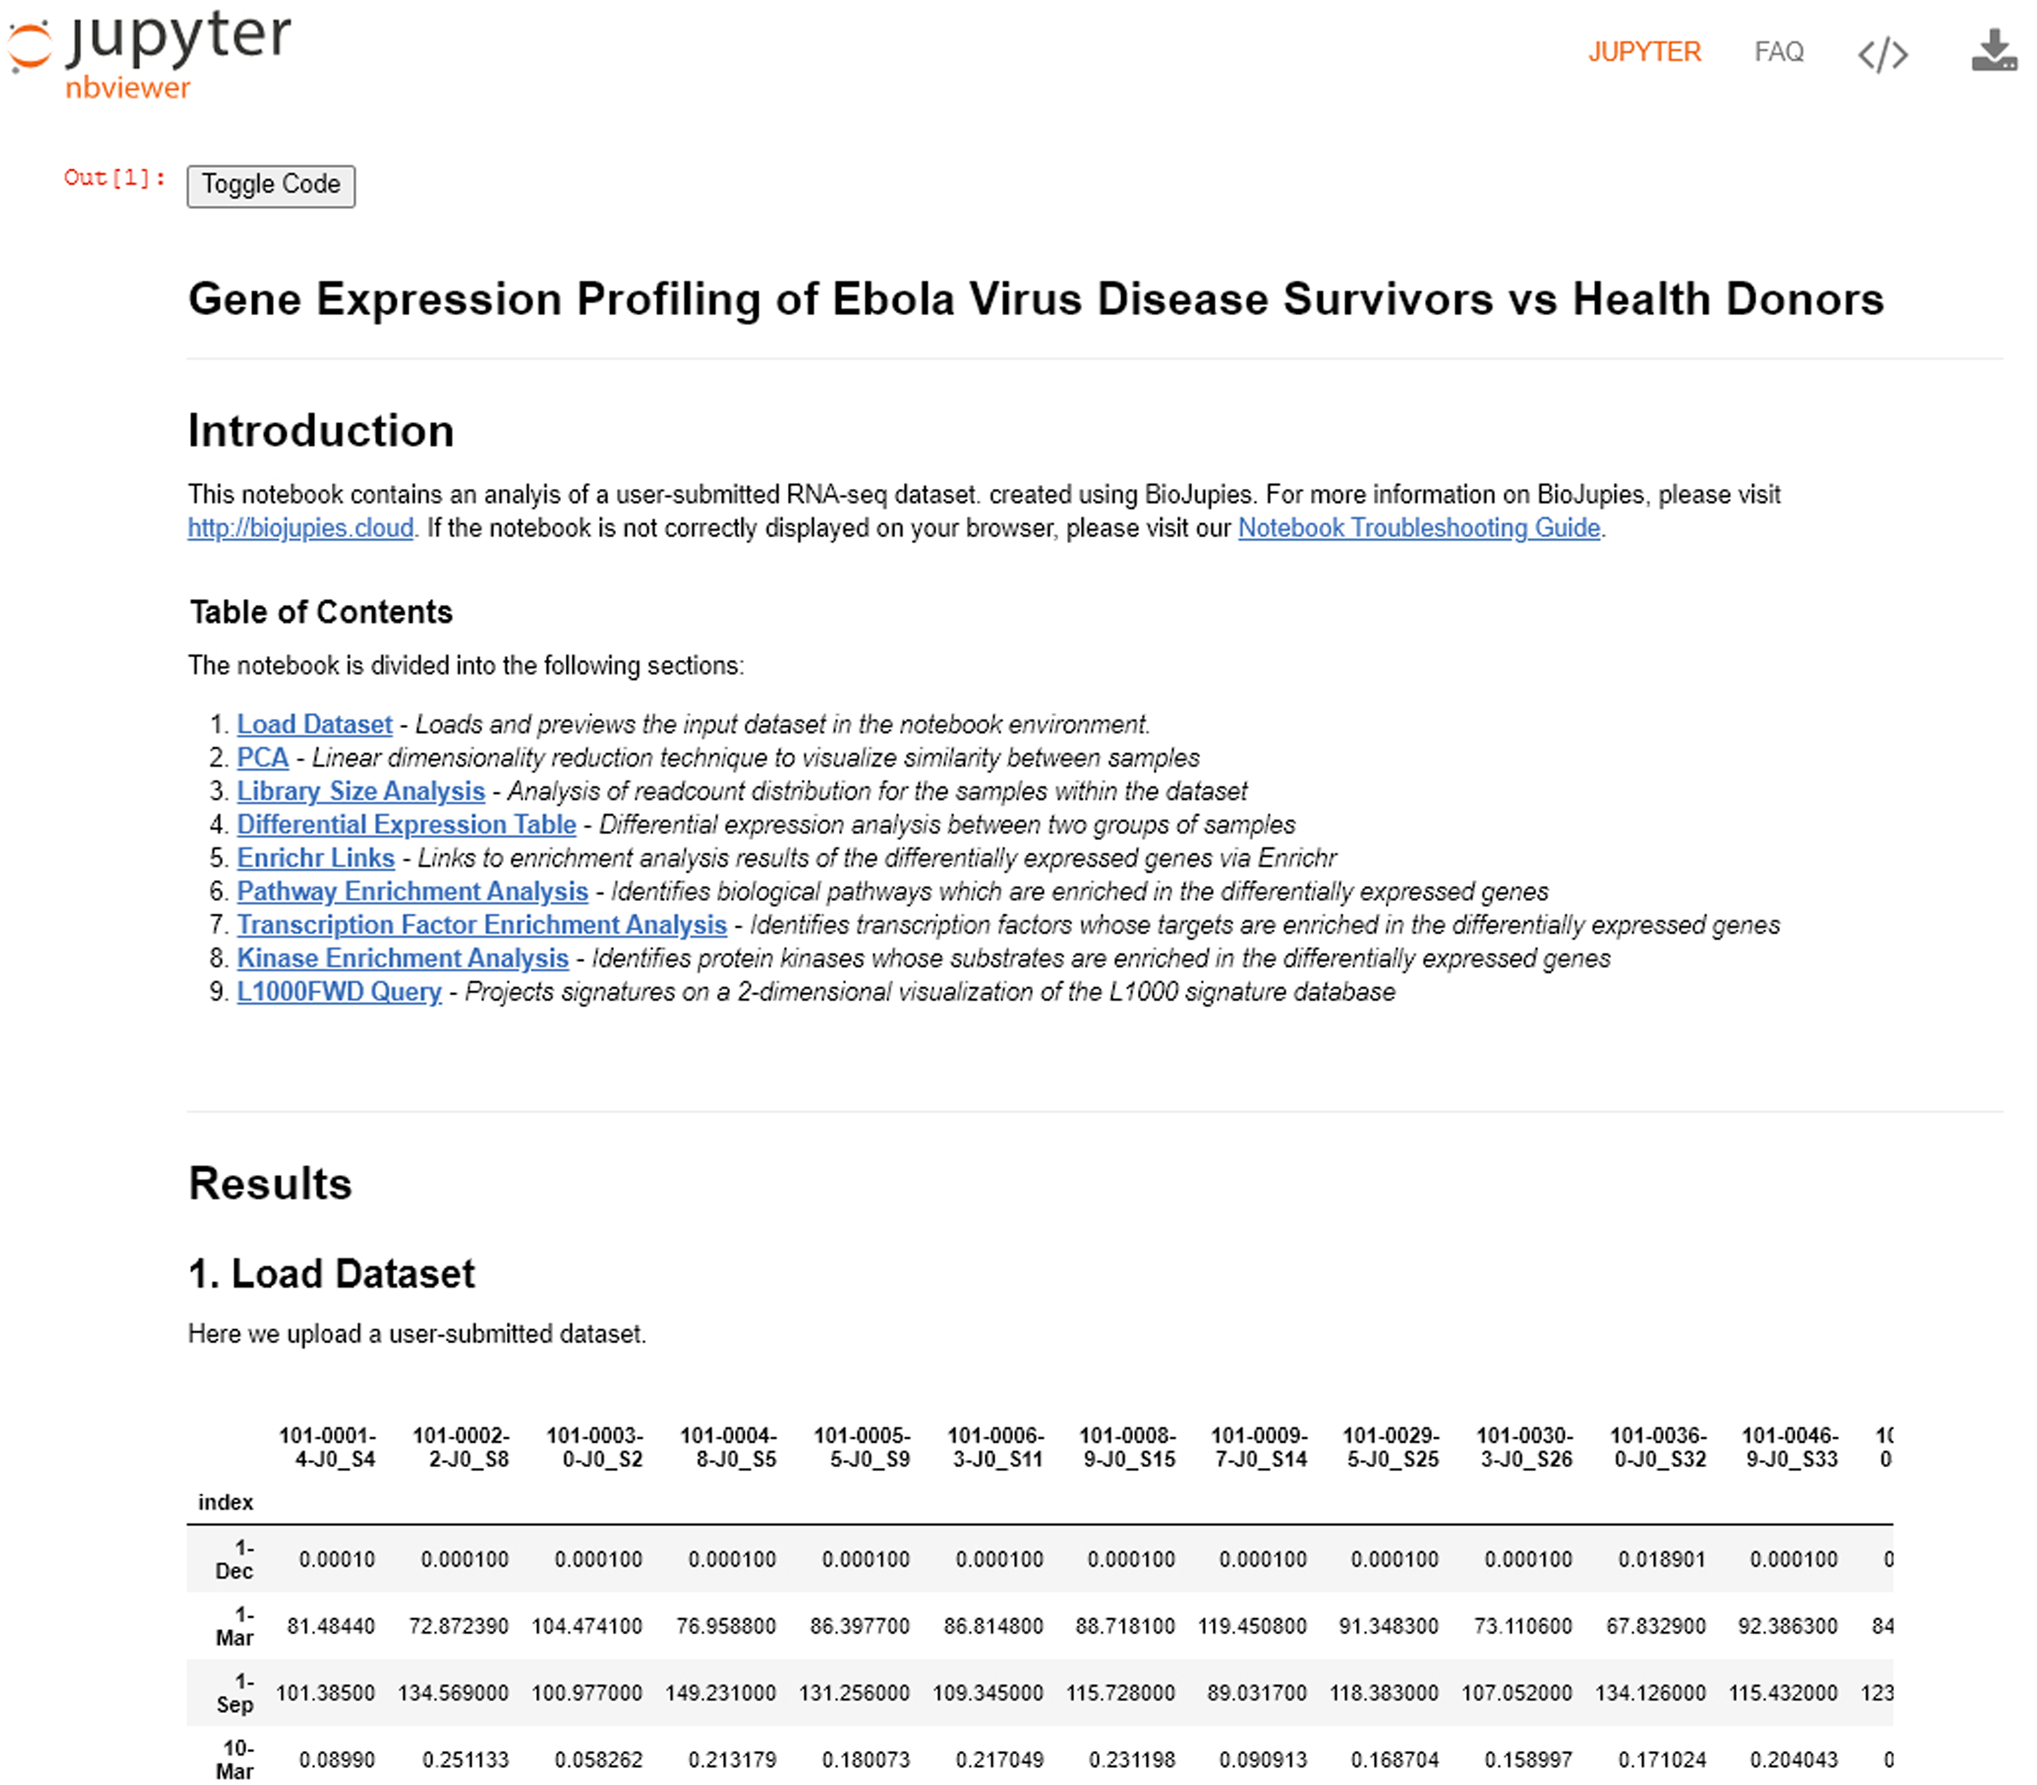
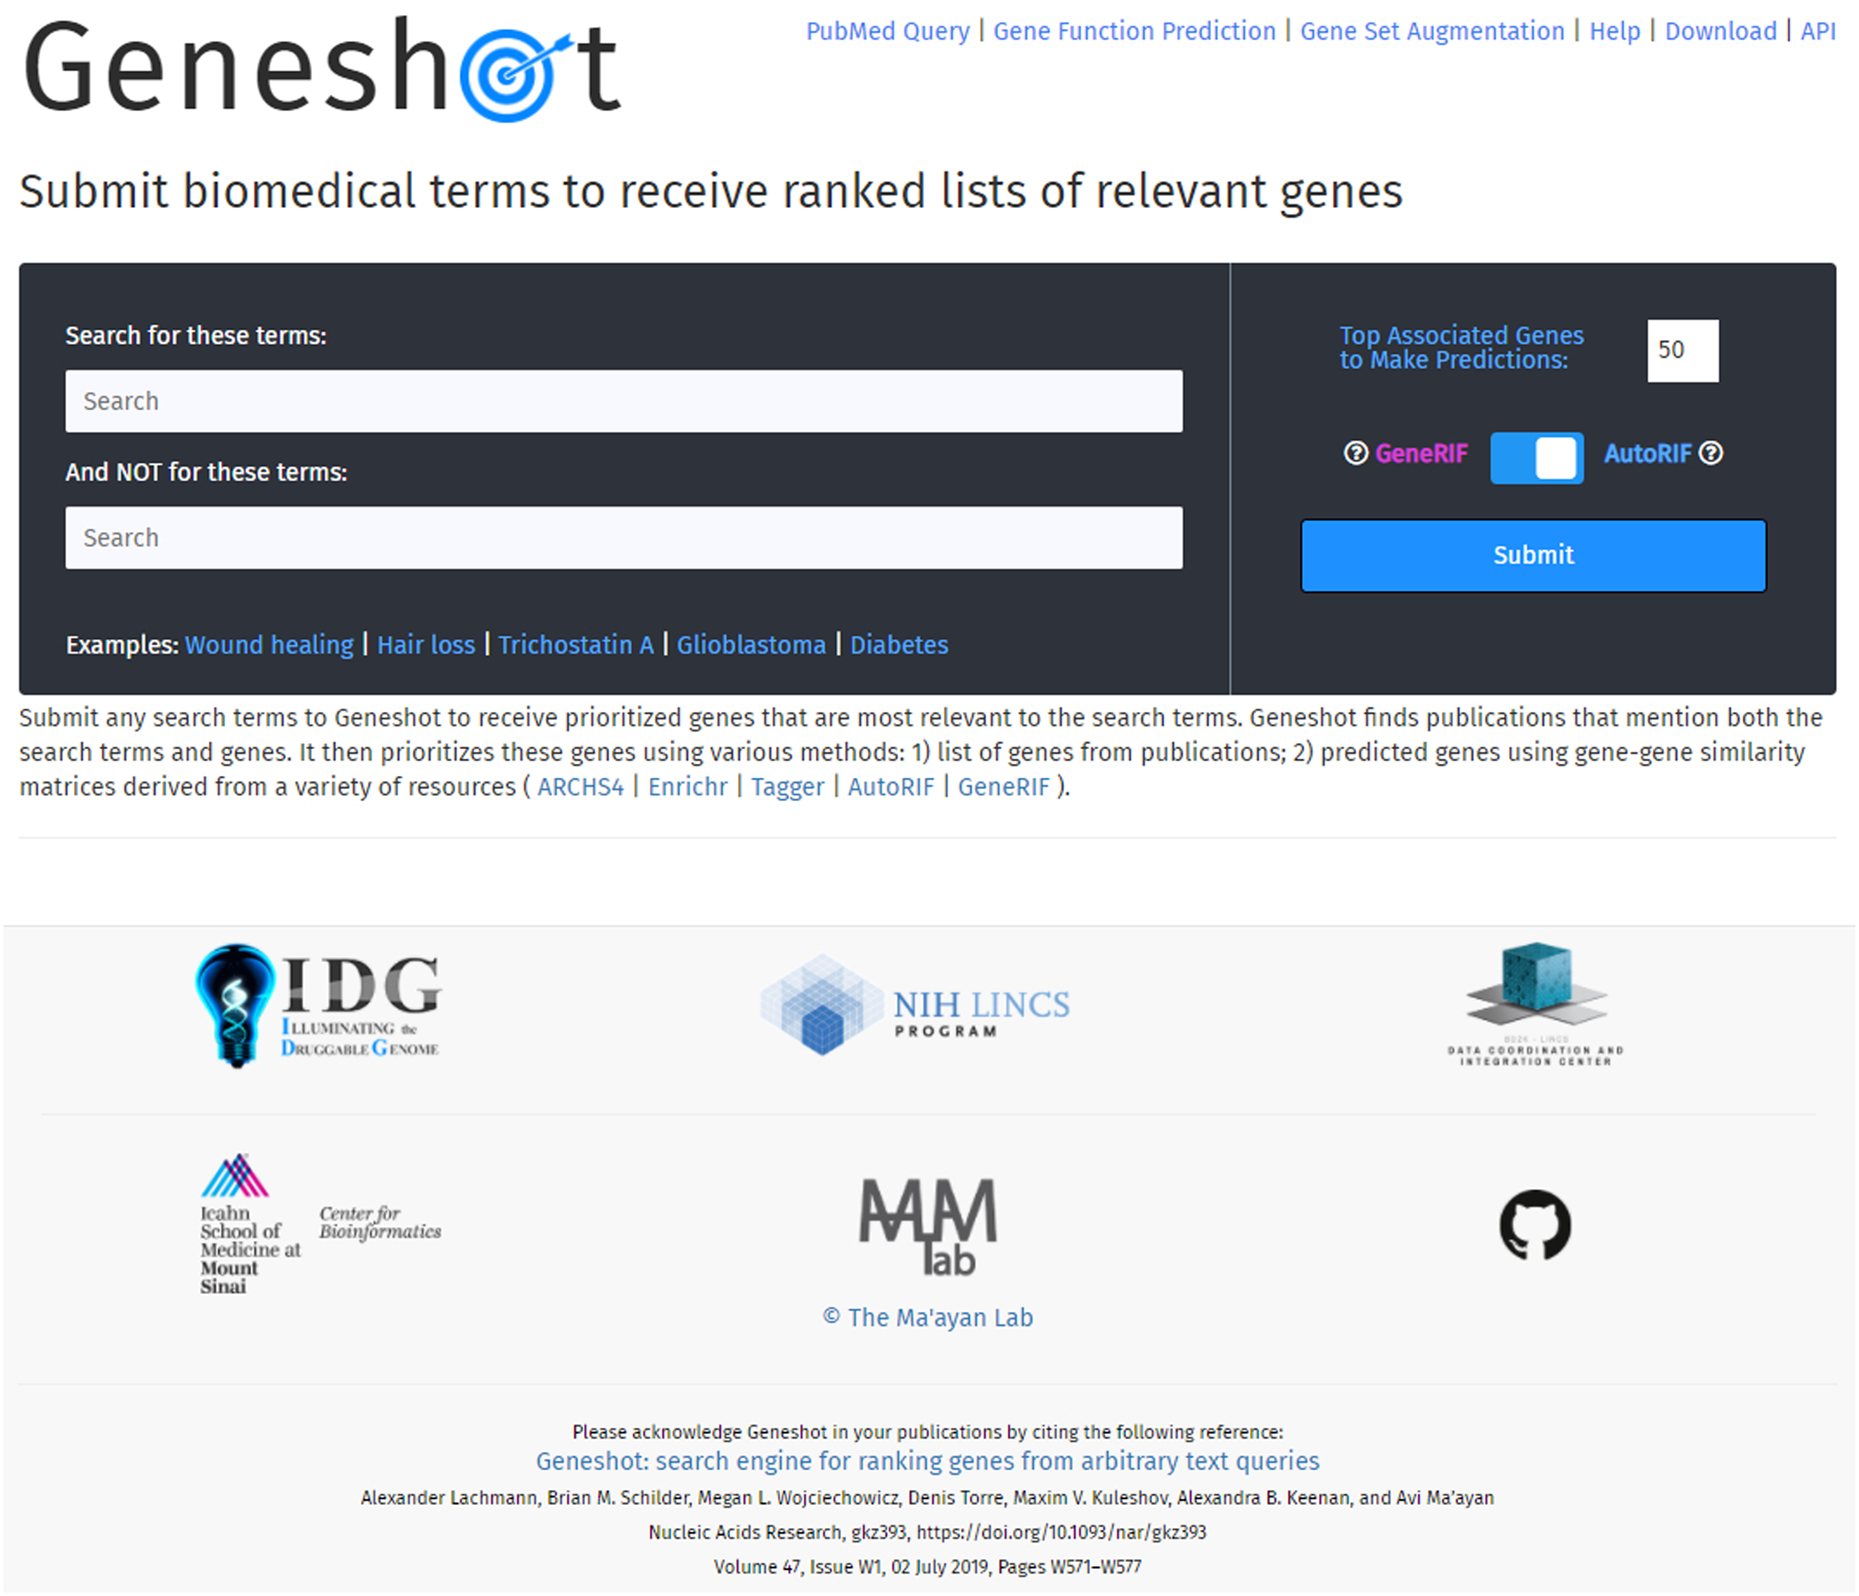
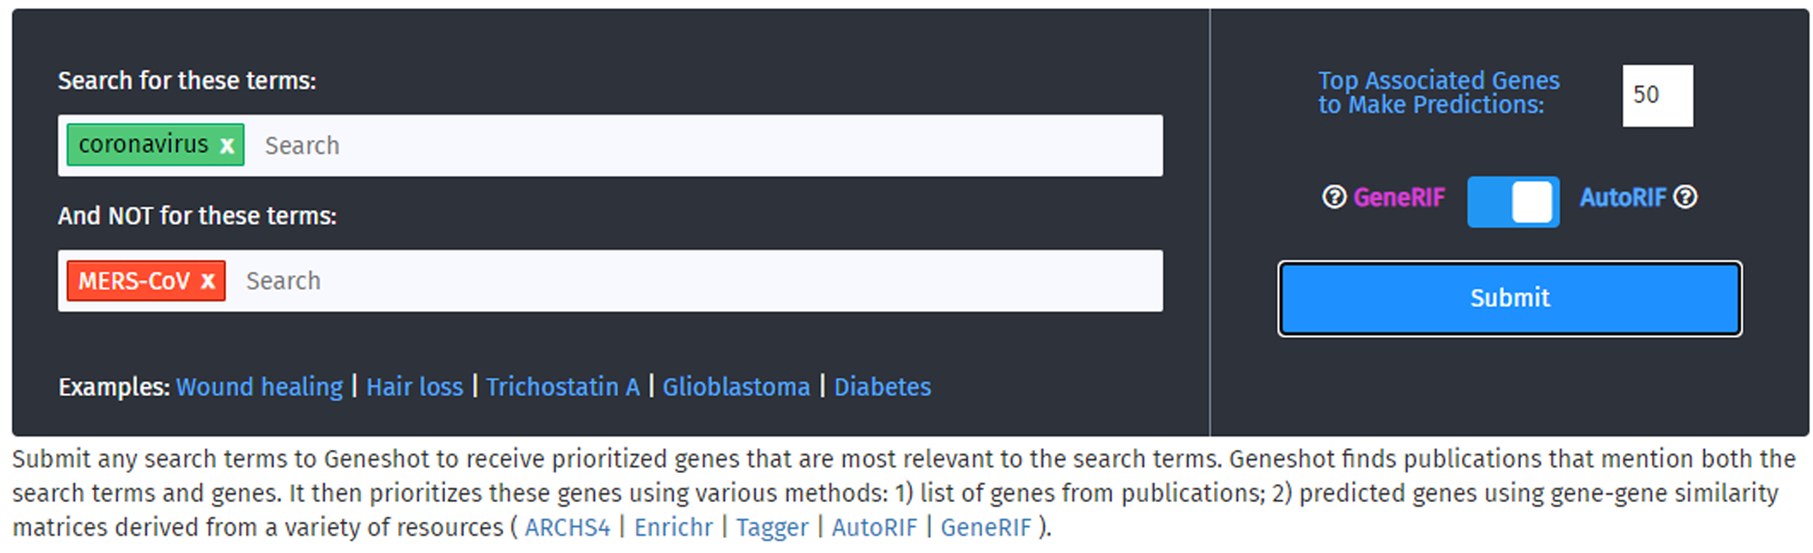
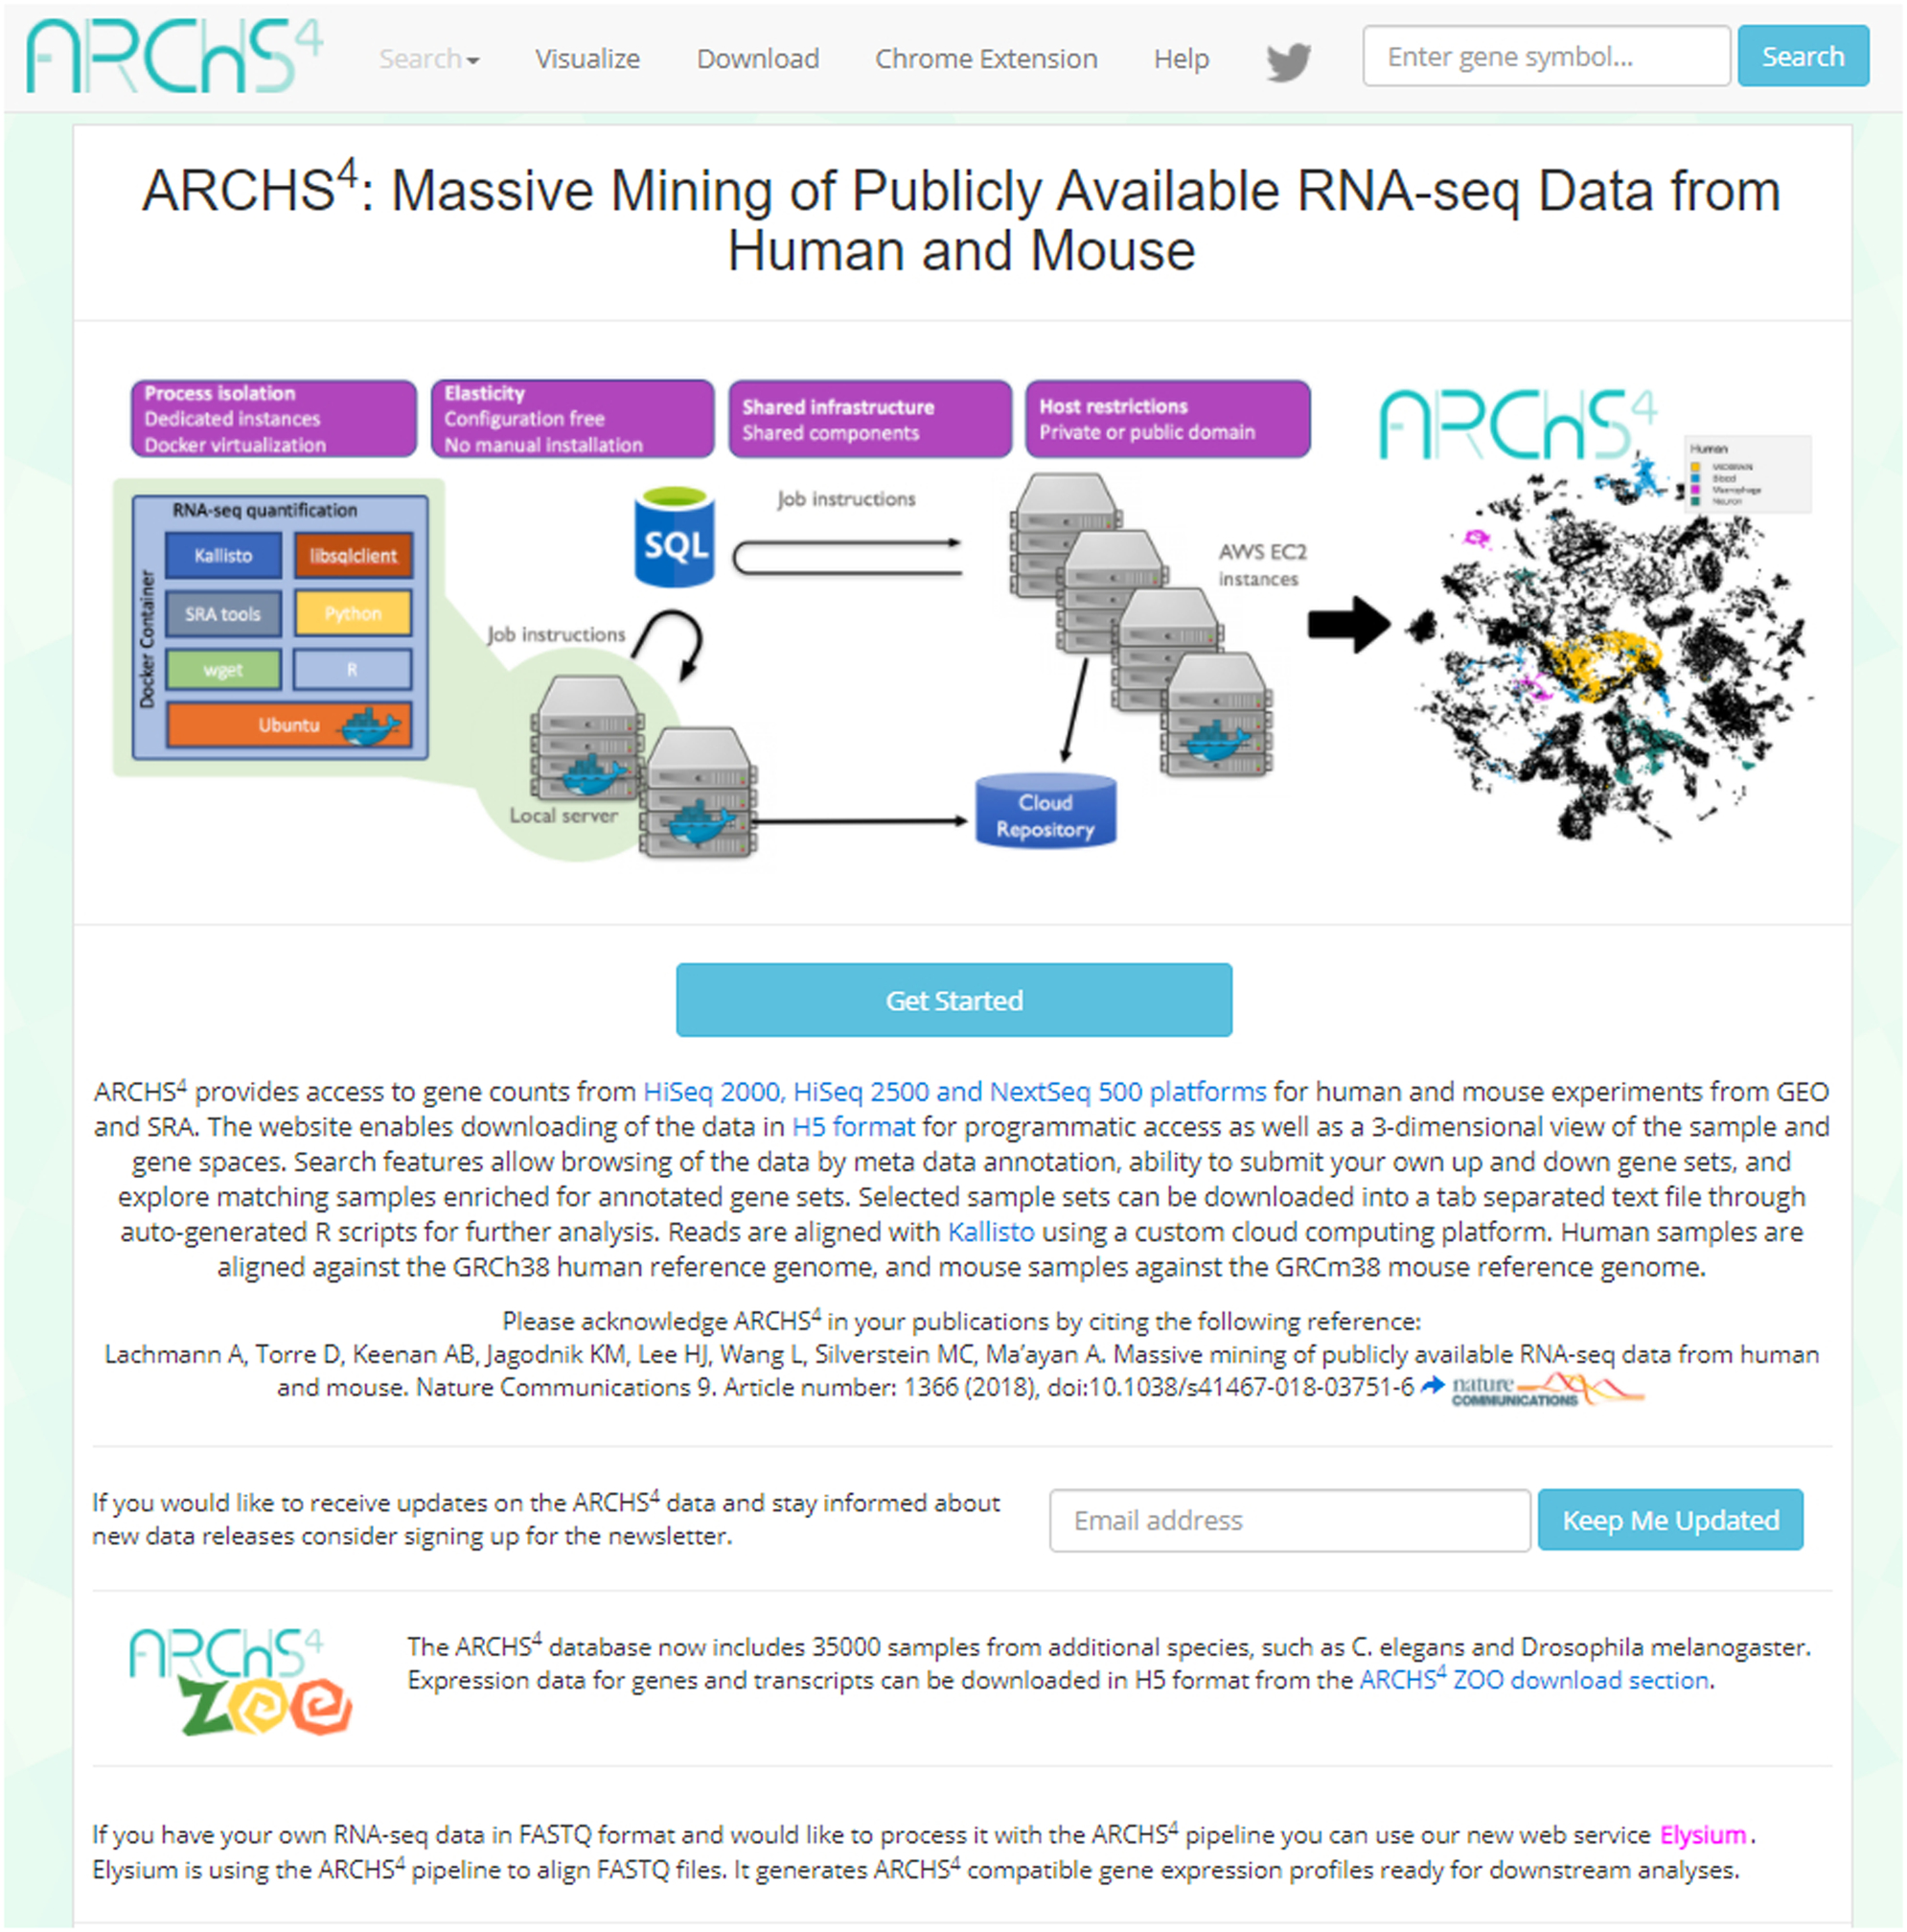
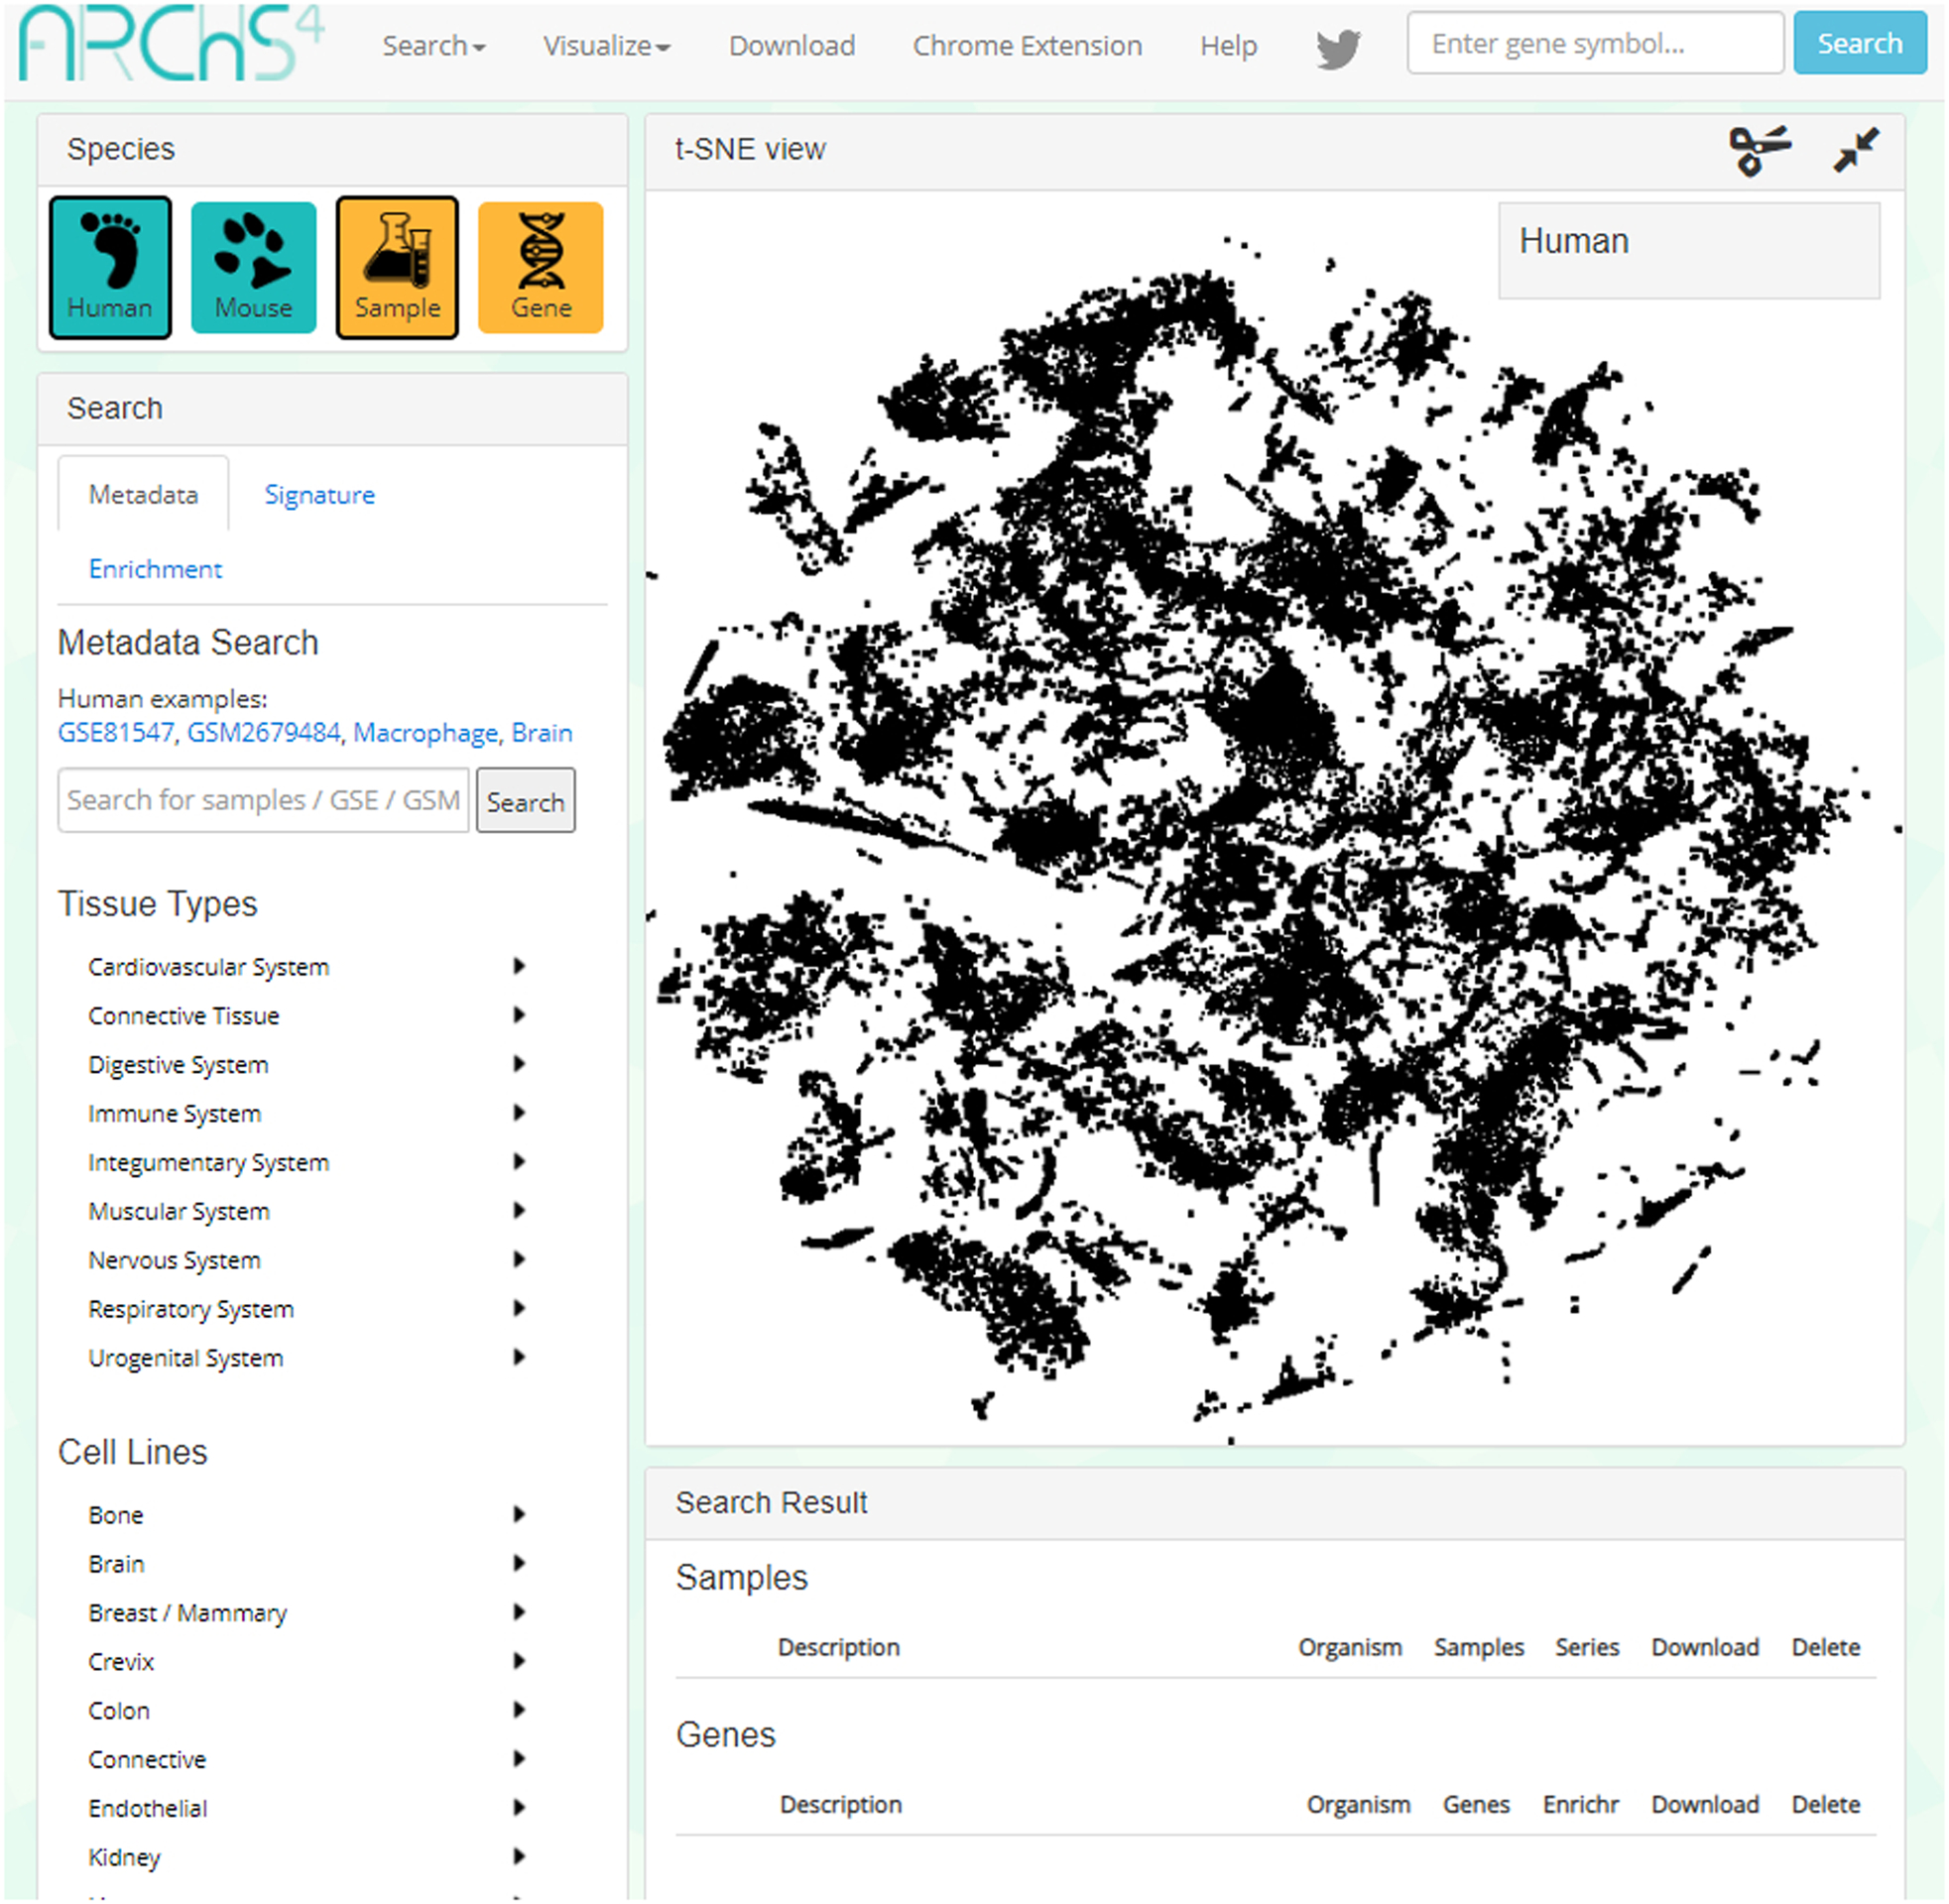
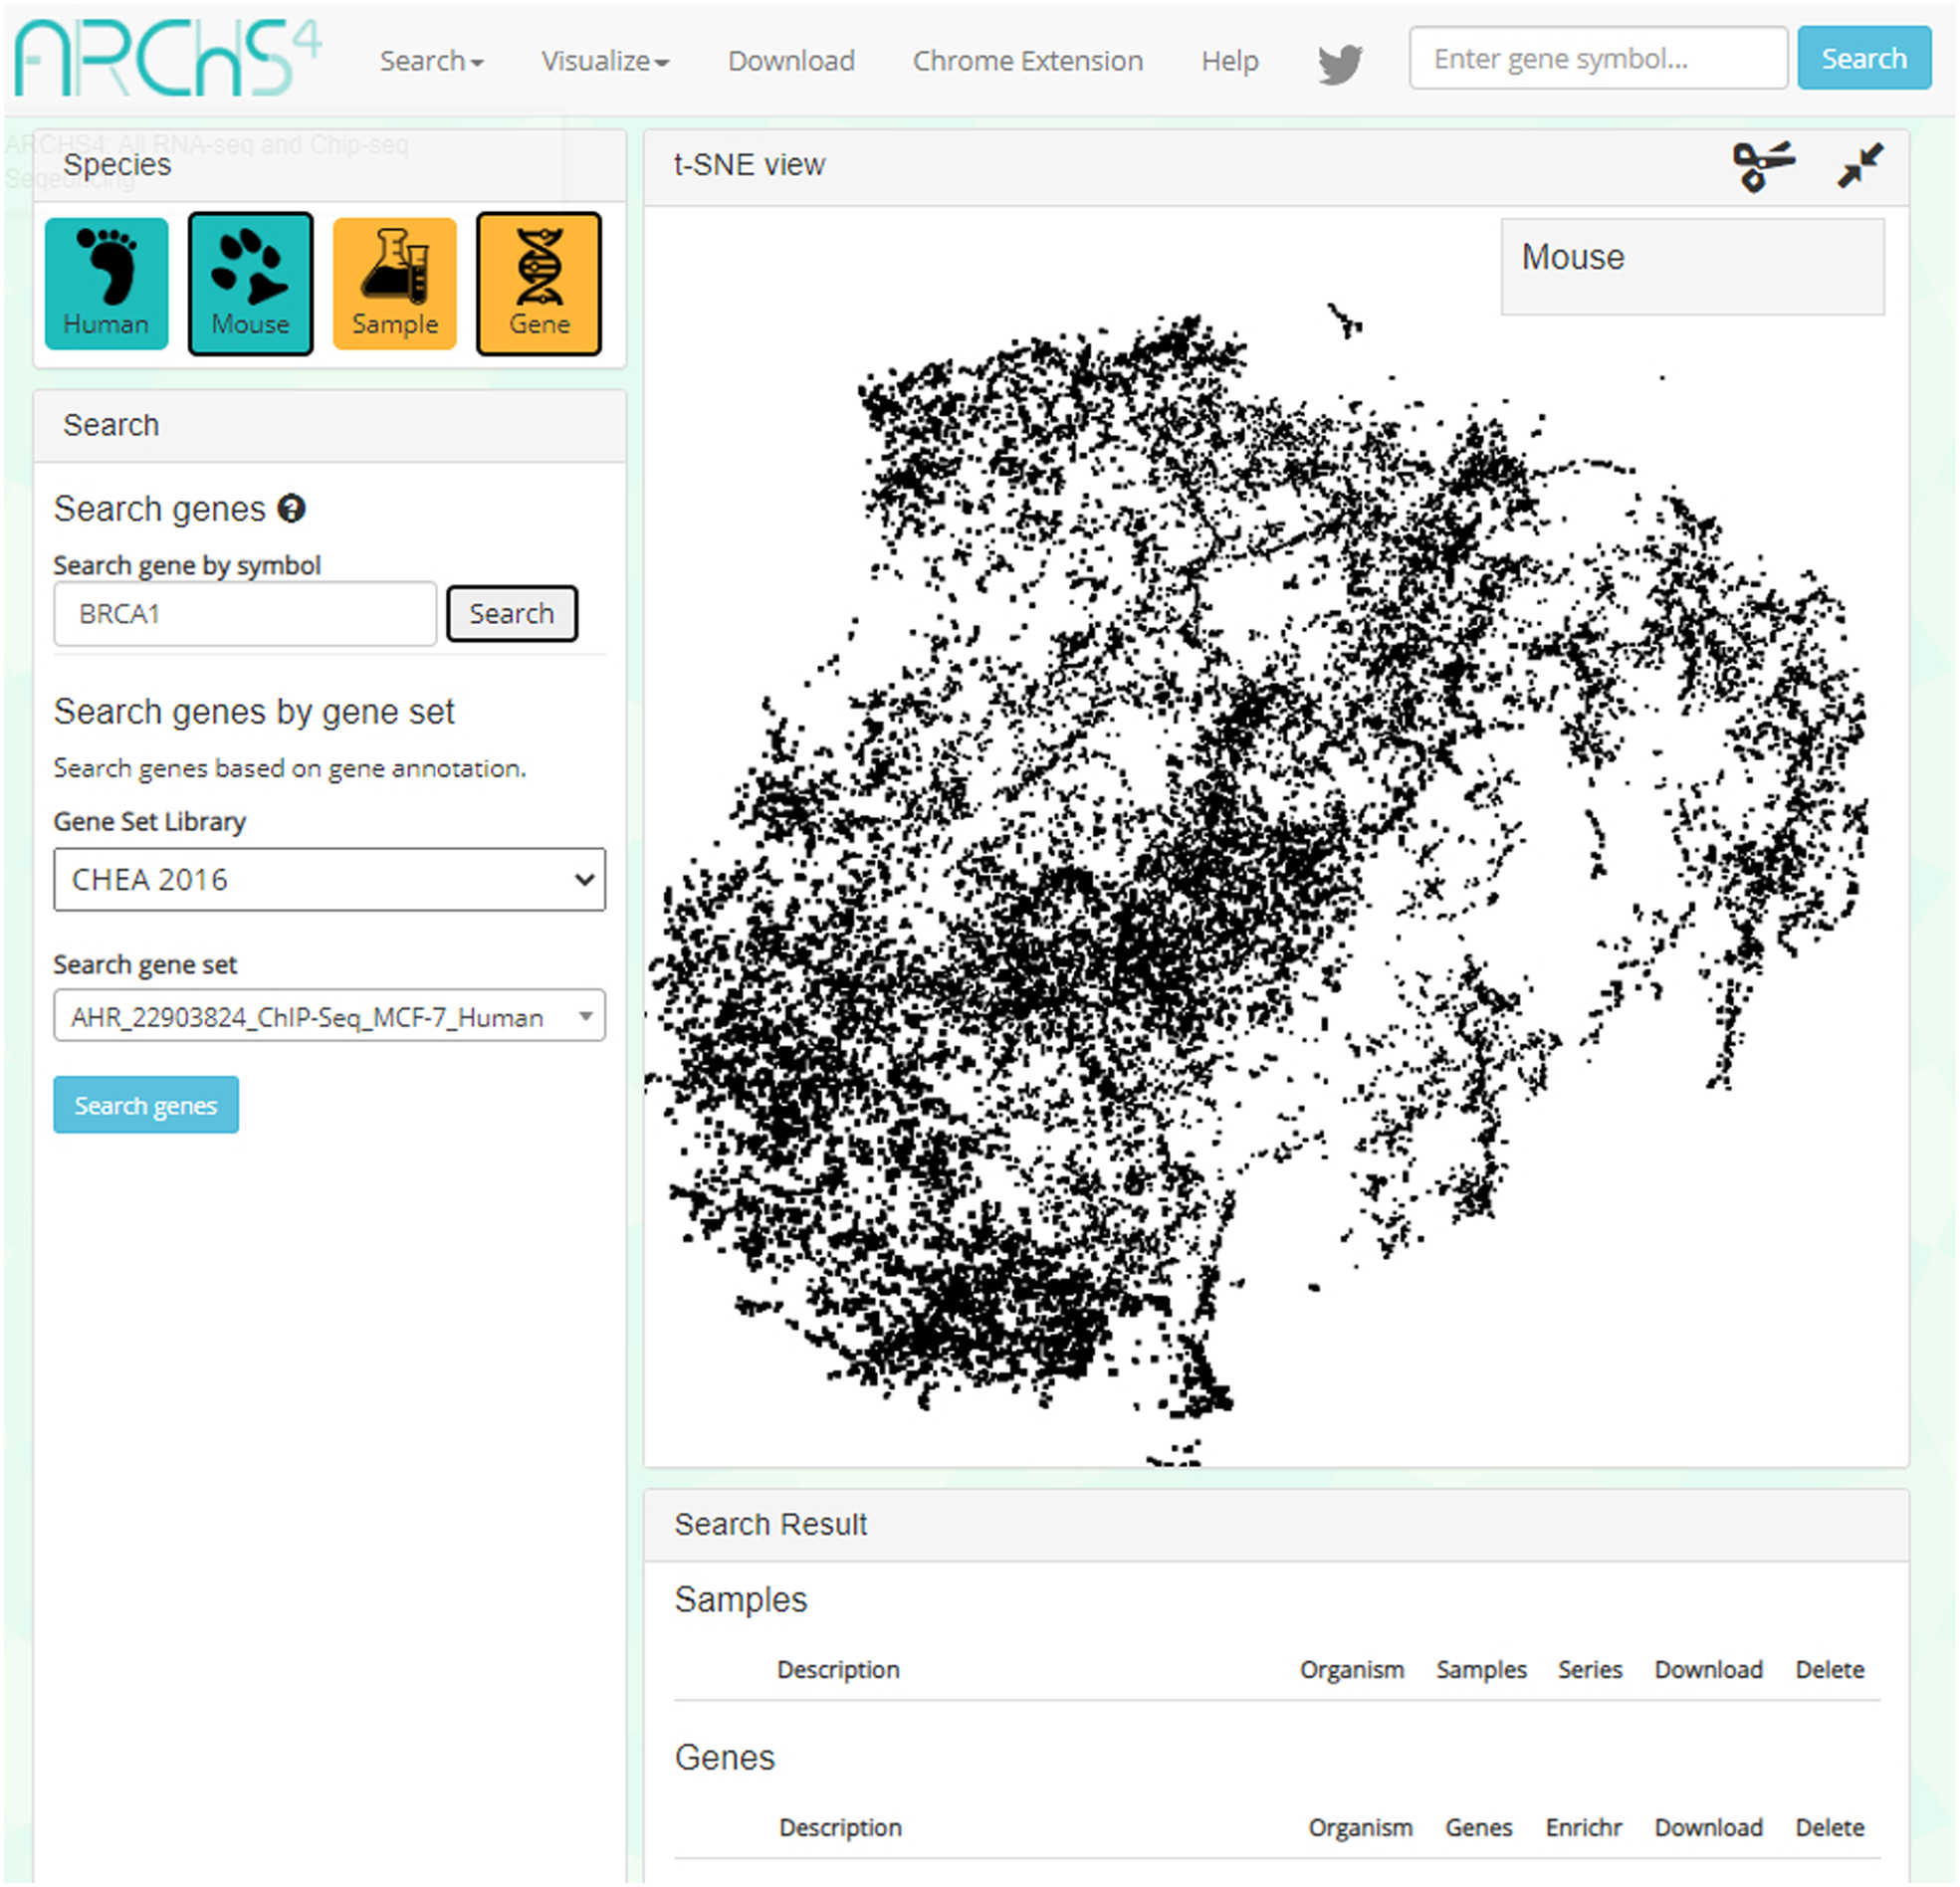
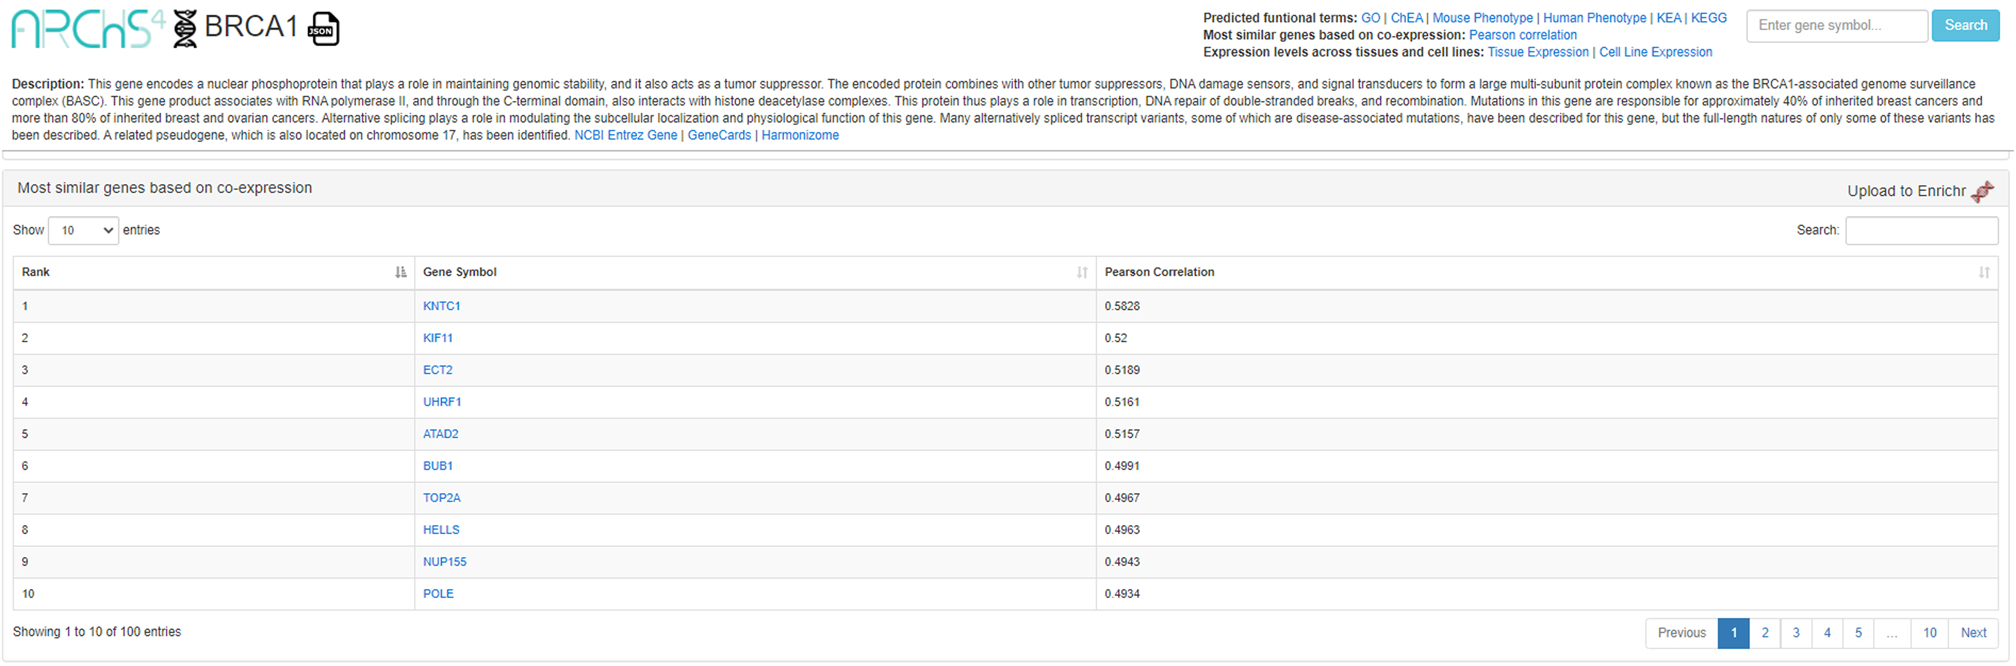
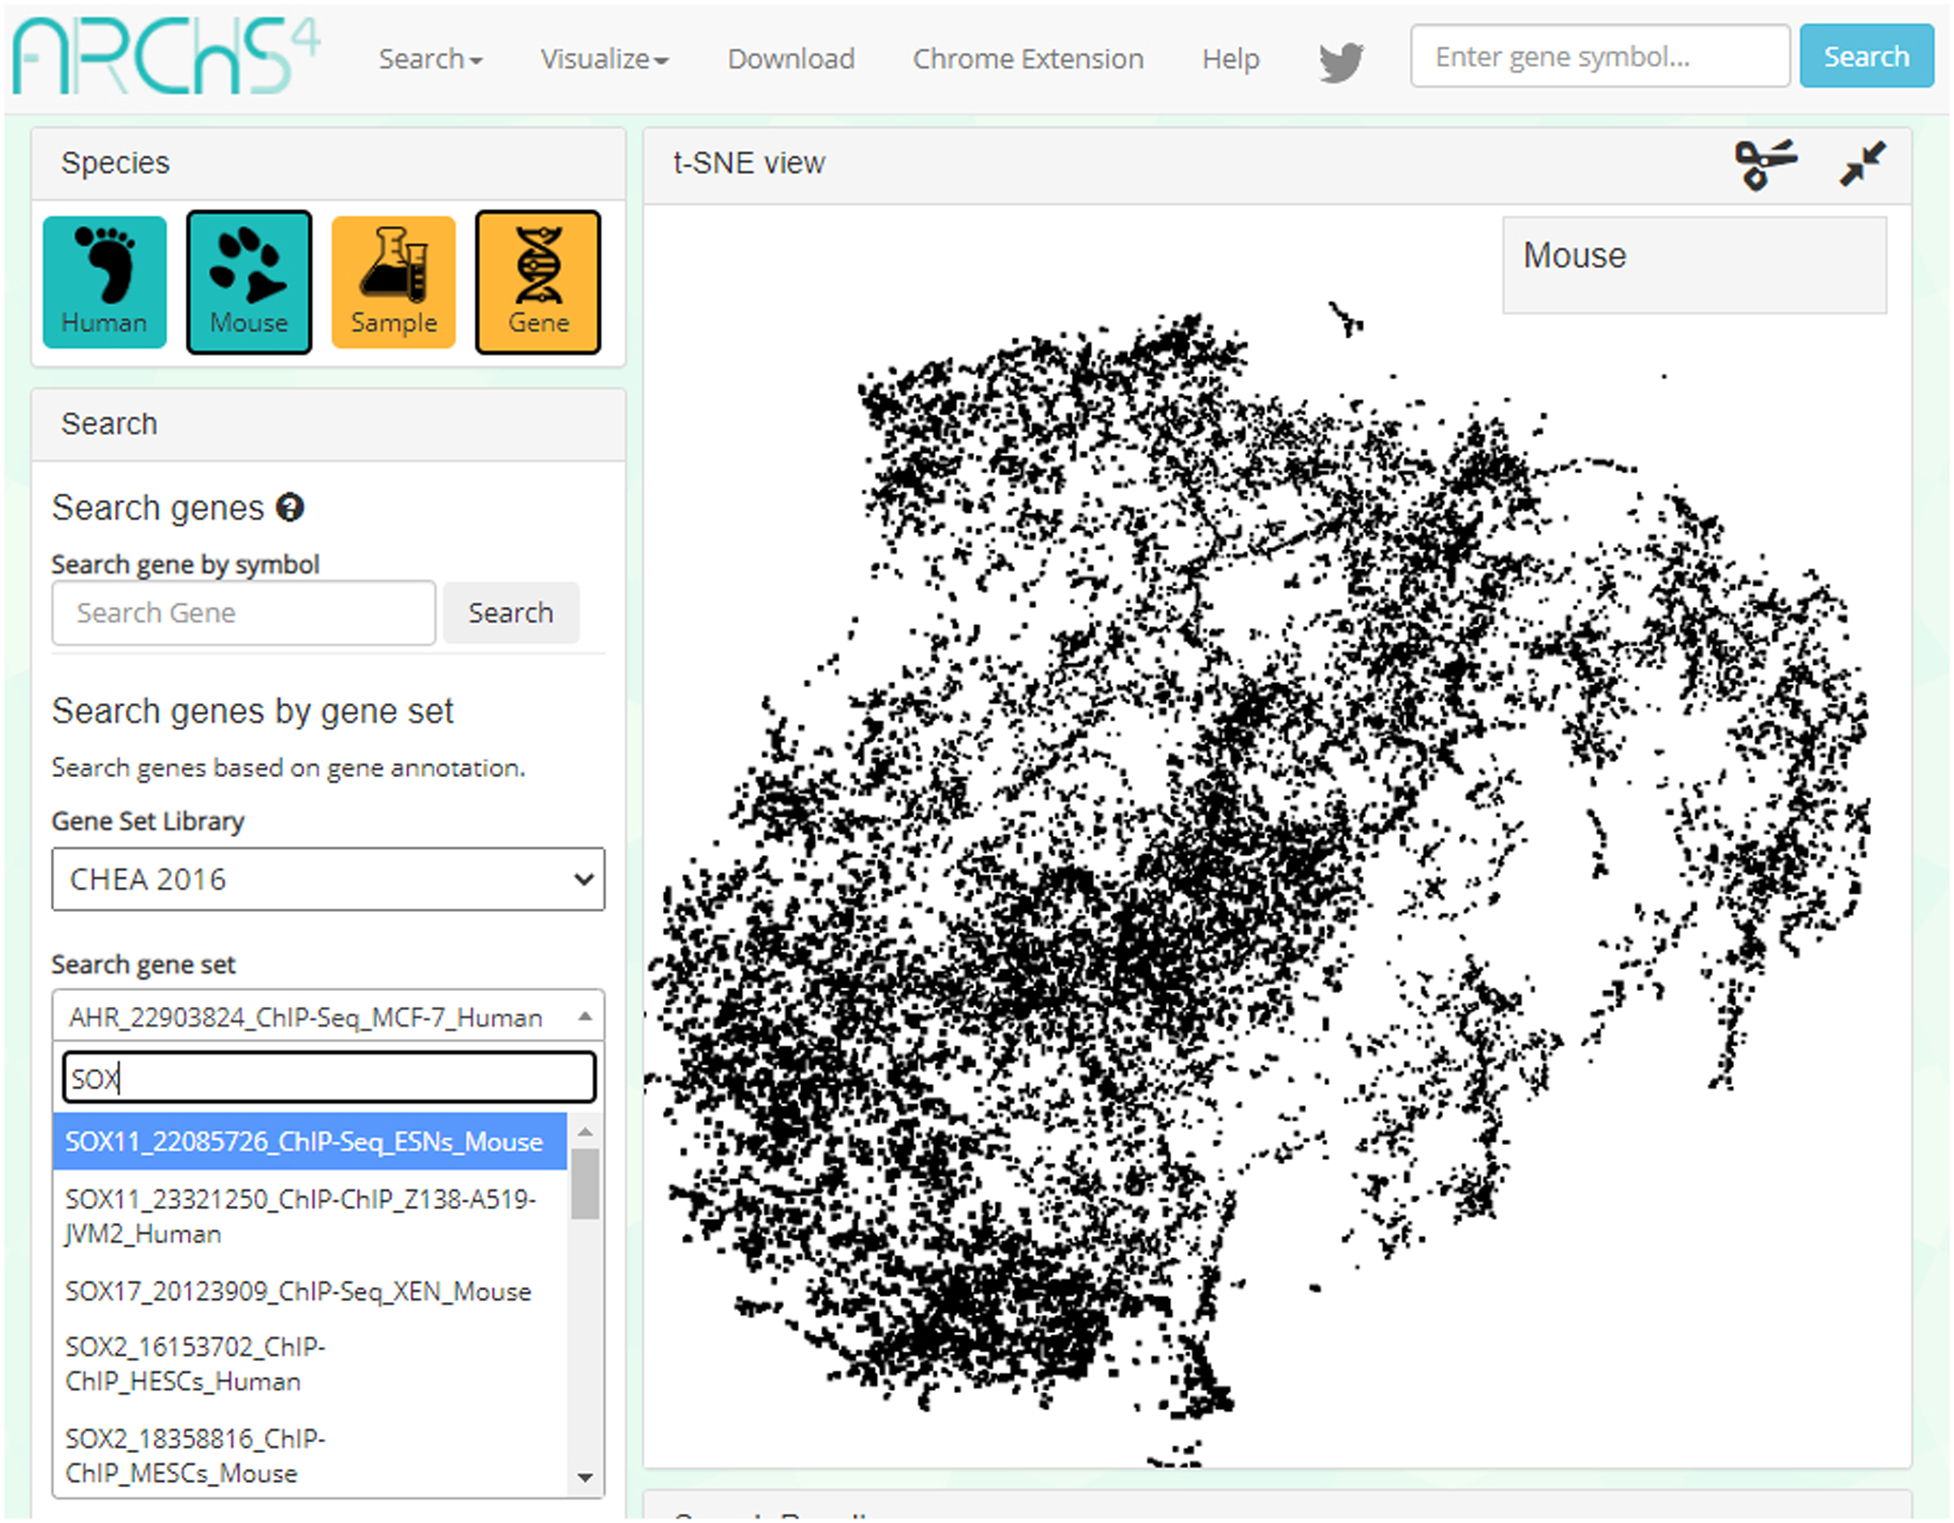
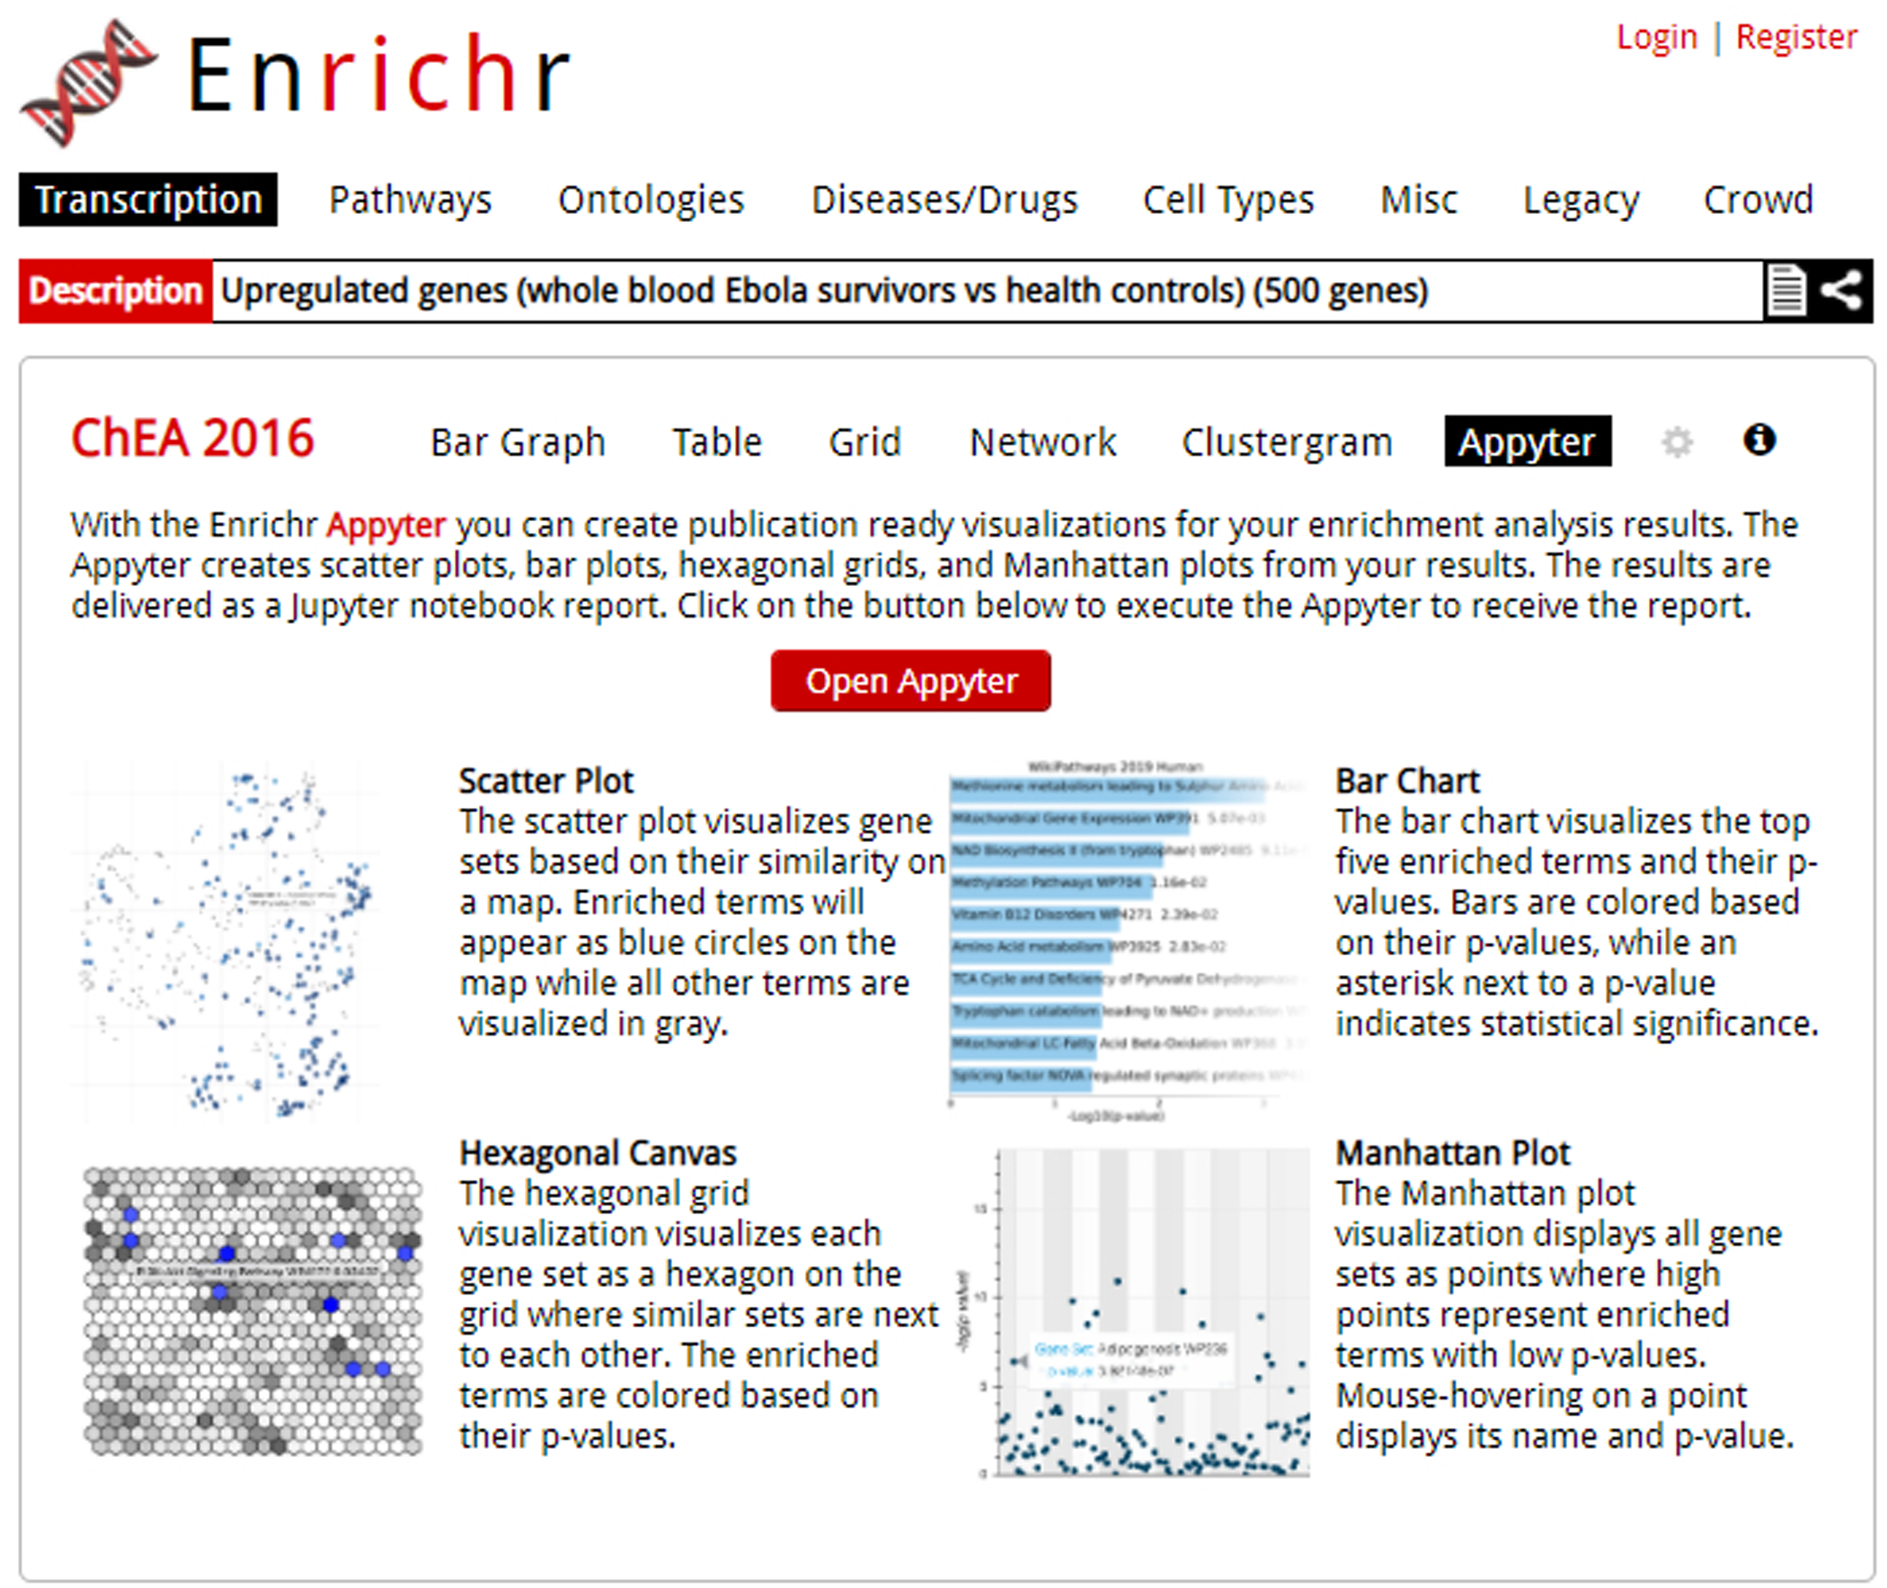
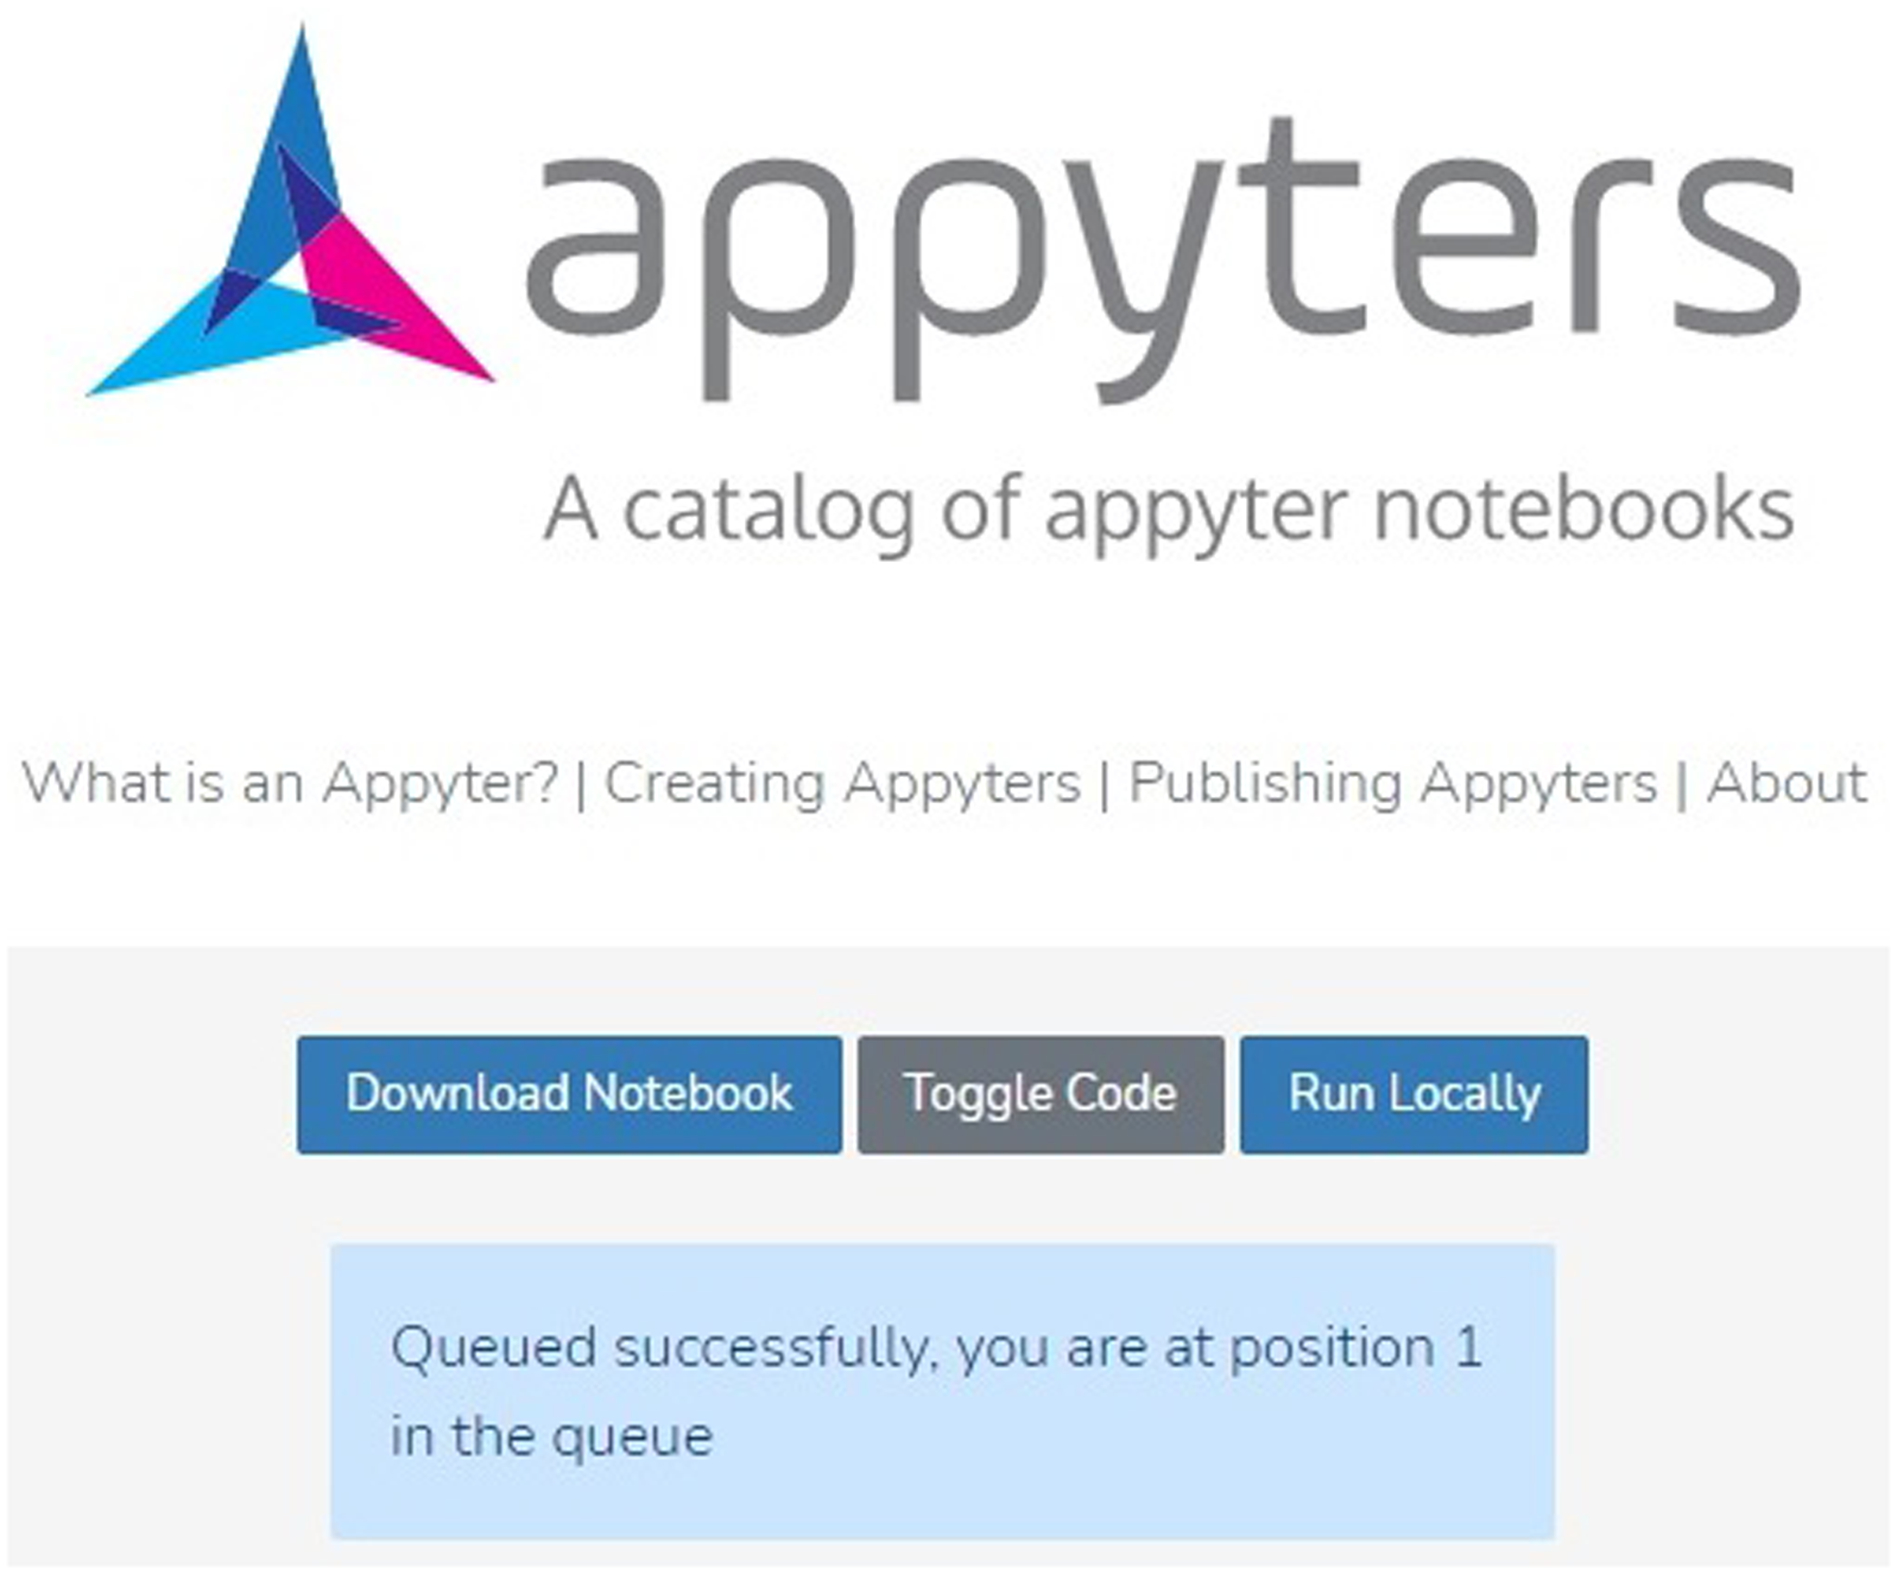
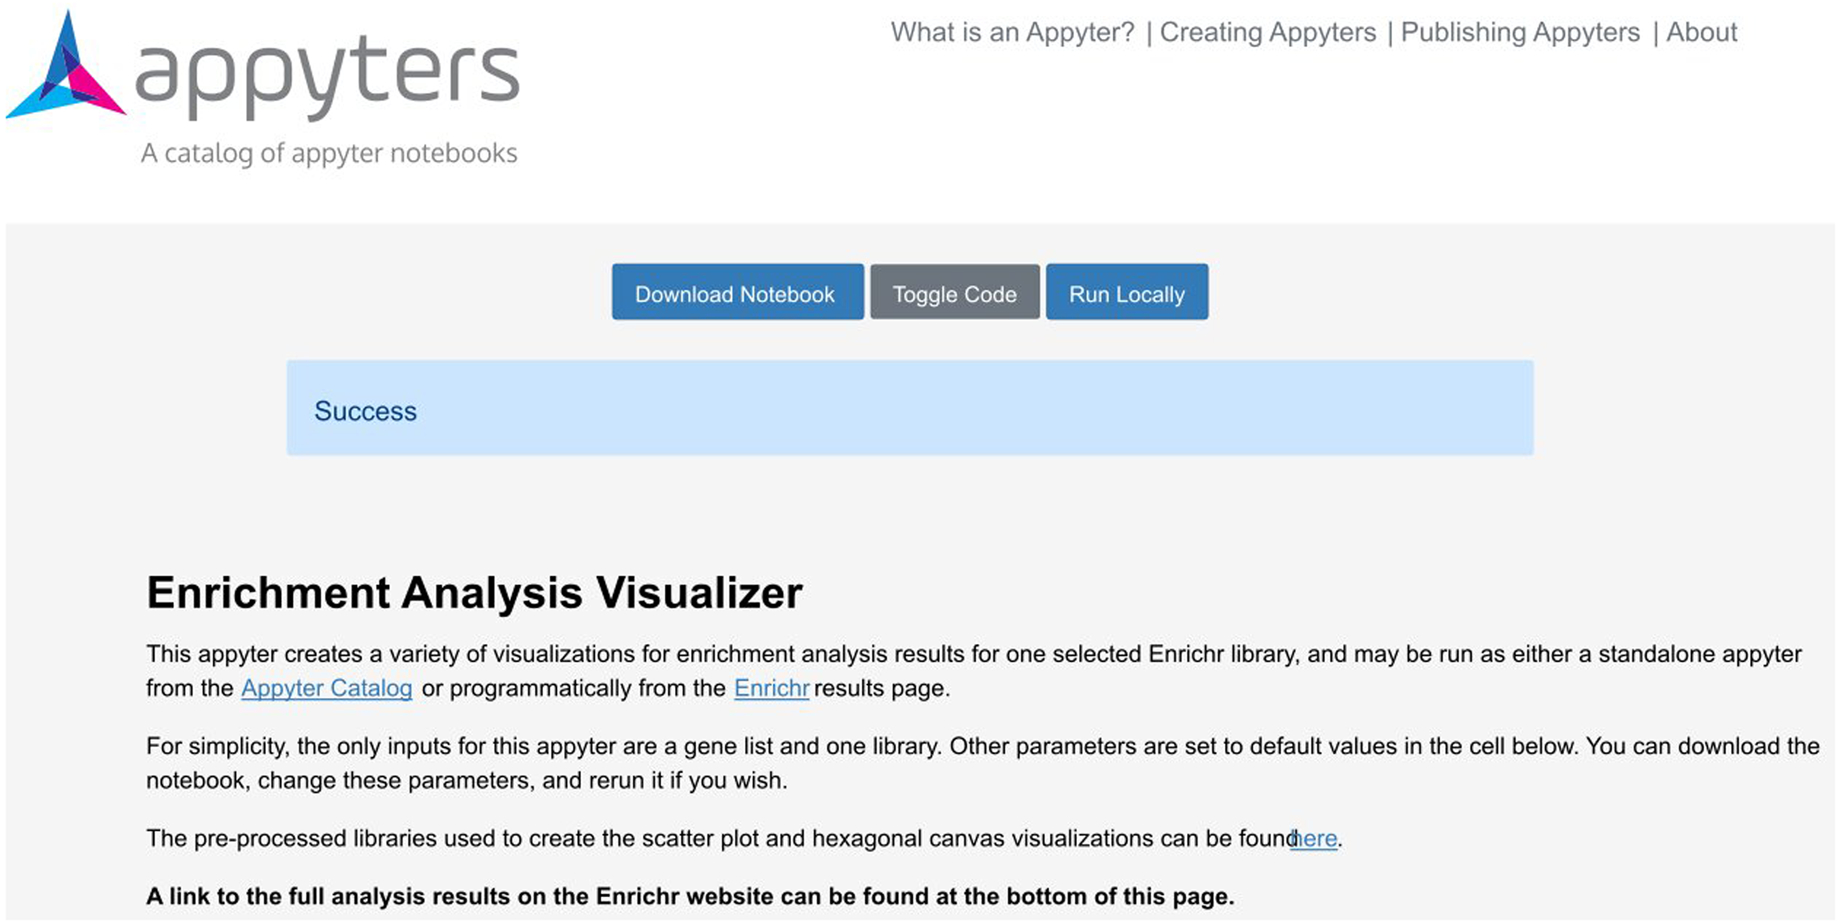
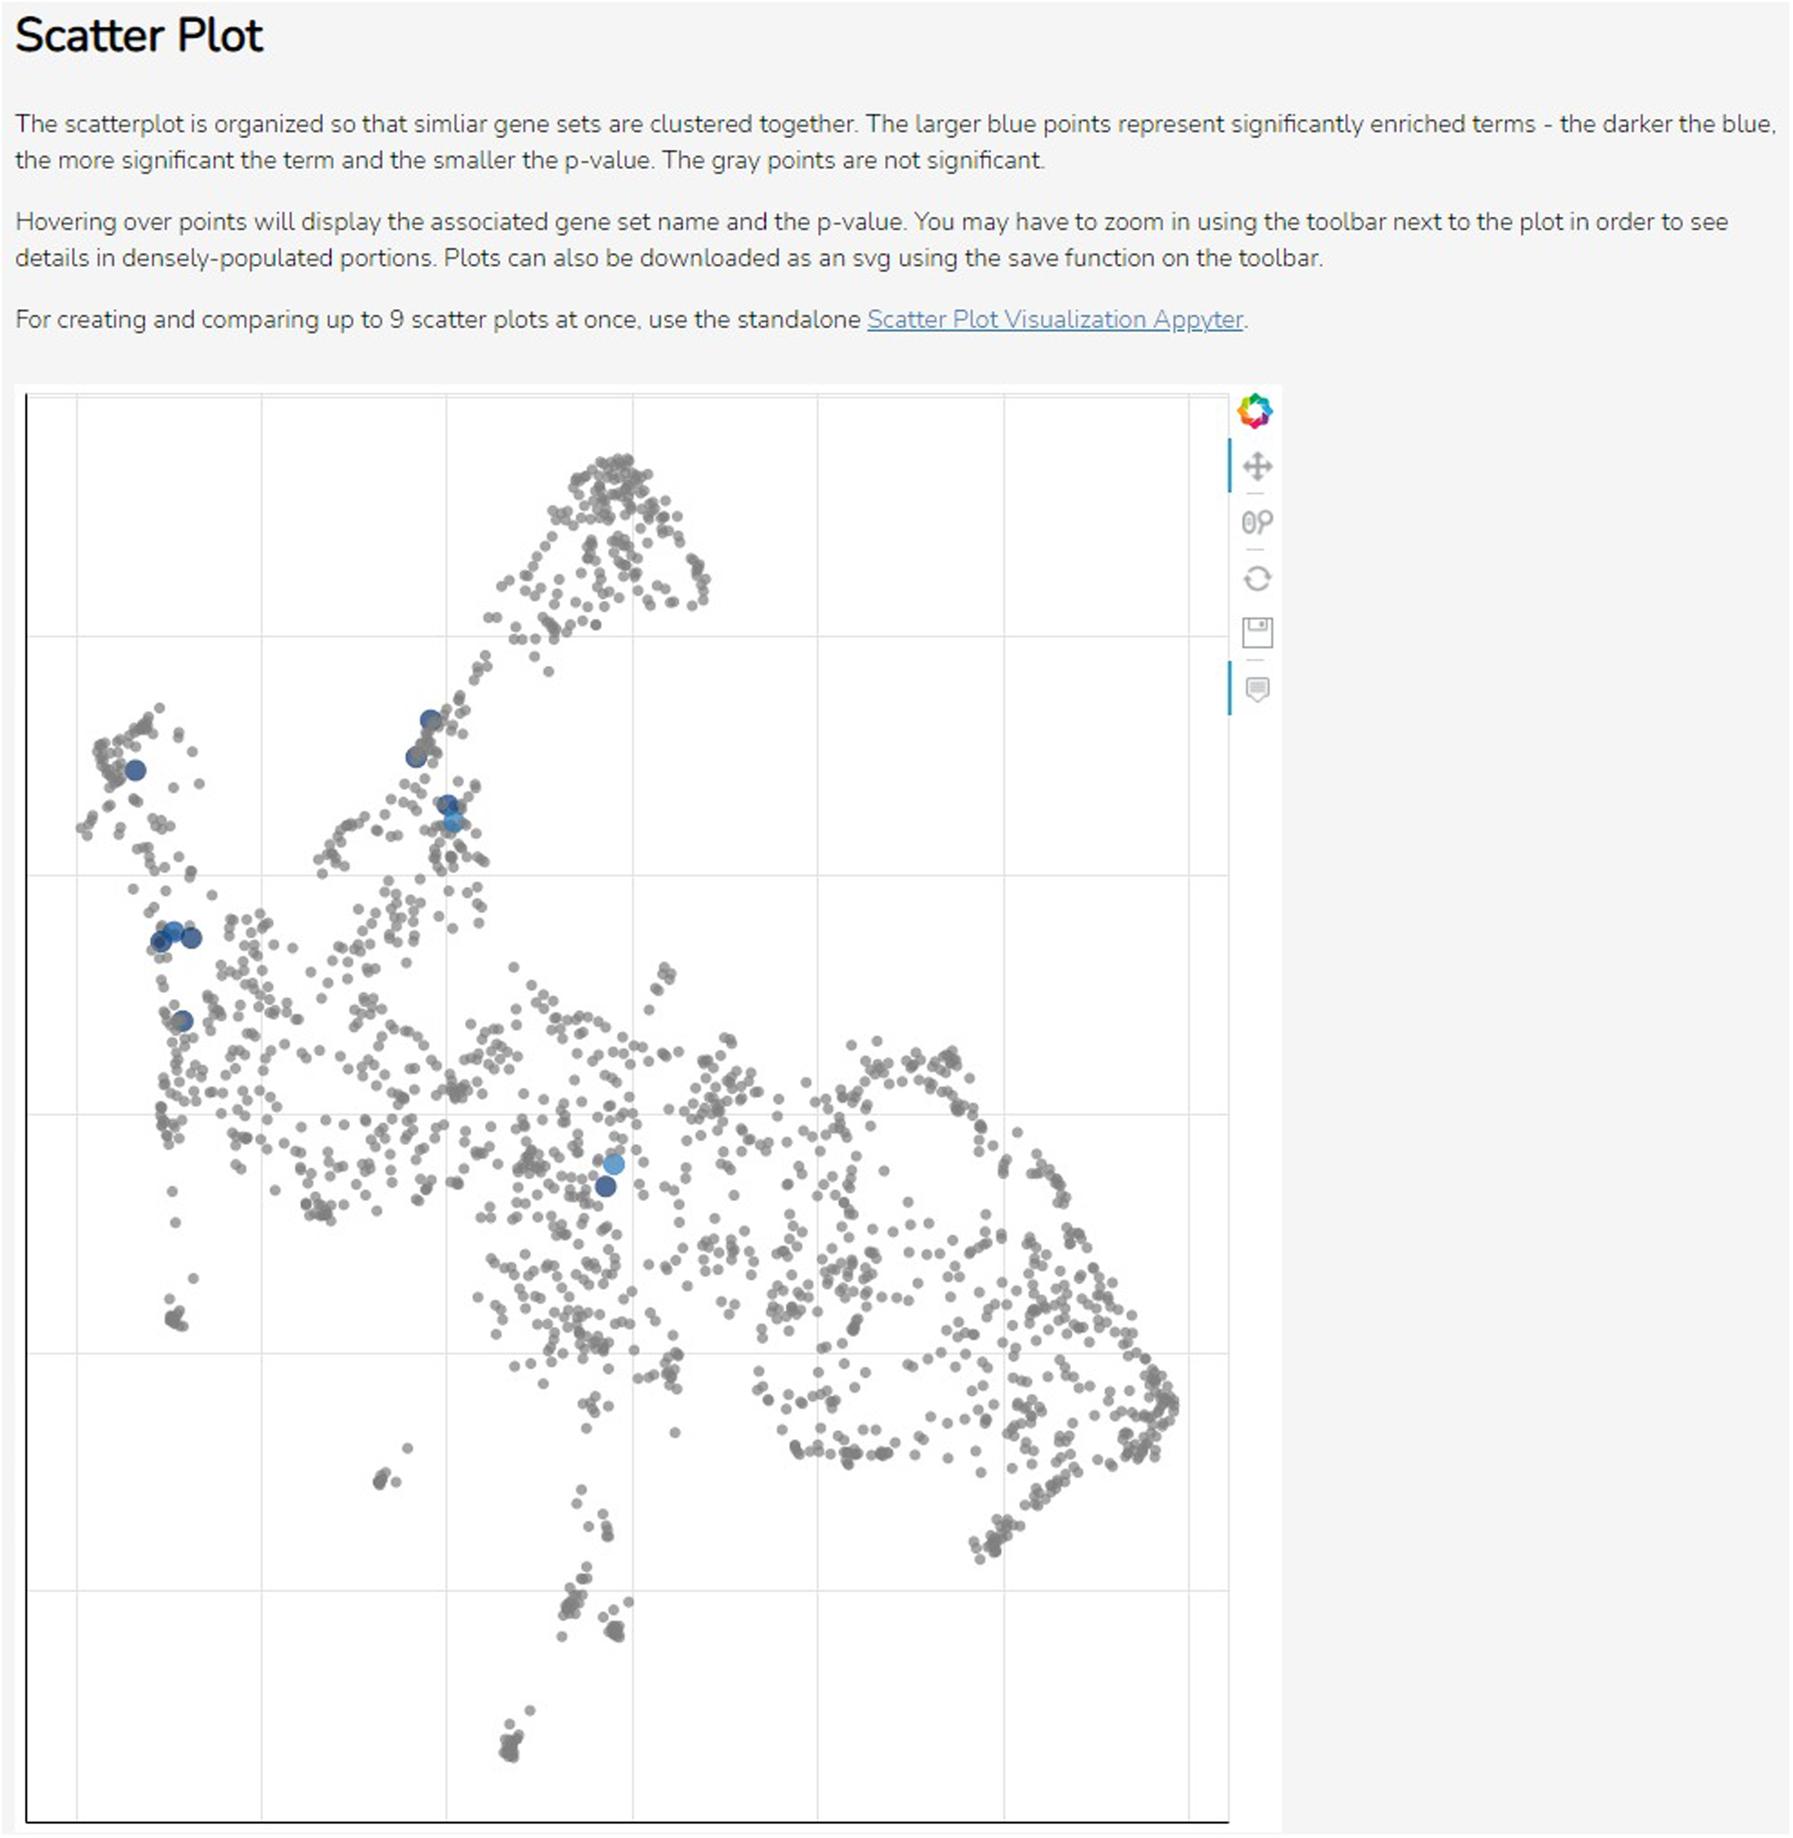
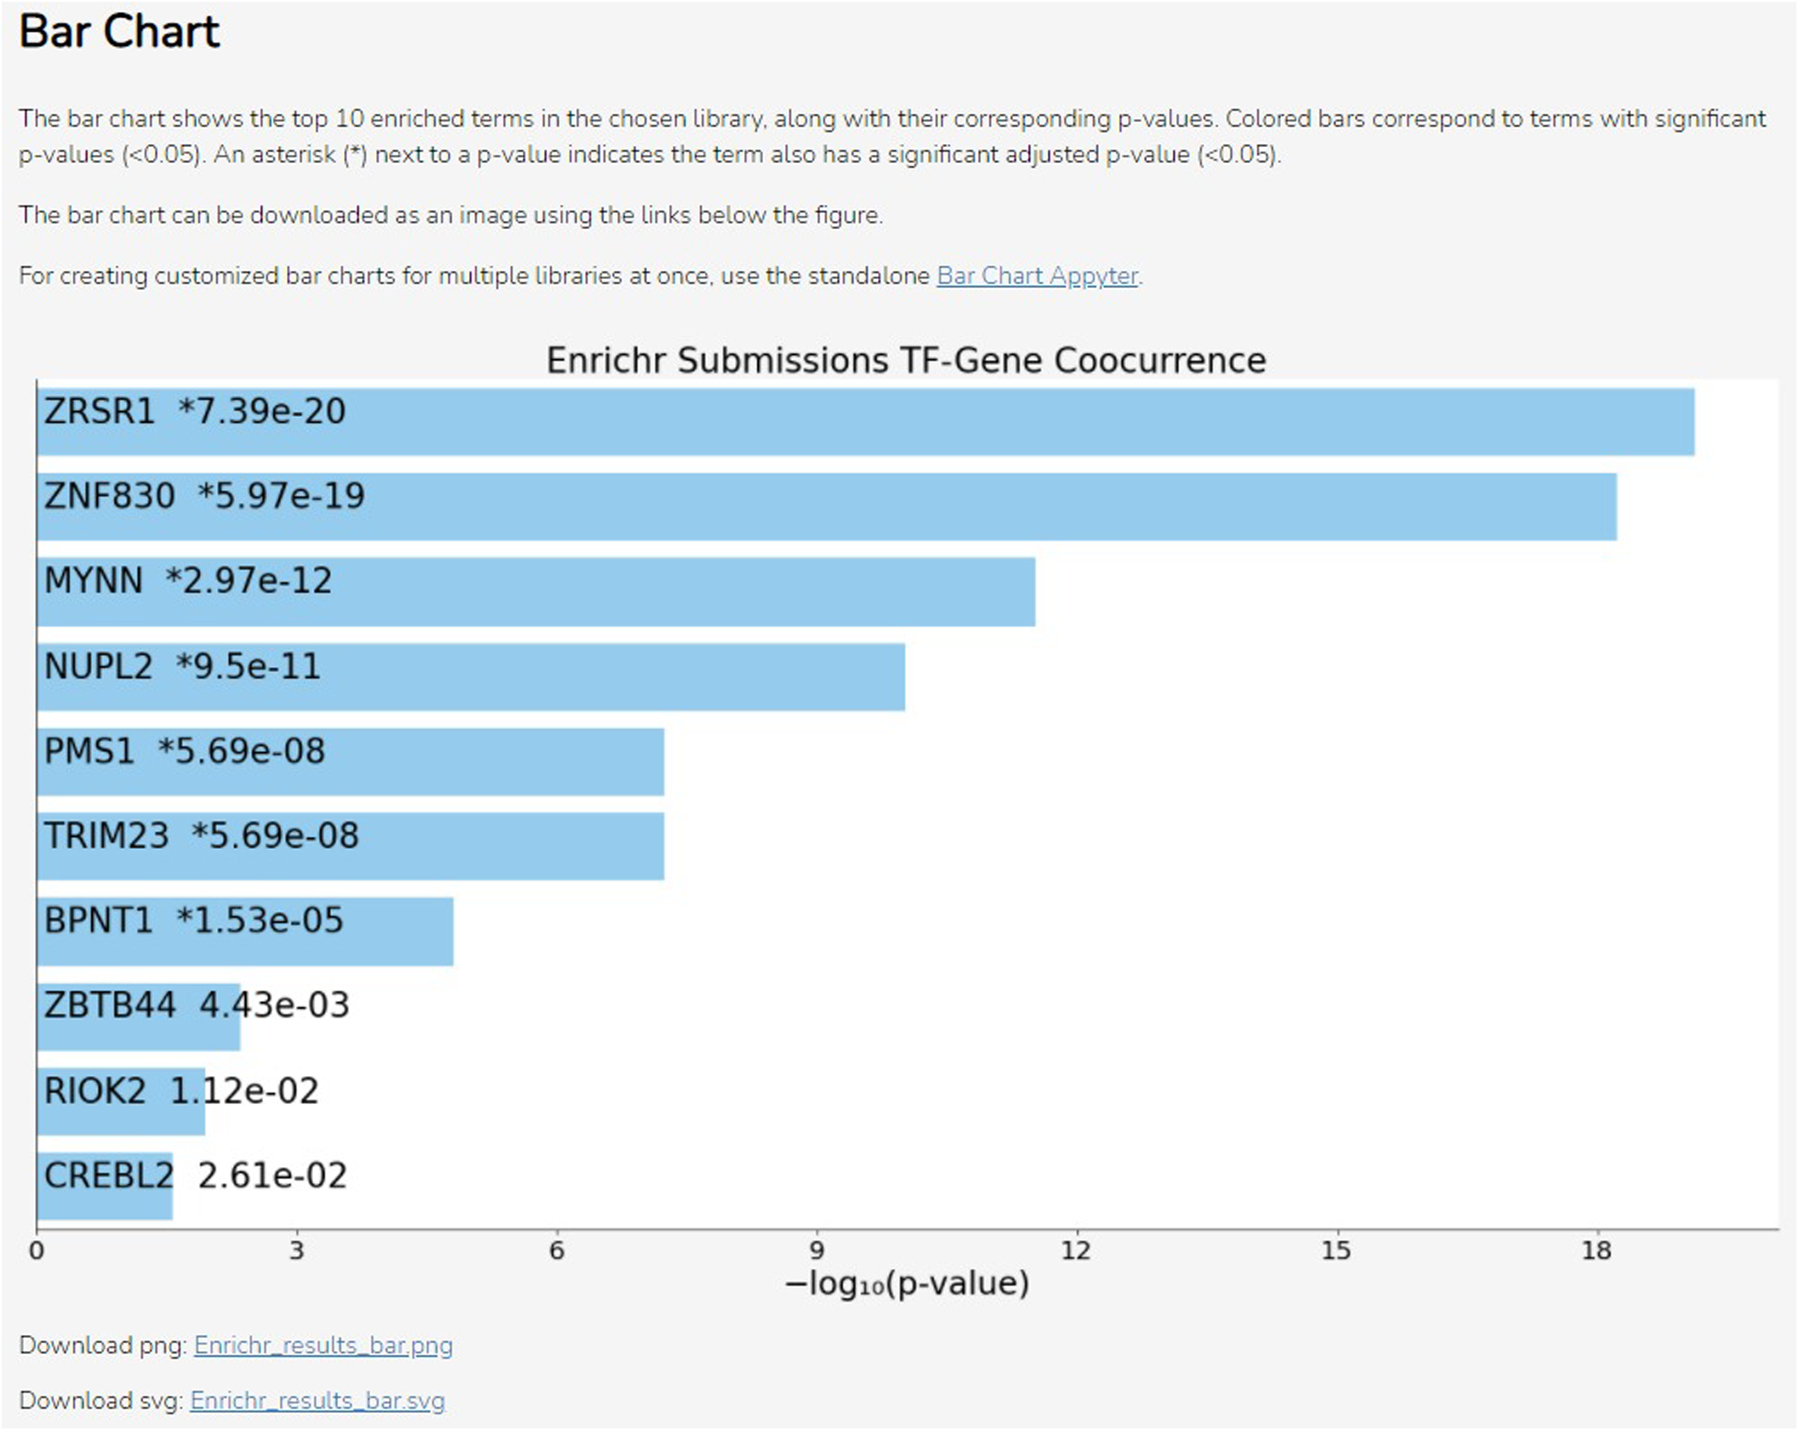
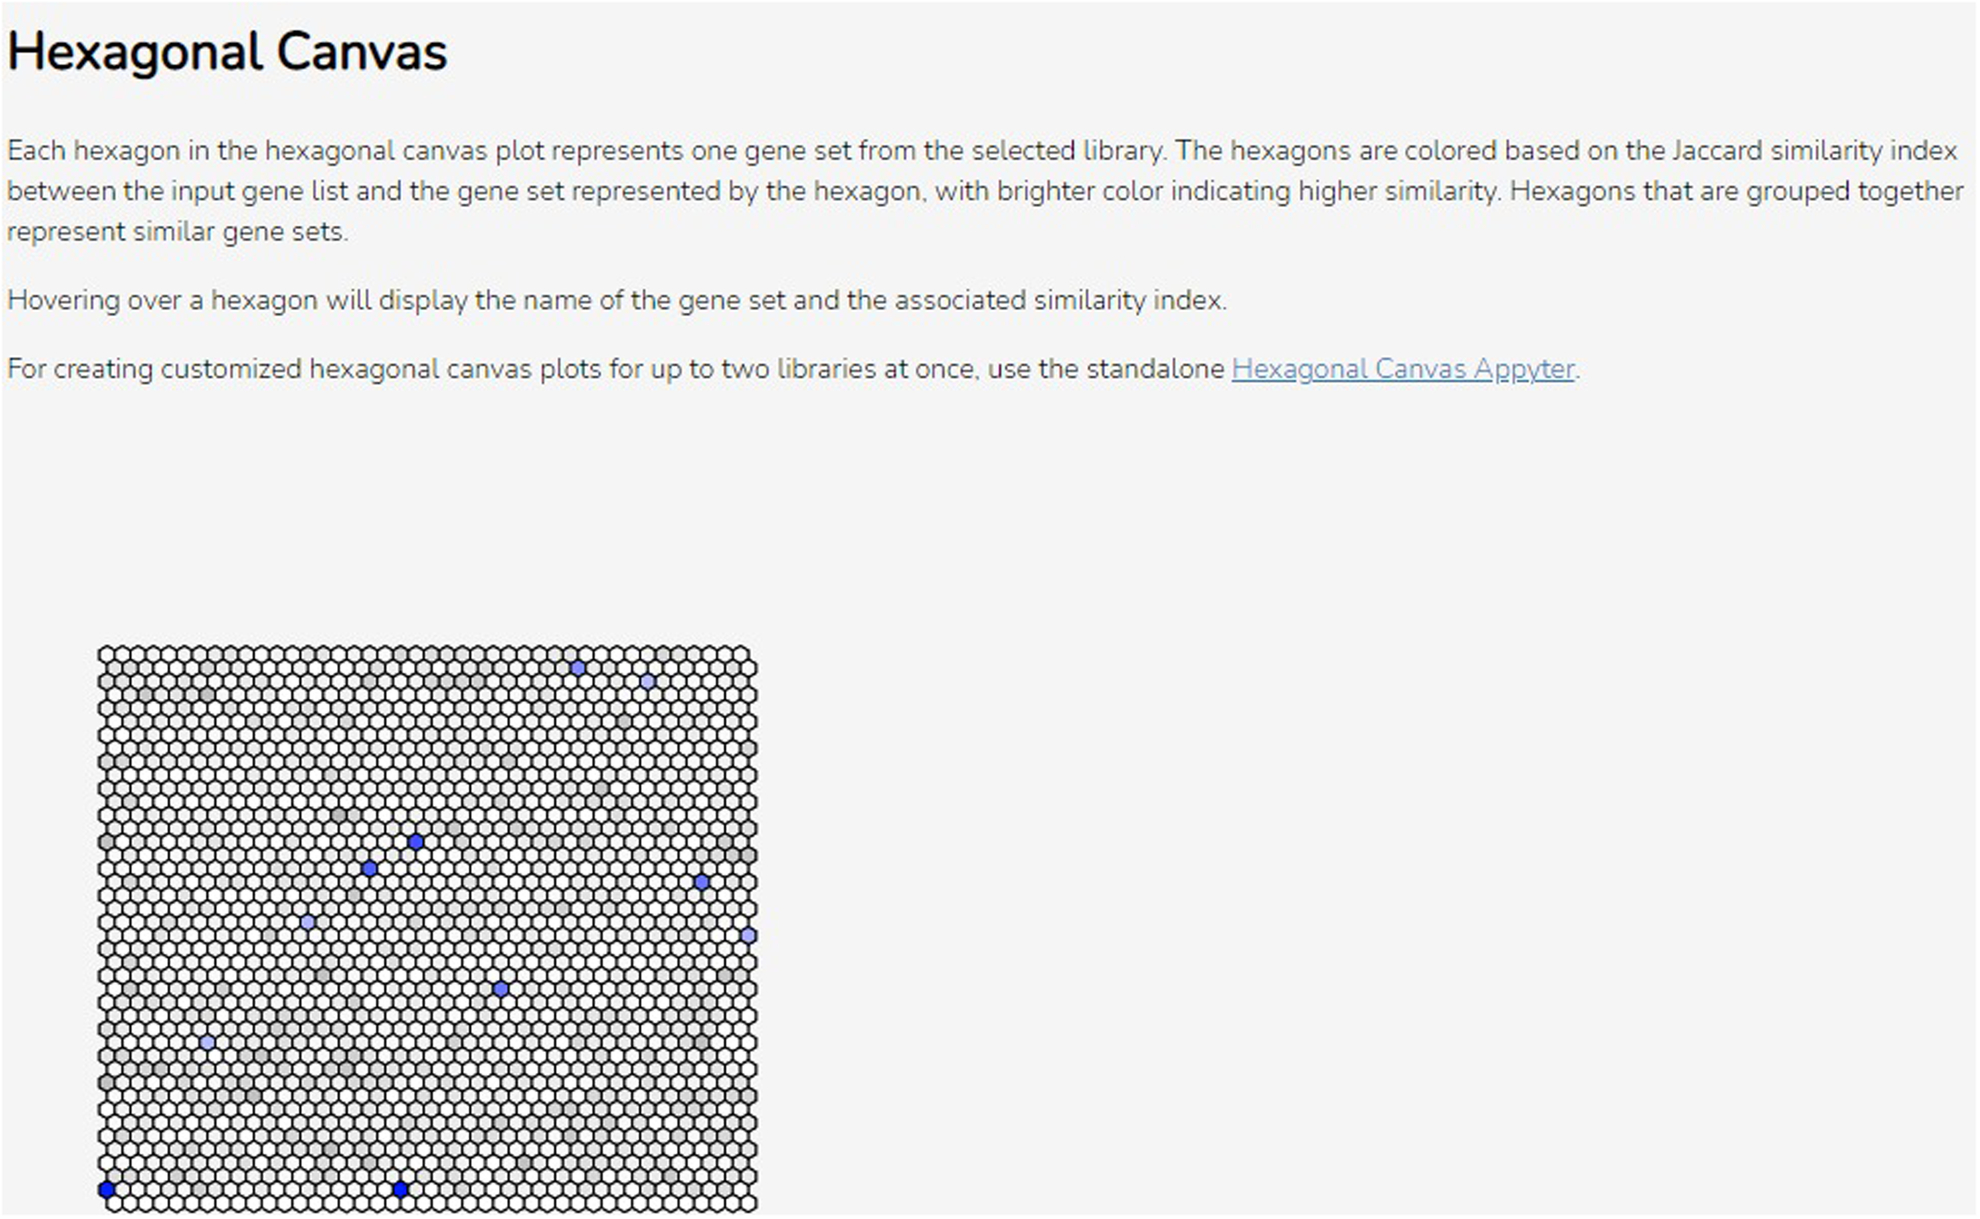
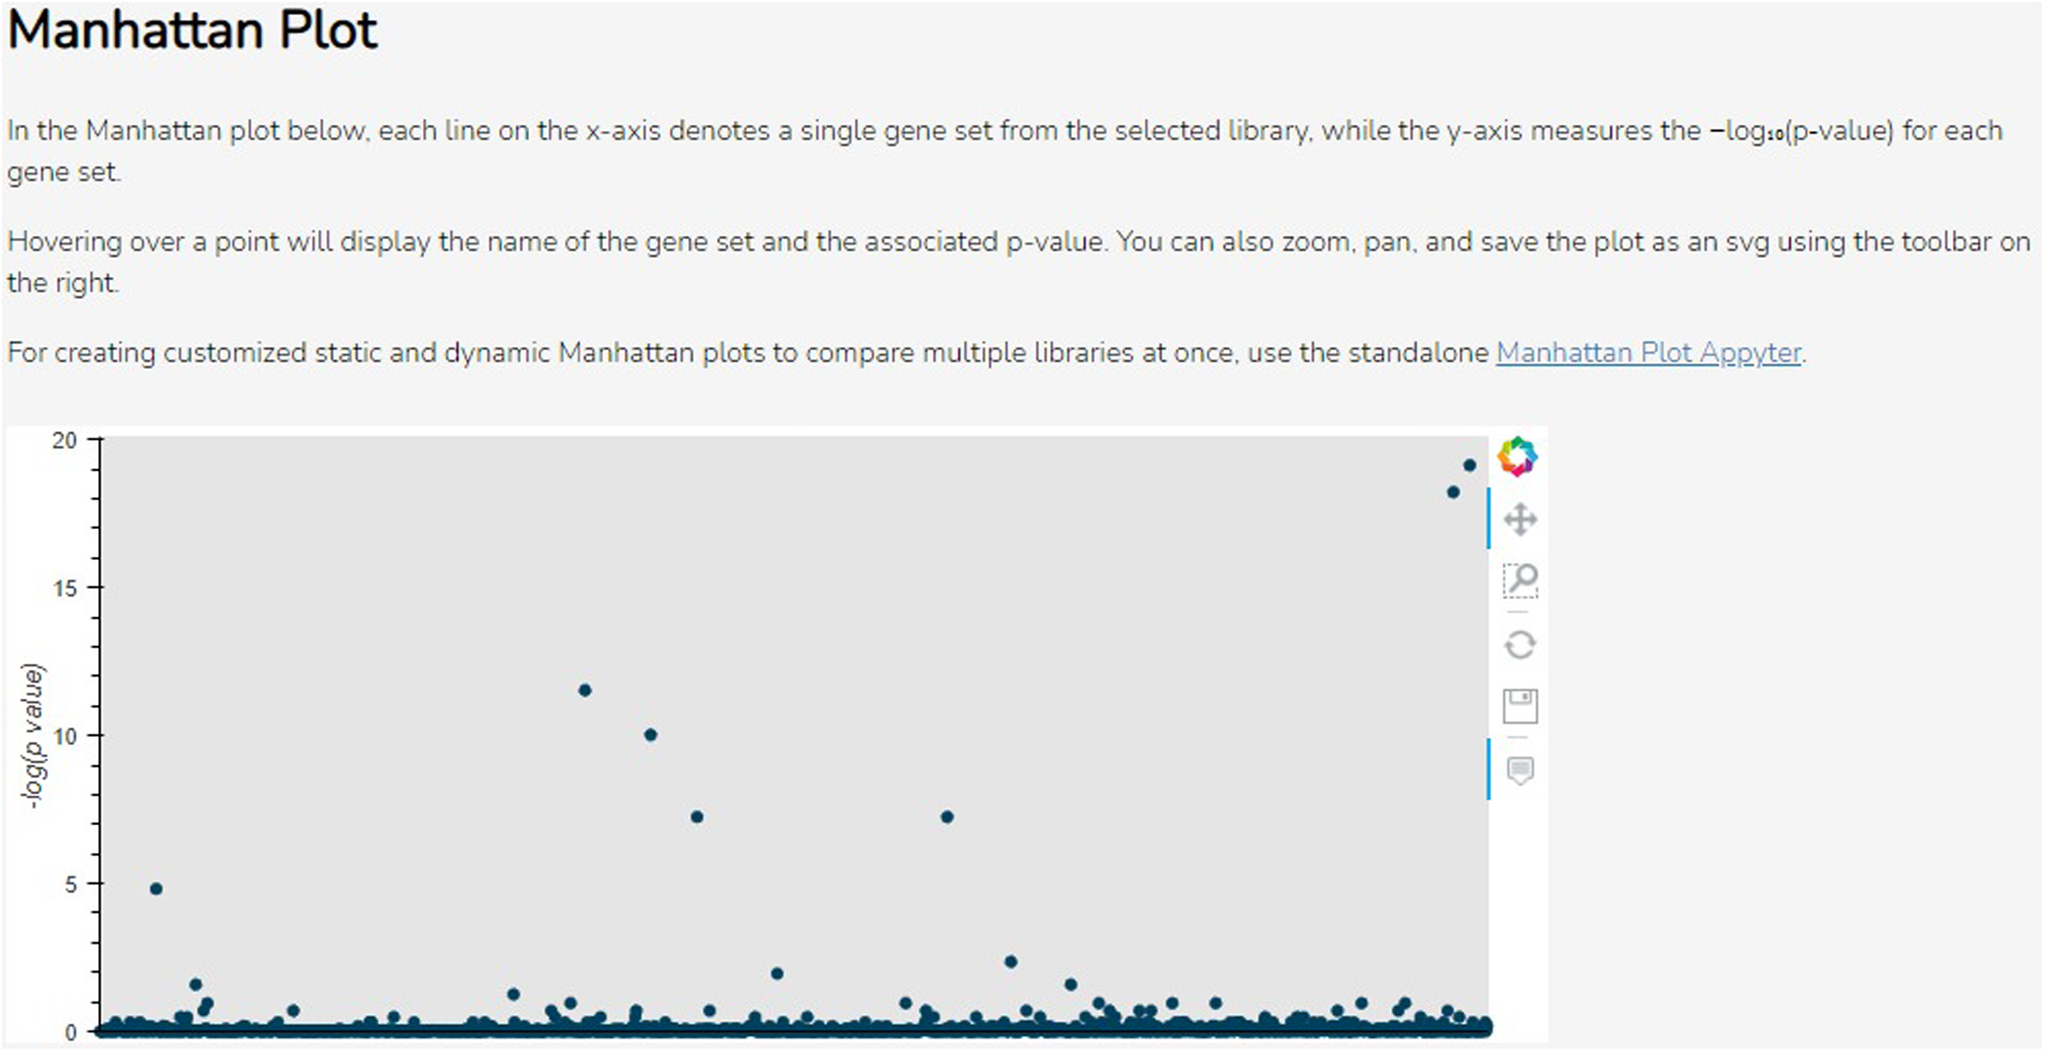
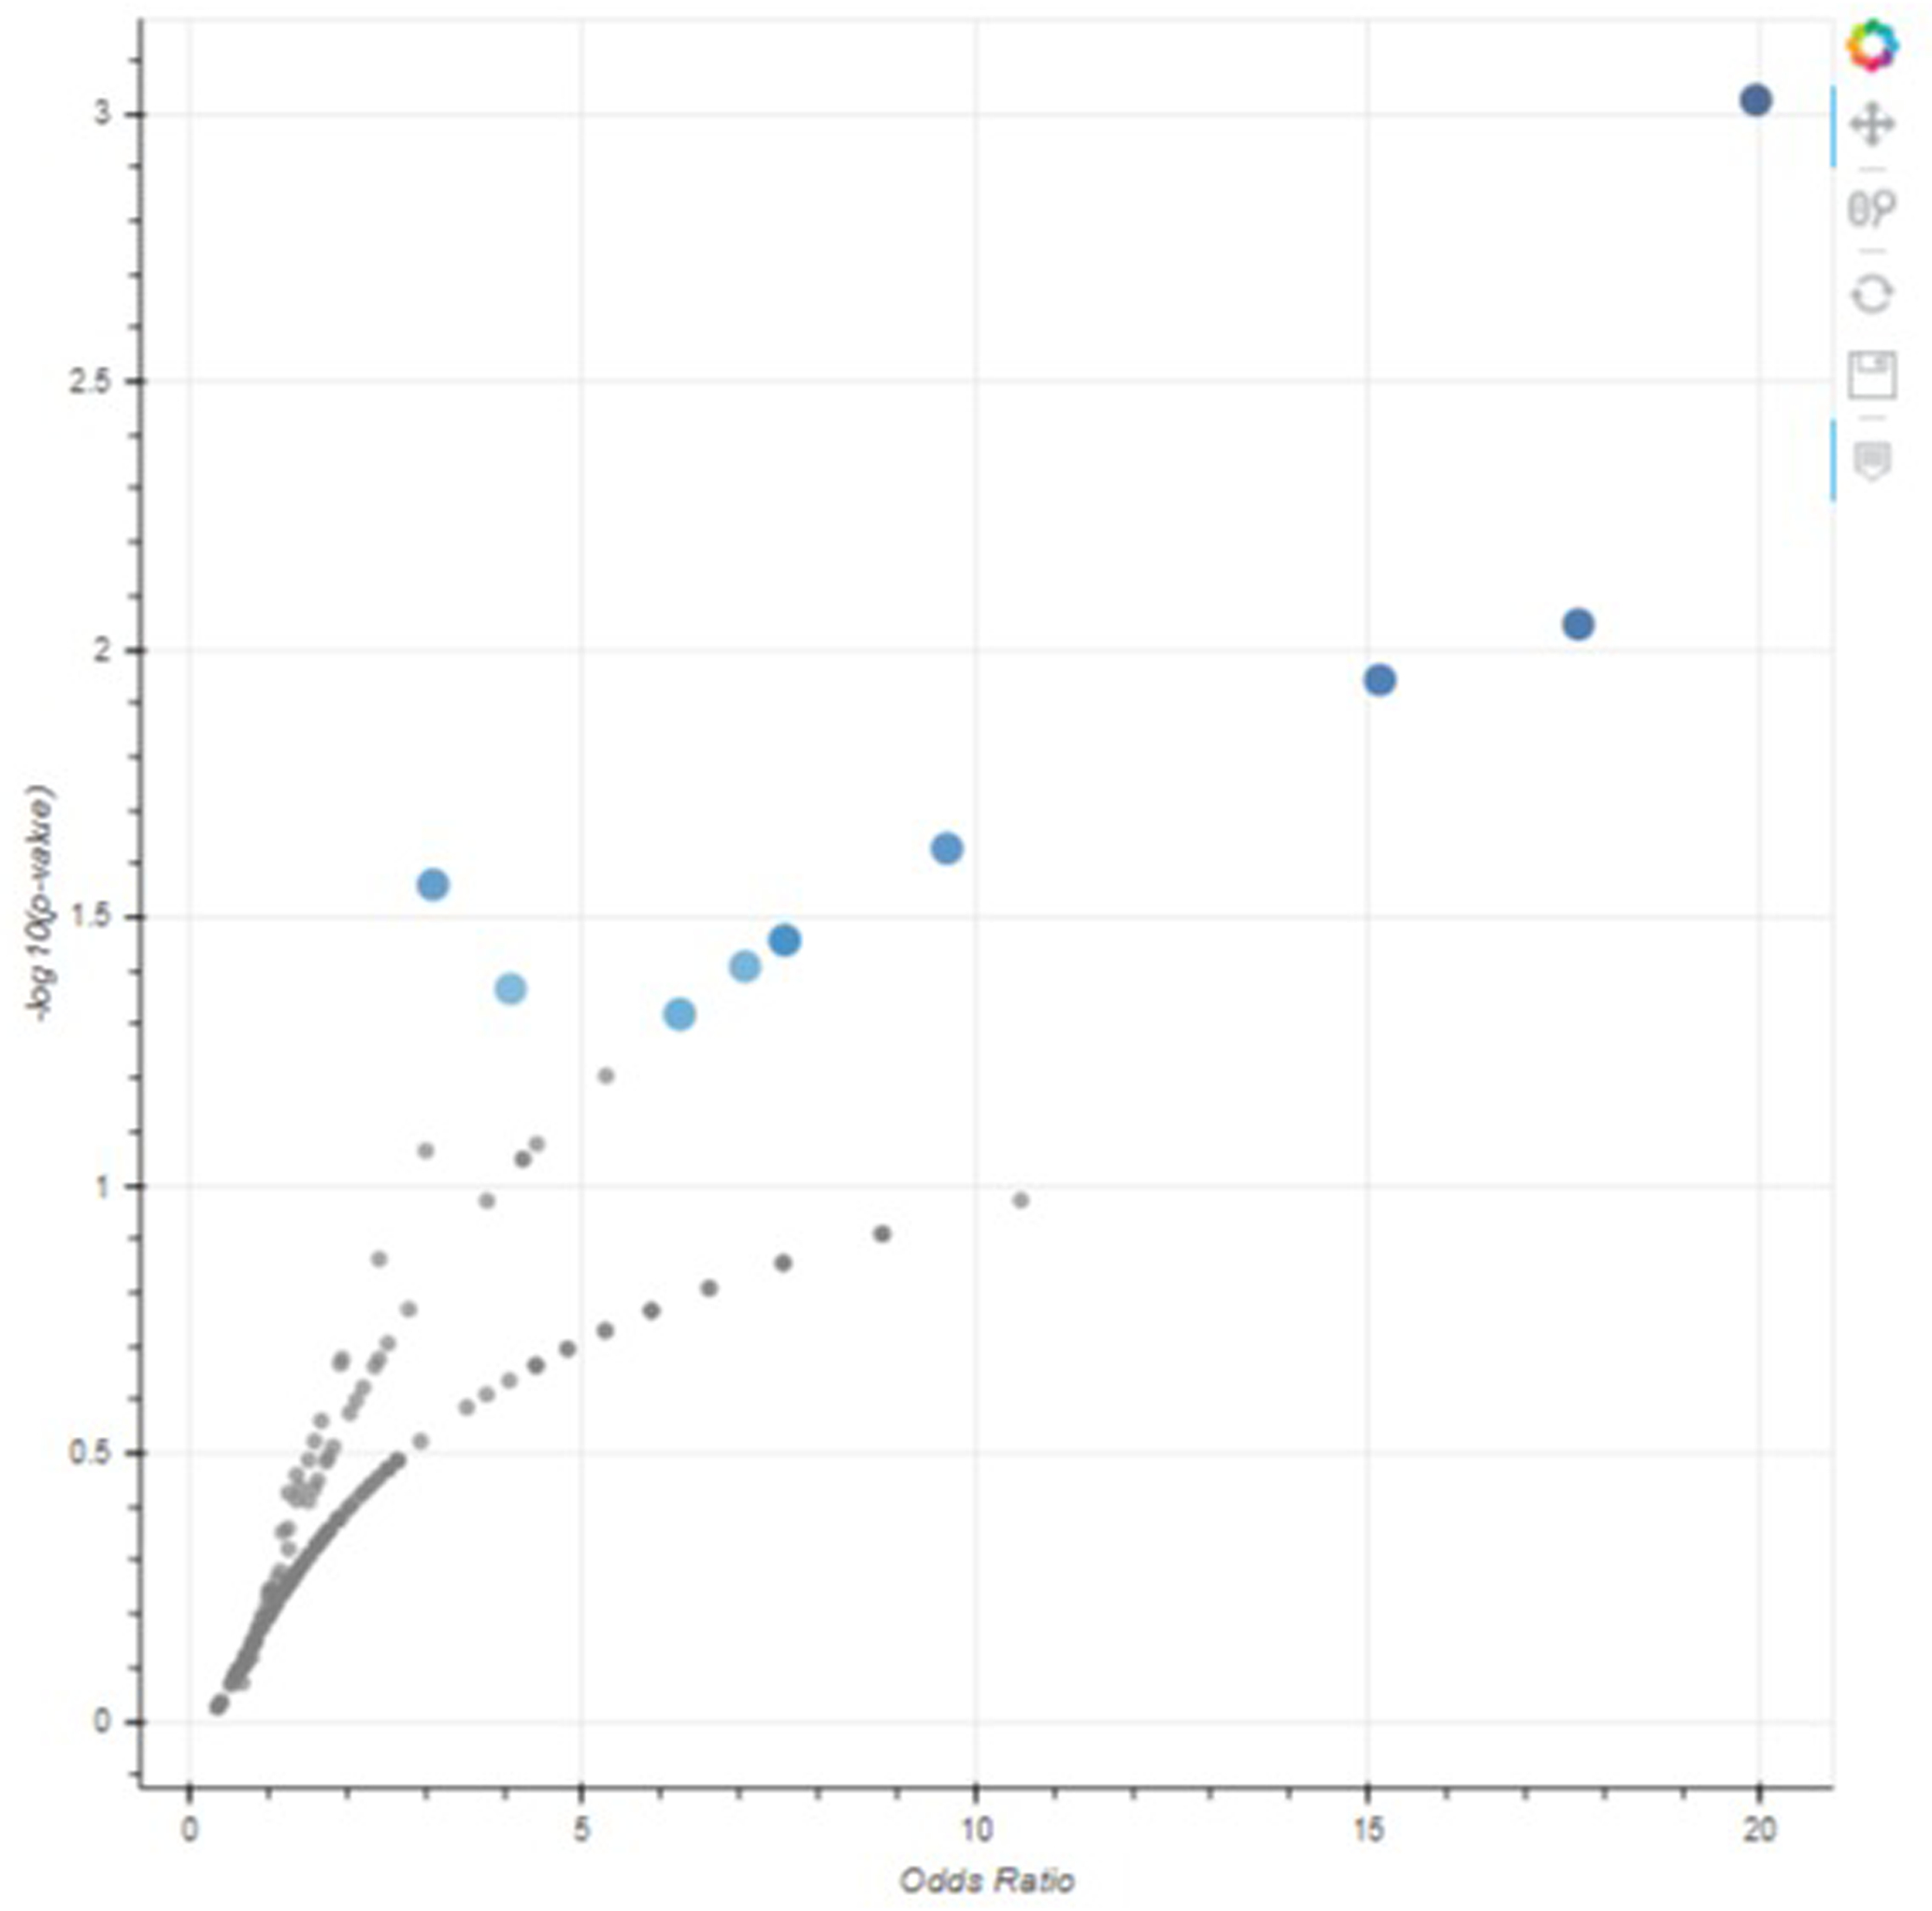
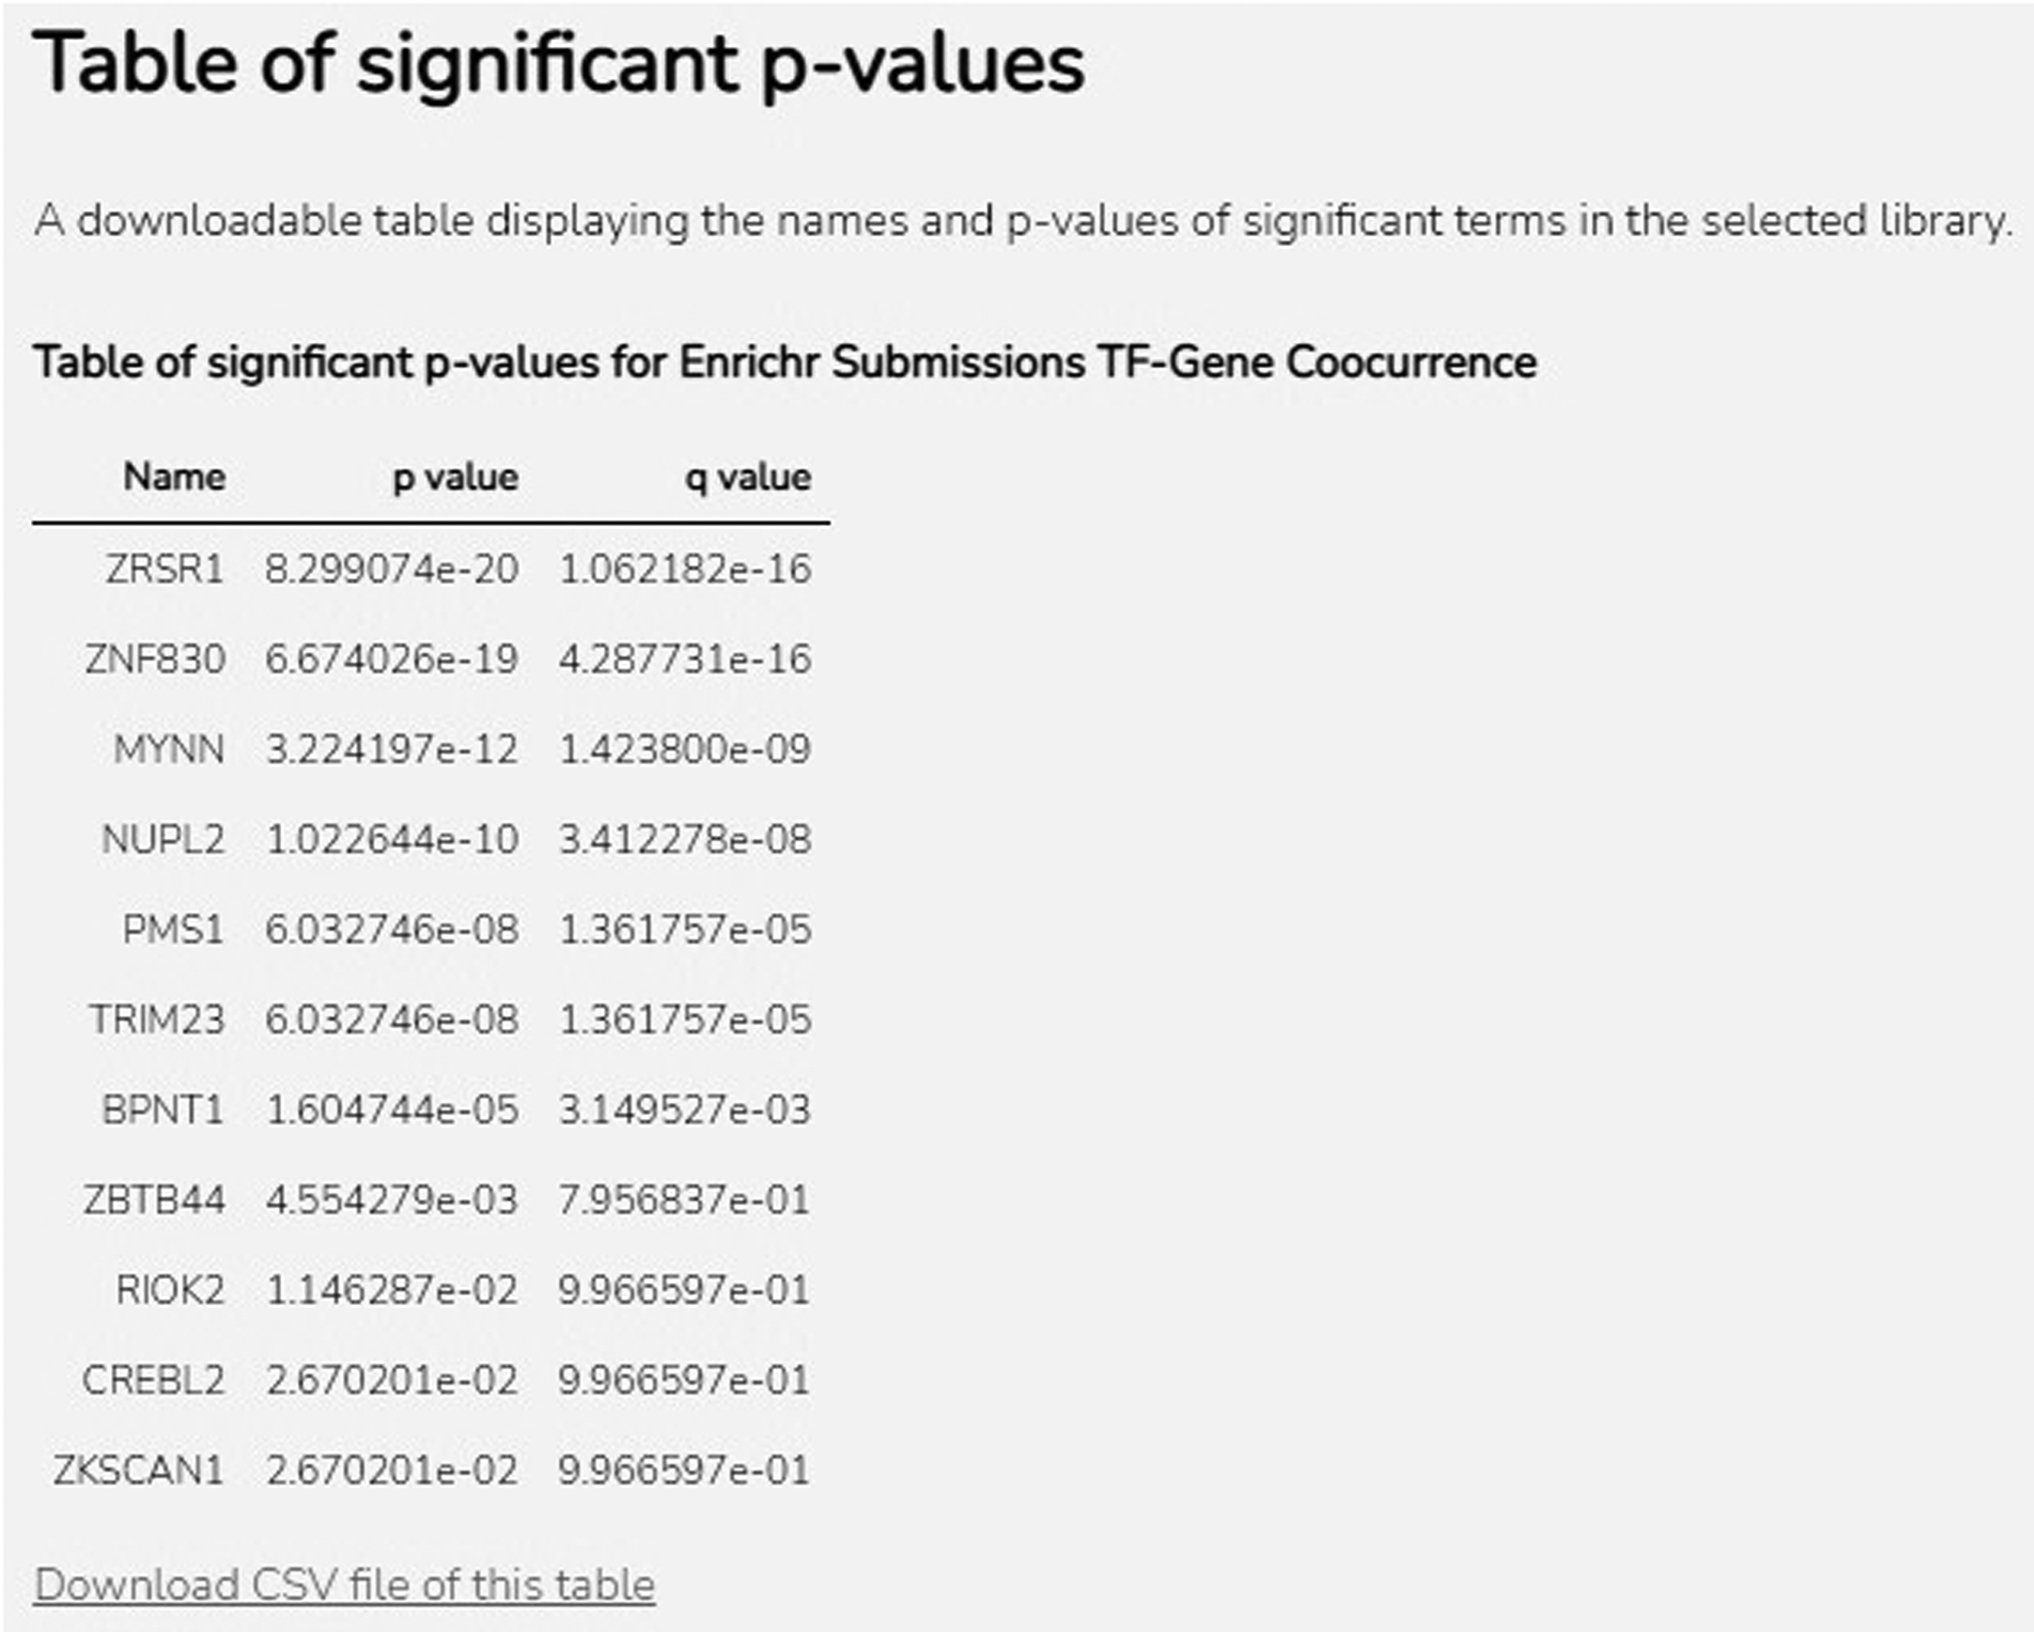
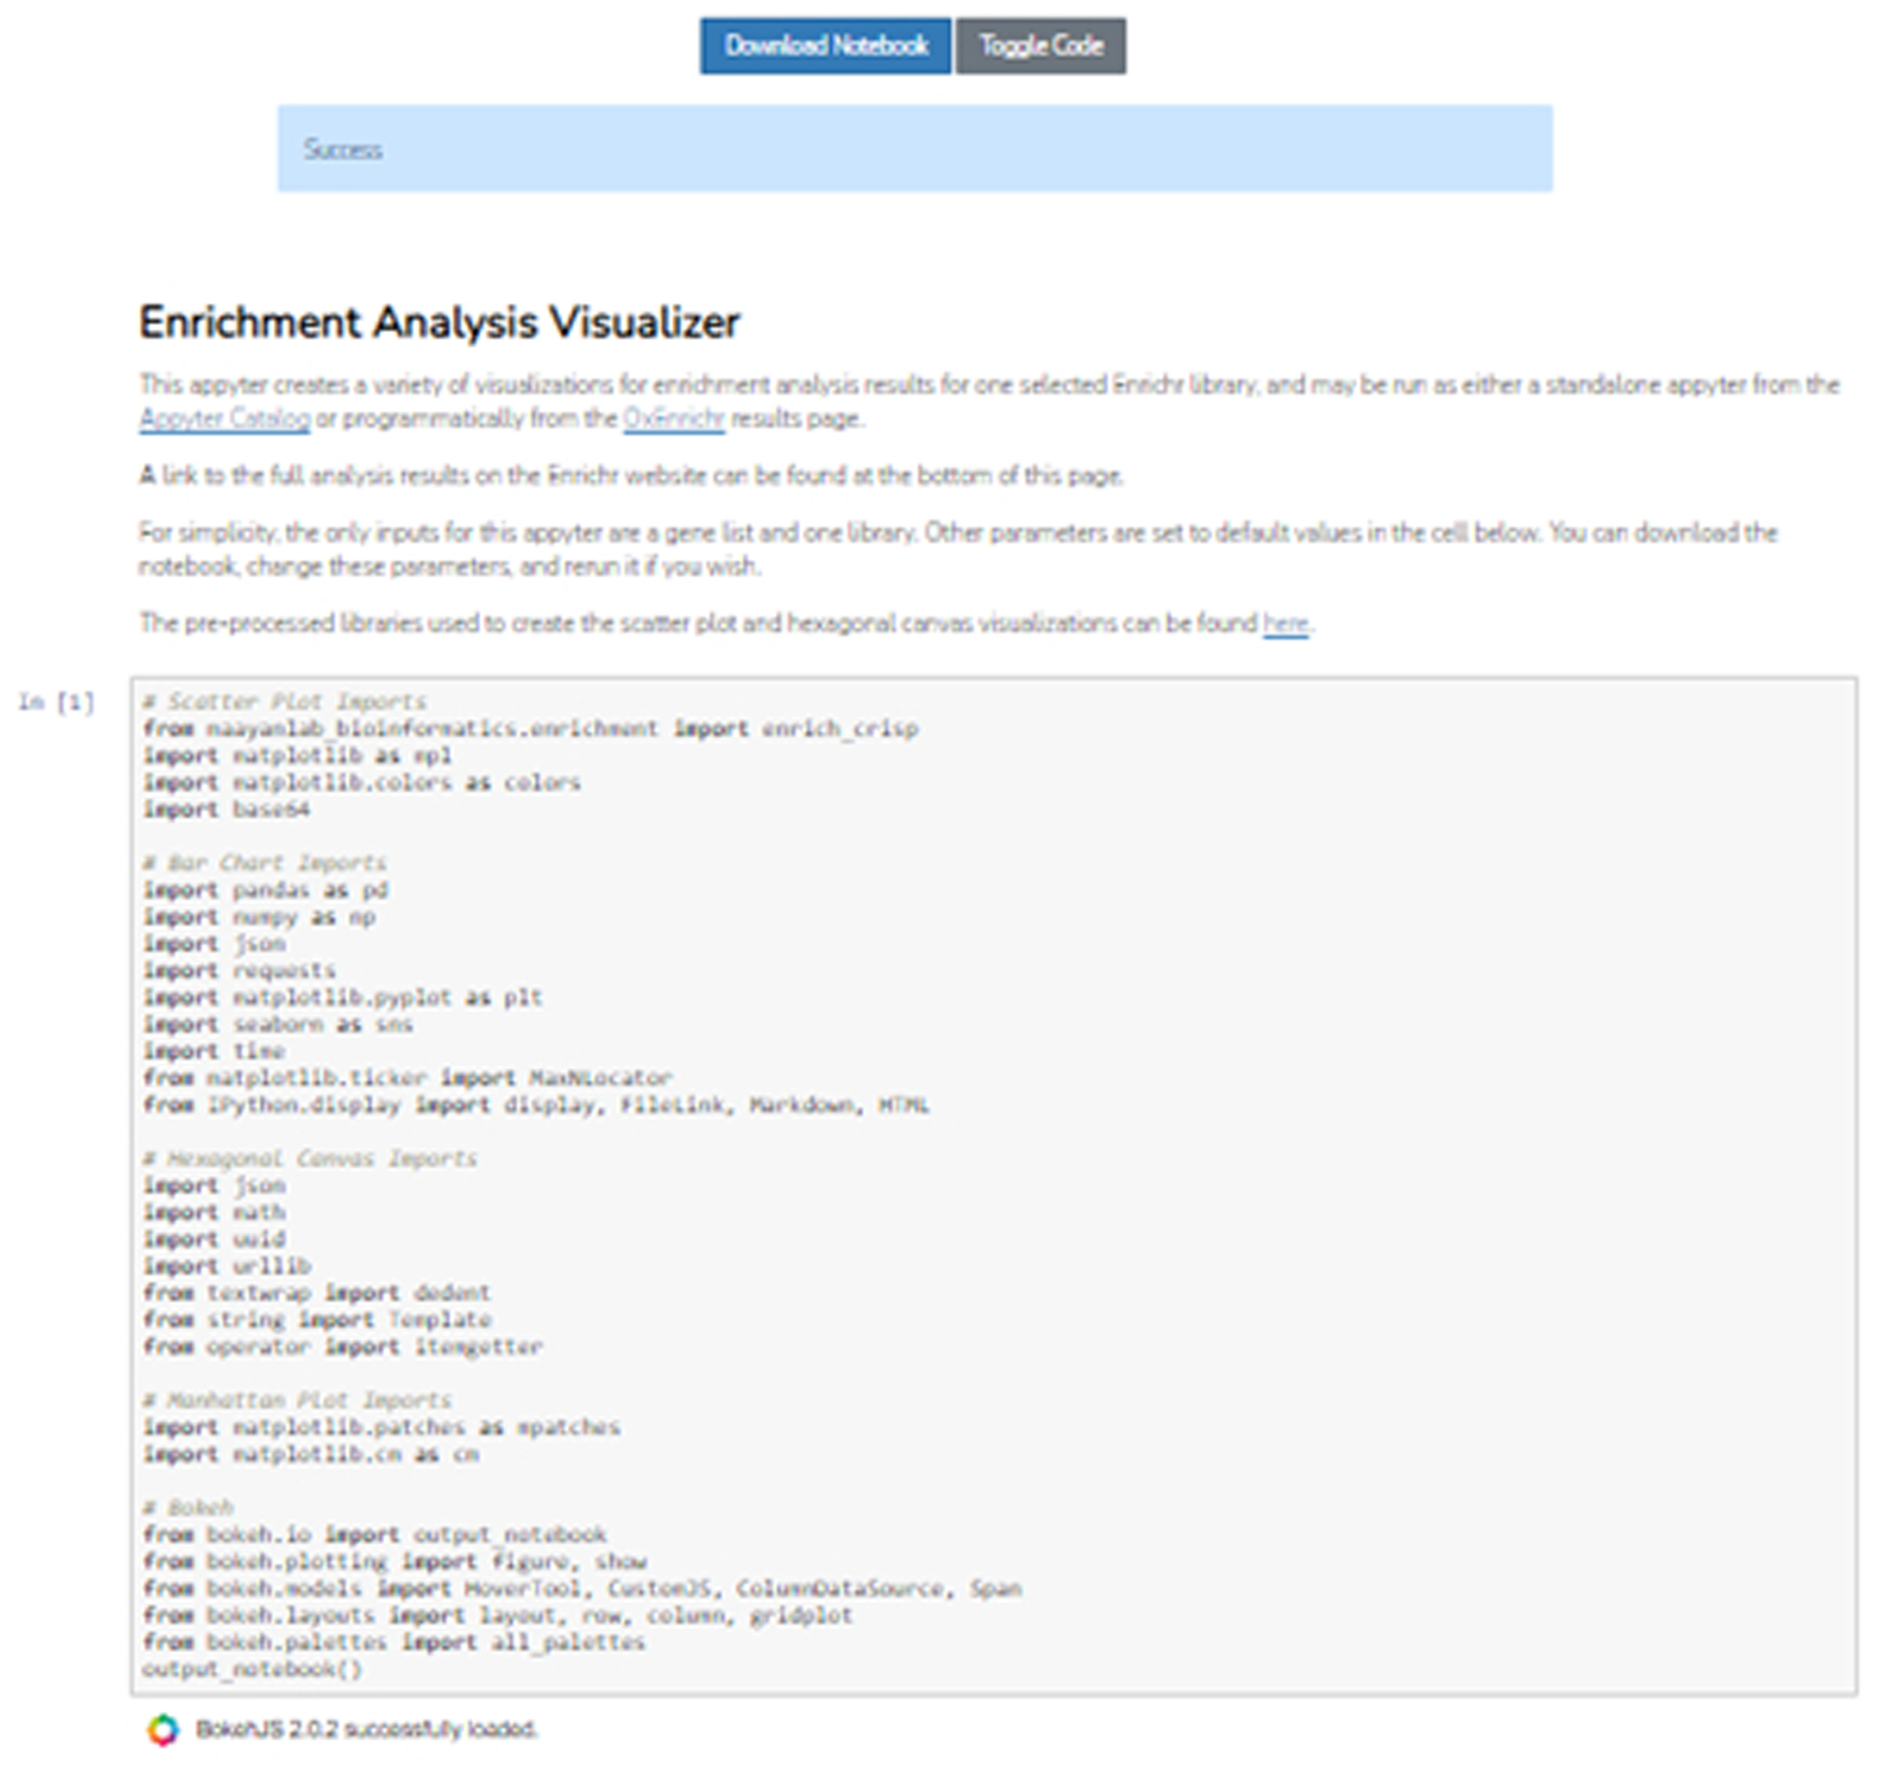
Profiling samples from patients, tissues, and cells with genomics, transcriptomics, epigenomics, proteomics, and metabolomics ultimately produces lists of genes and proteins that need to be further analyzed and integrated in the context of known biology. Enrichr (Chen et al., 2013; Kuleshov et al., 2016) is a gene set search engine that enables the querying of hundreds of thousands of annotated gene sets. Enrichr uniquely integrates knowledge from many high-profile projects to provide synthesized information about mammalian genes and gene sets. The platform provides various methods to compute gene set enrichment, and the results are visualized in several interactive ways. This protocol provides a summary of the key features of Enrichr, which include using Enrichr programmatically and embedding an Enrichr button on any website. © 2021 Wiley Periodicals LLC. Basic Protocol 1: Analyzing lists of differentially expressed genes from transcriptomics, proteomics and phosphoproteomics, GWAS studies, or other experimental studies Basic Protocol 2: Searching Enrichr by a single gene or key search term Basic Protocol 3: Preparing raw or processed RNA-seq data through BioJupies in preparation for Enrichr analysis Basic Protocol 4: Analyzing gene sets for model organisms using modEnrichr Basic Protocol 5: Using Enrichr in Geneshot Basic Protocol 6: Using Enrichr in ARCHS4 Basic Protocol 7: Using the enrichment analysis visualization Appyter to visualize Enrichr results Basic Protocol 8: Using the Enrichr API Basic Protocol 9: Adding an Enrichr button to a website.

Keywords: bioinformatics; disease; drug discovery; enrichment analysis; gene sets; visualization; web application.


Conflict of interest statement

CONFLICT OF INTEREST STATEMENT:

The authors declare no conflicts of interest.

Figures

Fig 1.
Fig 1.
Homepage of Enrichr. Users can upload a file with the “Choose file” button on the left, or by pasting a gene set list into the provided text box.
Fig. 2.
Fig. 2.
Registration page to create a new account with Enrichr.
Fig. 3.
Fig. 3.
Access a list of previously submitted gene lists by clicking your name in the top-right corner of any page. Additional actions to perform on your gene list are adjacent to each submitted list.
Fig. 4.
Fig. 4.
The Account Settings page lets users change personal information they want associated with their profile.
Fig. 5.
Fig. 5.
Enrichr homepage with pasted gene list in upload box. All genes are Entrez gene IDs with one gene on each row. A title for the gene list is written immediately below.
Fig 6.
Fig 6.
Results page. Users may explore varying categories by clicking through the options at the top of the page. Gene set libraries are listed in tiles, with more significant terms longer and in a brighter color.
Fig 7.
Fig 7.
Detailed analysis of top 10 enriched terms displayed as a bar graph, with “Bar Graph” highlighted as the selected visualization. This is the default visualization when first clicking on a library. By clicking the cog icon in the top-right of the bar graph visualization, you can access the color wheel shown bottom left to change graph colors.
Fig. 8.
Fig. 8.
The table visualization of an enrichment analysis. Columns can be sorted by clicking a column header.
Fig. 9.
Fig. 9.
The grid visualization of an enrichment analysis. In this visualization, the top 10 ranked terms are arranged by gene similarity with brighter terms more significant.
Fig. 10.
Fig. 10.
The network visualization of an enrichment analysis. Each node is a gene, and a link between nodes represents gene content similarity.
Fig. 11.
Fig. 11.
The clustergram visualization of an enrichment analysis. Alterations to the clustergram, such as graph size or ordering preference, can be executed using the modifiers on the right of the page. The column headers are the top 10 enriched terms; you can switch the ranking criteria to combined score, p-value, or z-score. A filled cell indicates that the input term and enriched term overlap. For example, we can see that input gene RPS21 overlaps with the enriched term ETS1.
Fig. 12.
Fig. 12.
Homepage of Enrichr with the “Gene search” option highlighted in red.
Fig. 13.
Fig. 13.
While entering our gene of interest, BRCA3, the auto-complete functionality lists available gene options.
Fig. 14.
Fig. 14.
Expanded search results for example gene of interest, BRCA3. Categories can be clicked to open an accordion menu, allowing access to different libraries. Associations or other relationships to the gene library are listed.
Fig. 15.
Fig. 15.
Homepage of Enrichr with the “Term search” option at top of the page highlighted in red.
Fig. 16.
Fig. 16.
Term search results for example metadata term “SARS”. The category accordion menu can be opened to explore gene set lists. The icons to download the gene set or view the Enrichr analysis are located next to the gene set name.
Fig. 17.
Fig. 17.
Portion of the BioJupies home page (https://amp.pharm.mssm.edu/biojupies/).
Fig. 18.
Fig. 18.
Users can use the buttons to either search and analyze a published dataset (left icon) or upload their own dataset (middle icon). You can also explore features of BioJupies without submitting a dataset by using example data (right icon).
Fig. 19.
Fig. 19.
GEO datasets can be searched by key term and filtered by organism type, publication date, and sample size. In this example, we can read more information on a mouse cancer study by accessing the drop-down.
Fig. 20.
Fig. 20.
By utilizing the various drop-down menus and the search bar, we can select numerous samples for each of our two labeled groups.
Fig. 21.
Fig. 21.
Upload a FASTQ file by clicking the “Choose Files” button and then uploading the files.
Fig. 22.
Fig. 22.
A successfully uploaded expression table file from our GEO dataset; the table is displayed in the middle of the page. Our dataset file was formatted with gene symbols as row identifiers and samples as column identifiers. Metadata should not be included in this file and will be classified in a later step.
Fig. 23.
Fig. 23.
The samples from our example GEO dataset are manually assigned to either the control or perturbation groups. The option to upload a metadata file is available by using the drop-zone.
Fig. 24.
Fig. 24.
The “Enrichr Links” option is added to our BioJupies notebook. By selecting “More Info”, we are able to see additional information on Enrichr links, what and how to interpret the displayed results, a reference to the tool, plus both an interactive example and video tutorial.
Fig. 25.
Fig. 25.
The “Predict Group” option is toggled on, commanding BioJupies to automatically assign each sample to one of two groups as specified near the top of the page. Clicking the drop-down on each row allows you to manually assign each sample.
Fig. 26.
Fig. 26.
After customizing the title of our notebook and adding biotags, browse through the additional parameter options to specify the results of your analyses. For Enrichr links, both the gene set size and gene sort method can be modified.
Fig. 27.
Fig. 27.
The completed notebook can be opened a multitude of ways: clicking the notebook title name, clicking the “Open Notebook” button, or by clicking the thumbnail. Options to share the notebook or create a new notebook are also available at this point.
Fig. 28.
Fig. 28.
The newly-generated BioJupies notebook includes an introduction, table of contents, and the user-selected analyses sequentially listed. To access the Enrichr Links in this example, click the link presented in option 5 in the table of contents, or scroll down until you see the analyses.
Fig. 29.
Fig. 29.
The Enrichr links are broken down into differentially expressed up-regulated or down-regulated genes. Clicking the link brings the gene sets to Enrichr.
Fig. 30.
Fig. 30.
Homepage of modEnrichr. The various model organism enrichment analysis tools listed on the right are clickable and will bring you straight to their respective homepage.
Fig. 31.
Fig. 31.
An unknown gene list was inputted into the text field. modEnrichr automatically detects the organism is C. elegans and generates a link to bring the user and their gene list to WormEnrichr.
Fig. 32.
Fig. 32.
An example H. sapiens/M. musculus gene list has been converted to its D. rerio orthologs. The tool informs the user that 116 of 375 genes were successfully converted. The gene list can be sent to FlyEnrichr by clicking the auto-generated link.
Fig. 33.
Fig. 33.
The homepage for Geneshot.
Fig. 34.
Fig. 34.
Enter a search term you wish to explore in the first text box, and an optional term in the second text box you wish not be included into your query. In this demonstration, “coronavirus” will be searched but will not include any publications that also mention “MERS-CoV”. The number of top associated genes and choice of either GeneRIF or AutoRIF lies on the right-hand side.
Fig. 35.
Fig. 35.
A link to the Geneshot results page is printed at the top. Continuing our search of “coronavirus NOT MERS- CoV”, a scatterplot generates genes related to the search term via publications. Clicking an individual data point brings up the gene name and additional information. “PPP1CA” is mentioned in 224 publications with the term coronavirus but not MERS-CoV, and has a normalized fraction of 0.156; that means out of all publications that mention the gene PPP1CA, 15.6% also mention coronavirus (but not MERS-CoV). The option to display either the histogram or cumulative distribution plot are on the right-hand side.
Fig. 36.
Fig. 36.
The option to modify the associate genes and predicted genes tables is located immediately below the scatterplot in a light-blue box. Following are six buttons used to filter the table results by gene family categories. The plot on the left displays a ranked list of genes associated by publications, and the table on the right displays a ranked list of genes associated by gene similarity using a specified co-occurrence matrix. Buttons to import the results into Enrichr or download the gene list are located below the tables.
Fig. 37.
Fig. 37.
The homepage of ARCHS4.
Fig. 38.
Fig. 38.
The data search page of ARCHS4. For this example, the species selected is human and we are searching for metadata by selecting “Sample”.
Fig. 39.
Fig. 39.
The “Gene” button in the top-right corner of the page must be selected. Choose between either human or mouse depending on your species of interest.
Fig. 40.
Fig. 40.
This example demonstrates how to search for the “BRCA1” gene. Insert the gene ID into the top-right textbox under the “Search gene by symbol” header.
Fig. 41.
Fig. 41.
Detailed description page – in this example, for “BRCA1”. A list of genes most similar to the gene of interest based on co-expression is located lower on the page. Click the Enrichr icon on the right to send the gene list to Enrichr.
Fig. 42.
Fig. 42.
Users first need to select a gene set library from five different options. To find a gene set, the user may search using the search bar, or browse through the listed options.
Fig. 43.
Fig. 43.
In this demonstration, the gene set is illuminated in yellow in the t-SNE plot. The color can be changed using the left-most drop-down menu. 1514 genes exist in the set and can be viewed if clicked. Click the Enrichr icon to import the gene set list to Enrichr, or you may choose to download the gene set using the download icon.
Fig. 44.
Fig. 44.
The Appyter launch screen from Enrichr.Appyter is launched upon clicking the red button in the middle of the page.
Fig. 45.
Fig. 45.
The execution page of the Enrichment Analysis Visualization Appyter when it is first opened programmatically from Enrichr. The blue status box may tell the user their position in the execution queue.
Fig. 46.
Fig. 46.
The Appyter during execution of the notebook, as indicated by the blue status box at the top. Outputs will appear in the notebook as the execution progresses.
Fig. 47.
Fig. 47.
The Appyter after all code has been successfully executed, as indicated by the blue status box.
Fig. 48.
Fig. 48.
The scatter plot visualization. Each point is a term from the selected library, clustered by similarity, with large blue points being significantly enriched terms. The toolbar on the right can be used to navigate or download the plot.
Fig. 49.
Fig. 49.
The bar chart visualization. The title of the chart is the selected library. Each bar is ordered by rank and labeled with the name of the term it represents from the library and the corresponding p-value. Blue-colored bars indicate significantly enriched terms. Links for download are below the chart.
Fig. 50.
Fig. 50.
The hexagonal canvas plot. Each hexagon represents a gene set, with brighter colors indicating higher similarity to the input gene list. Similar gene sets are clustered together.
Fig. 51.
Fig. 51.
The Manhattan plot. Each point gives the −log(p-value) (y-axis) of a single gene set (x-axis) in the library. The toolbar on the right can be used to navigate or download the plot.
Fig. 52.
Fig. 52.
The volcano plot. Each point represents a gene set, with the x-position being the odds ratio and the y-position being the −log(p-value). The toolbar on the right can be used to navigate or download the plot.
Fig. 53.
Fig. 53.
Table displaying all significantly enriched terms, as well as corresponding p-values and q-values for the selected library. A download link is available as well.
Fig 54.
Fig 54.
The code used to execute the commands of the Appyter are displayed when the “Toggle Code” button is selected. To hide the code, click the button again.

References

LITERATURE CITED:

    1. Al-Shahrour F, Minguez P, Tárraga J, Montaner D, Alloza E, Vaquerizas JM, Conde L, Blaschke C, Vera J, & Dopazo J (2006). BABELOMICS: a systems biology perspective in the functional annotation of genome-scale experiments. Nucleic acids research, 34(suppl_2), W472–W476. - PMC - PubMed
    1. Bahcall OG (2015). GTEx pilot quantifies eQTL variation across tissues and individuals. Nature Reviews Genetics, 16(7), 375–375. - PubMed
    1. Bostock M, Ogievetsky V, & Heer J (2011). D3 data-driven documents. IEEE transactions on visualization and computer graphics, 17(12), 2301–2309. - PubMed
    1. Chen EY, Tan CM, Kou Y, Duan Q, Wang Z, Meirelles GV, Clark NR, & Ma’ayan A (2013, April 15). Enrichr: interactive and collaborative HTML5 gene list enrichment analysis tool. BMC bioinformatics, 14, 128. 10.1186/1471-2105-14-128 - DOI - PMC - PubMed
    1. Chen J, Bardes EE, Aronow BJ, & Jegga AG (2009). ToppGene Suite for gene list enrichment analysis and candidate gene prioritization. Nucleic acids research, 37(suppl_2), W305–W311. - PMC - PubMed

KEY REFERENCES:

    1. Chen EY, Tan CM, Kou Y, Duan Q, Wang Z, Meirelles GV, Clark NR, & Ma’ayan A (2013). Enrichr: interactive and collaborative HTML5 gene list enrichment analysis tool. BMC bioinformatics, 14, 128. 10.1186/1471-2105-14-128. - DOI - PMC - PubMed
    1. Clarke DJB, Jeon M, Stein DJ, Moiseyev N, Kropiwnicki E, Dai C, Xie Z, Wojciechowicz ML, Litz S, Hom J, Evangelista JE, Goldman L, Zhang S, Yoon C, Ahamed T, Bhuiyan S, Cheng M, Karam J, Jagodnik JM, Shu I, Lachmann A, Ayling S, Jenkins SL, Ma’ayan A (2021). Appyters: Turning Jupyter Notebooks into Data Driven Web Apps. Patterns (Accepted). - PMC - PubMed
    1. Kuleshov MV, Diaz JE, Flamholz ZN, Keenan AB, Lachmann A, Wojciechowicz ML, Cagan RL, & Ma’ayan A (2019). modEnrichr: a suite of gene set enrichment analysis tools for model organisms. Nucleic acids research, 47(W1), W183–W190. - PMC - PubMed
    1. Kuleshov MV, Jones MR, Rouillard AD, Fernandez NF, Duan Q, Wang Z, Koplev S, Jenkins SL, Jagodnik KM, Lachmann A, McDermott MG, Monteiro CD, Gundersen GW, & Ma’ayan A (2016). Enrichr: a comprehensive gene set enrichment analysis web server 2016 update. Nucleic Acids Res, 44(W1), W90–97. 10.1093/nar/gkw377 - DOI - PMC - PubMed
    1. Lachmann A, Schilder BM, Wojciechowicz ML, Torre D, Kuleshov MV, Keenan AB, & Ma’ayan A (2019). Geneshot: search engine for ranking genes from arbitrary text queries. Nucleic acids research, 47(W1), W571–W577. - PMC - PubMed