Reconstruction of ARNT PAS-B Unfolding Pathways by Steered Molecular Dynamics and Artificial Neural Networks
- PMID: 33780250
- PMCID: PMC8047803
- DOI: 10.1021/acs.jctc.0c01308
Reconstruction of ARNT PAS-B Unfolding Pathways by Steered Molecular Dynamics and Artificial Neural Networks
Abstract
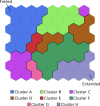
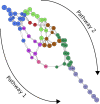
Several experimental studies indicated that large conformational changes, including partial domain unfolding, have a role in the functional mechanisms of the basic helix loop helix Per/ARNT/SIM (bHLH-PAS) transcription factors. Recently, single-molecule atomic force microscopy (AFM) revealed two distinct pathways for the mechanical unfolding of the ARNT PAS-B. In this work we used steered molecular dynamics simulations to gain new insights into this process at an atomistic level. To reconstruct and classify pathways sampled in multiple simulations, we designed an original approach based on the use of self-organizing maps (SOMs). This led us to identify two types of unfolding pathways for the ARNT PAS-B, which are in good agreement with the AFM findings. Analysis of average forces mapped on the SOM revealed a stable conformation of the PAS-B along one pathway, which represents a possible structural model for the intermediate state detected by AFM. The approach here proposed will facilitate the study of other signal transmission mechanisms involving the folding/unfolding of PAS domains.
Conflict of interest statement
The authors declare no competing financial interest.
Figures


Similar articles
-
Ligand-induced perturbation of the HIF-2α:ARNT dimer dynamics.PLoS Comput Biol. 2018 Feb 28;14(2):e1006021. doi: 10.1371/journal.pcbi.1006021. eCollection 2018 Feb. PLoS Comput Biol. 2018. PMID: 29489822 Free PMC article.
-
Single-molecule experiments reveal the flexibility of a Per-ARNT-Sim domain and the kinetic partitioning in the unfolding pathway under force.Biophys J. 2012 May 2;102(9):2149-57. doi: 10.1016/j.bpj.2012.03.042. Biophys J. 2012. PMID: 22824279 Free PMC article.
-
Single-molecule detection of structural changes during Per-Arnt-Sim (PAS) domain activation.Proc Natl Acad Sci U S A. 2006 Aug 1;103(31):11561-6. doi: 10.1073/pnas.0601567103. Epub 2006 Jul 19. Proc Natl Acad Sci U S A. 2006. PMID: 16855050 Free PMC article.
-
Per-ARNT-Sim (PAS) Domains in Basic Helix-Loop-Helix (bHLH)-PAS Transcription Factors and Coactivators: Structures and Mechanisms.J Mol Biol. 2024 Feb 1;436(3):168370. doi: 10.1016/j.jmb.2023.168370. Epub 2023 Nov 20. J Mol Biol. 2024. PMID: 37992889 Free PMC article. Review.
-
Structural characterization of mammalian bHLH-PAS transcription factors.Curr Opin Struct Biol. 2017 Apr;43:1-9. doi: 10.1016/j.sbi.2016.09.011. Epub 2016 Oct 6. Curr Opin Struct Biol. 2017. PMID: 27721191 Free PMC article. Review.
Cited by
-
Nutrient Signaling-Dependent Quaternary Structure Remodeling Drives the Catalytic Activation of metazoan PASK.bioRxiv [Preprint]. 2024 Jun 28:2024.06.28.599394. doi: 10.1101/2024.06.28.599394. bioRxiv. 2024. PMID: 38979257 Free PMC article. Preprint.
-
Free energy and kinetic rate calculation via non-equilibrium molecular simulation: application to biomolecules.Biophys Rev. 2022 Dec 29;14(6):1303-1314. doi: 10.1007/s12551-022-01036-3. eCollection 2022 Dec. Biophys Rev. 2022. PMID: 36659997 Free PMC article. Review.
-
Recognizing the Binding Pattern and Dissociation Pathways of the p300 Taz2-p53 TAD2 Complex.JACS Au. 2022 Aug 3;2(8):1935-1945. doi: 10.1021/jacsau.2c00358. eCollection 2022 Aug 22. JACS Au. 2022. PMID: 36032526 Free PMC article.
-
Molecular Dynamics for the Optimal Design of Functionalized Nanodevices to Target Folate Receptors on Tumor Cells.ACS Biomater Sci Eng. 2023 Nov 13;9(11):6123-6137. doi: 10.1021/acsbiomaterials.3c00942. Epub 2023 Oct 13. ACS Biomater Sci Eng. 2023. PMID: 37831005 Free PMC article.
-
TCDD-Induced Allosteric Perturbation of the AhR:ARNT Binding to DNA.Int J Mol Sci. 2023 May 26;24(11):9339. doi: 10.3390/ijms24119339. Int J Mol Sci. 2023. PMID: 37298290 Free PMC article.
References
MeSH terms
Substances
LinkOut - more resources
Full Text Sources
Other Literature Sources
Miscellaneous

