

Spatial Inequities in COVID-19 Testing, Positivity, Confirmed Cases, and Mortality in 3 U.S. Cities : An Ecological Study
- PMID: 33780289
- PMCID: PMC8029592
- DOI: 10.7326/M20-3936
Spatial Inequities in COVID-19 Testing, Positivity, Confirmed Cases, and Mortality in 3 U.S. Cities : An Ecological Study
Abstract
Background: Preliminary evidence has shown inequities in coronavirus disease 2019 (COVID-19)-related cases and deaths in the United States.
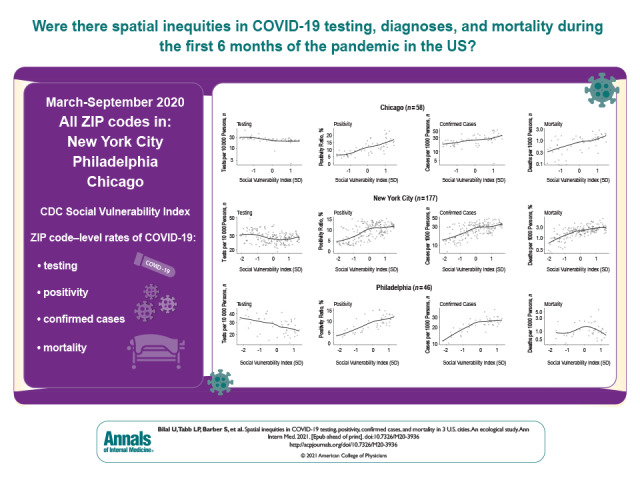
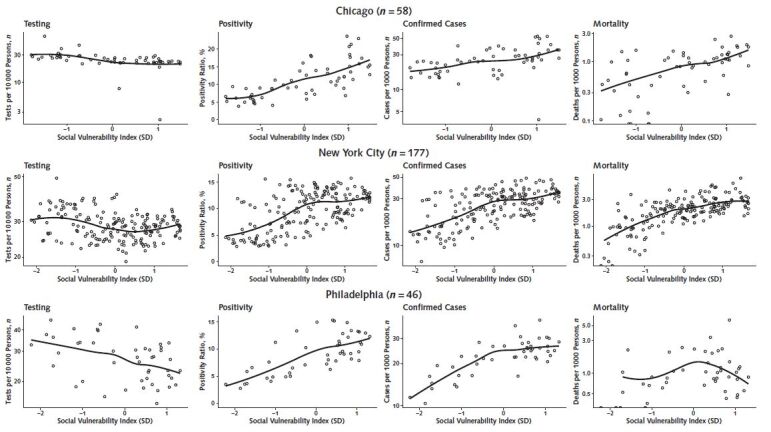
Objective: To explore the emergence of spatial inequities in COVID-19 testing, positivity, confirmed cases, and mortality in New York, Philadelphia, and Chicago during the first 6 months of the pandemic.
Design: Ecological, observational study at the ZIP code tabulation area (ZCTA) level from March to September 2020.
Setting: Chicago, New York, and Philadelphia.
Participants: All populated ZCTAs in the 3 cities.
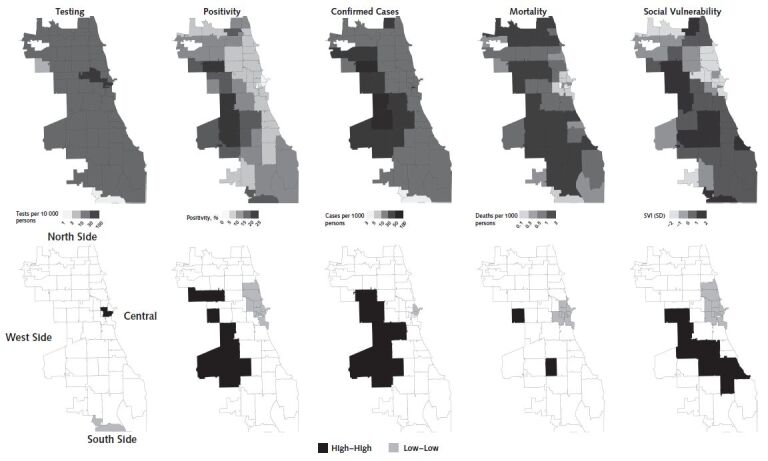
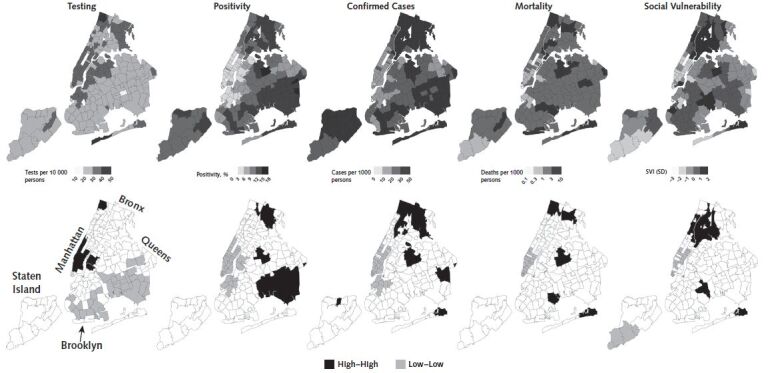
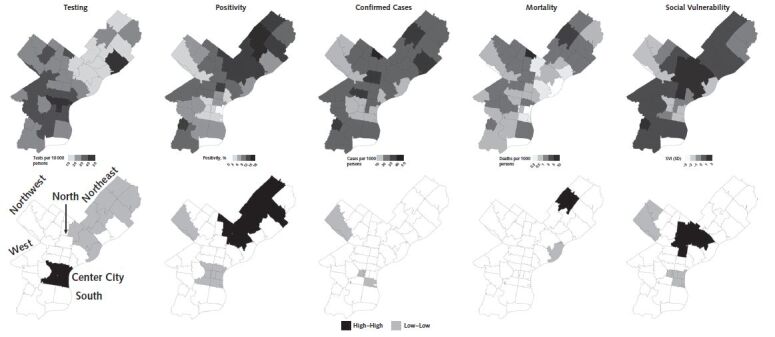
Measurements: Outcomes were ZCTA-level COVID-19 testing, positivity, confirmed cases, and mortality cumulatively through the end of September 2020. Predictors were the Centers for Disease Control and Prevention Social Vulnerability Index and its 4 domains, obtained from the 2014-2018 American Community Survey. The spatial autocorrelation of COVID-19 outcomes was examined by using global and local Moran I statistics, and estimated associations were examined by using spatial conditional autoregressive negative binomial models.
Results: Spatial clusters of high and low positivity, confirmed cases, and mortality were found, co-located with clusters of low and high social vulnerability in the 3 cities. Evidence was also found for spatial inequities in testing, positivity, confirmed cases, and mortality. Specifically, neighborhoods with higher social vulnerability had lower testing rates and higher positivity ratios, confirmed case rates, and mortality rates.
Limitations: The ZCTAs are imperfect and heterogeneous geographic units of analysis. Surveillance data were used, which may be incomplete.
Conclusion: Spatial inequities exist in COVID-19 testing, positivity, confirmed cases, and mortality in 3 large U.S. cities.
Primary funding source: National Institutes of Health.
Conflict of interest statement
Figures
Comment in
-
Injustice in Health: Now Is the Time to Change the Story.Ann Intern Med. 2021 Jul;174(7):1012-1013. doi: 10.7326/M21-1279. Epub 2021 Mar 30. Ann Intern Med. 2021. PMID: 33780292 Free PMC article.
References
-
- New York City Department of Health and Mental Hygiene. COVID-19: data. Accessed at www1.nyc.gov/site/doh/covid/covid-19-data.page on 15 December 2020.
-
- Eldeib D, Gallardo A, Johnson A, et al. The First 100. COVID-19 took black lives first. it didn't have to. ProPublica. 9 May 2020. Accessed at https://features.propublica.org/chicago-first-deaths/covid-coronavirus-t... on 18 May 2020.
-
- Philadelphia Department of Public Health. COVID-19 testing and data. Accessed at www.phila.gov/programs/coronavirus-disease-2019-covid-19/testing-and-data on 8 December 2020.
Publication types
MeSH terms
Grants and funding
LinkOut - more resources
Full Text Sources
Other Literature Sources
Medical