

Disparate temperature-dependent virus-host dynamics for SARS-CoV-2 and SARS-CoV in the human respiratory epithelium
- PMID: 33780434
- PMCID: PMC8032198
- DOI: 10.1371/journal.pbio.3001158
Disparate temperature-dependent virus-host dynamics for SARS-CoV-2 and SARS-CoV in the human respiratory epithelium
Abstract
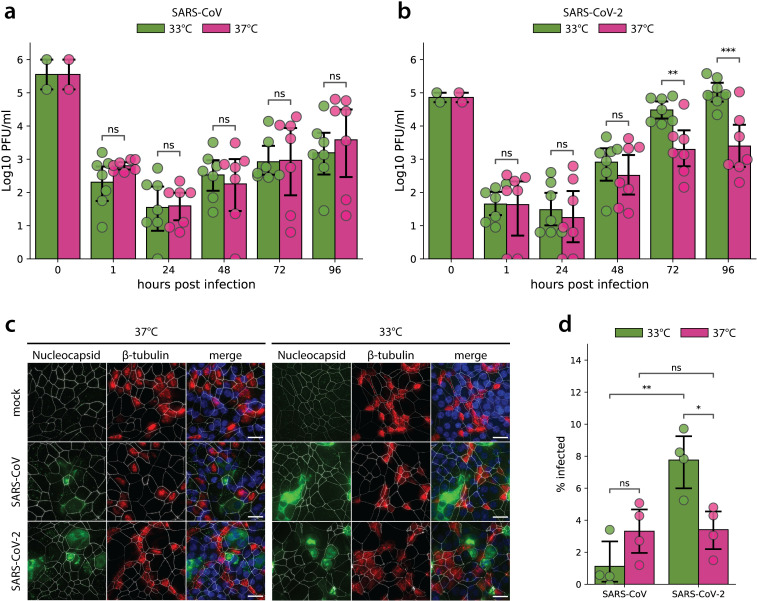
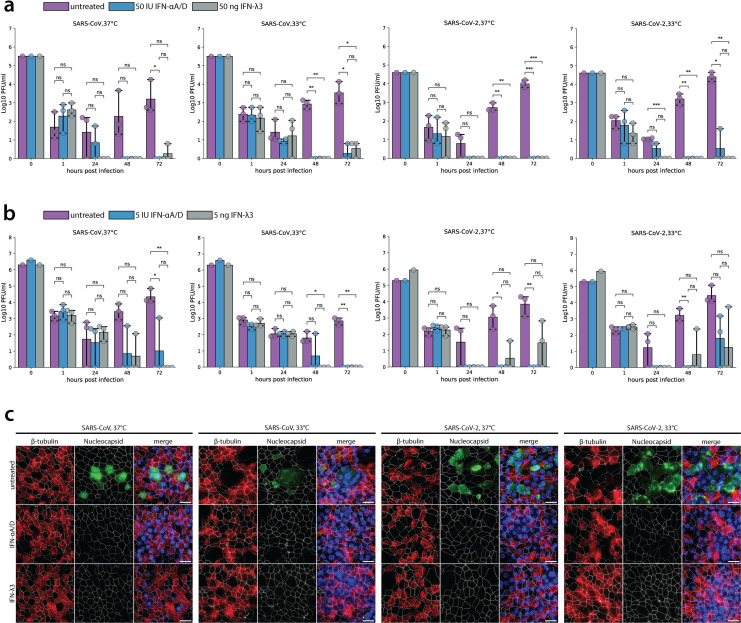
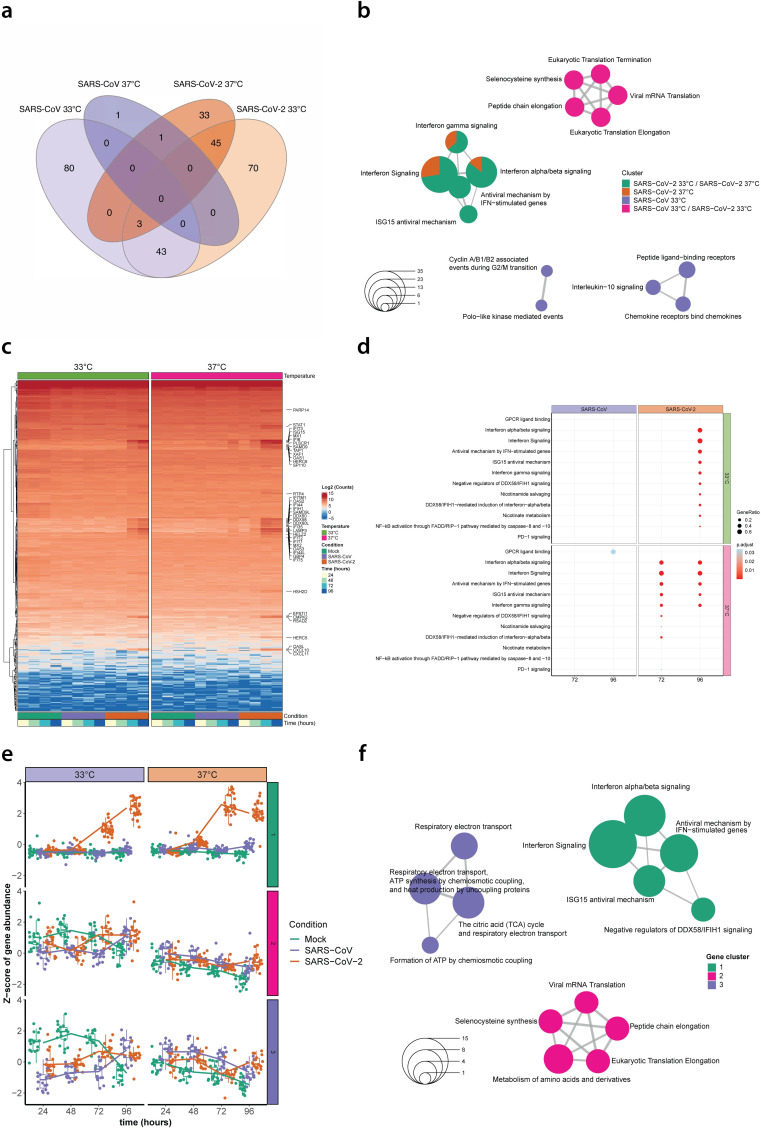
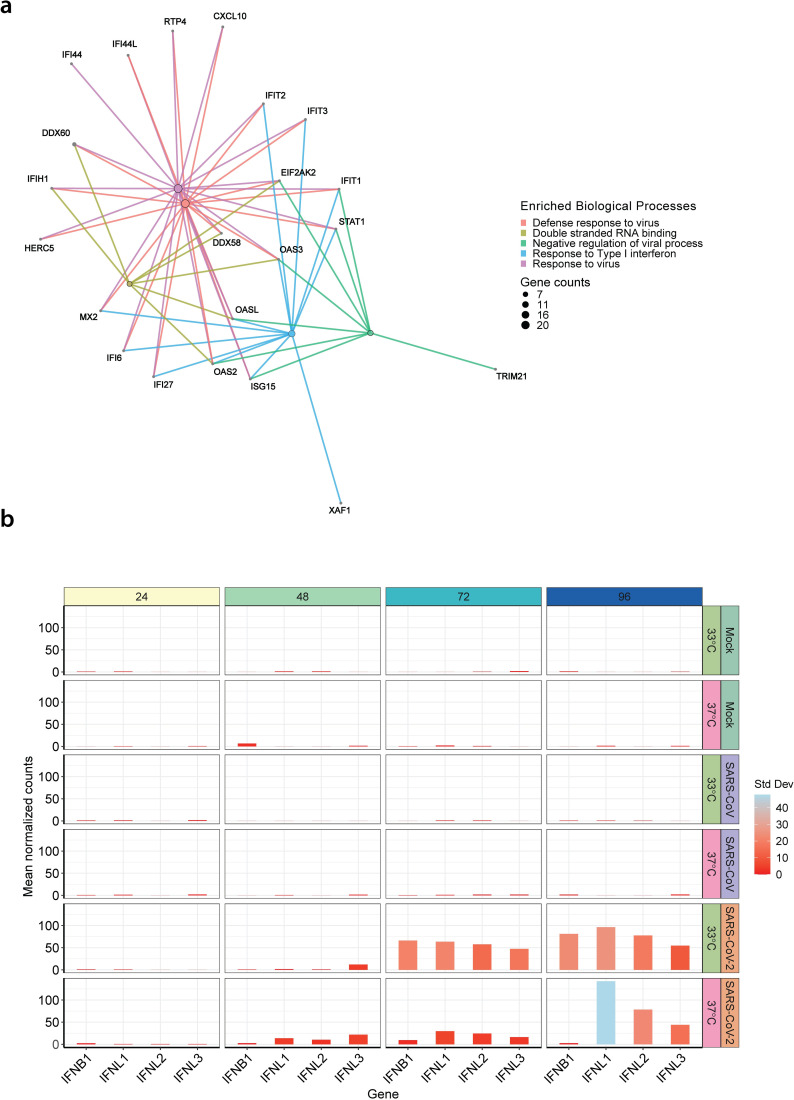
Since its emergence in December 2019, Severe Acute Respiratory Syndrome Coronavirus 2 (SARS-CoV-2) has spread globally and become a major public health burden. Despite its close phylogenetic relationship to SARS-CoV, SARS-CoV-2 exhibits increased human-to-human transmission dynamics, likely due to efficient early replication in the upper respiratory epithelium of infected individuals. Since different temperatures encountered in the human upper and lower respiratory tract (33°C and 37°C, respectively) have been shown to affect the replication kinetics of several respiratory viruses, as well as host innate immune response dynamics, we investigated the impact of temperature on SARS-CoV-2 and SARS-CoV infection using the primary human airway epithelial cell culture model. SARS-CoV-2, in contrast to SARS-CoV, replicated to higher titers when infections were performed at 33°C rather than 37°C. Although both viruses were highly sensitive to type I and type III interferon pretreatment, a detailed time-resolved transcriptome analysis revealed temperature-dependent interferon and pro-inflammatory responses induced by SARS-CoV-2 that were inversely proportional to its replication efficiency at 33°C or 37°C. These data provide crucial insight on pivotal virus-host interaction dynamics and are in line with characteristic clinical features of SARS-CoV-2 and SARS-CoV, as well as their respective transmission efficiencies.
Conflict of interest statement
The authors have declared that no competing interests exist.
Figures
Similar articles
-
Elevated temperature inhibits SARS-CoV-2 replication in respiratory epithelium independently of IFN-mediated innate immune defenses.PLoS Biol. 2021 Dec 21;19(12):e3001065. doi: 10.1371/journal.pbio.3001065. eCollection 2021 Dec. PLoS Biol. 2021. PMID: 34932557 Free PMC article.
-
Antiviral Activity of Type I, II, and III Interferons Counterbalances ACE2 Inducibility and Restricts SARS-CoV-2.mBio. 2020 Sep 10;11(5):e01928-20. doi: 10.1128/mBio.01928-20. mBio. 2020. PMID: 32913009 Free PMC article.
-
SARS-CoV replication and pathogenesis in an in vitro model of the human conducting airway epithelium.Virus Res. 2008 Apr;133(1):33-44. doi: 10.1016/j.virusres.2007.03.013. Epub 2007 Apr 23. Virus Res. 2008. PMID: 17451829 Free PMC article. Review.
-
Cannabidiol inhibits SARS-CoV-2 replication through induction of the host ER stress and innate immune responses.Sci Adv. 2022 Feb 25;8(8):eabi6110. doi: 10.1126/sciadv.abi6110. Epub 2022 Feb 23. Sci Adv. 2022. PMID: 35050692 Free PMC article.
-
SARS-CoV-2 multifaceted interaction with human host. Part I: What we have learnt and done so far, and the still unknown realities.IUBMB Life. 2020 Nov;72(11):2313-2330. doi: 10.1002/iub.2380. Epub 2020 Sep 12. IUBMB Life. 2020. PMID: 32918855 Review.
Cited by
-
Time-resolved characterization of the innate immune response in the respiratory epithelium of human, porcine, and bovine during influenza virus infection.Front Immunol. 2022 Aug 19;13:970325. doi: 10.3389/fimmu.2022.970325. eCollection 2022. Front Immunol. 2022. PMID: 36059535 Free PMC article.
-
Possible effects of air temperature on COVID-19 disease severity and transmission rates.J Med Virol. 2021 Sep;93(9):5358-5366. doi: 10.1002/jmv.27042. Epub 2021 May 3. J Med Virol. 2021. PMID: 33913555 Free PMC article.
-
Susceptibility of Well-Differentiated Airway Epithelial Cell Cultures from Domestic and Wild Animals to Severe Acute Respiratory Syndrome Coronavirus 2.Emerg Infect Dis. 2021 Jul;27(7):1811-1820. doi: 10.3201/eid2707.204660. Emerg Infect Dis. 2021. PMID: 34152956 Free PMC article.
-
Understanding Post Entry Sorting of Adenovirus Capsids; A Chance to Change Vaccine Vector Properties.Viruses. 2021 Jun 24;13(7):1221. doi: 10.3390/v13071221. Viruses. 2021. PMID: 34202573 Free PMC article. Review.
-
A Review of Pathology and Analysis of Approaches to Easing Kidney Disease Impact: Host-Pathogen Communication and Biomedical Visualization Perspective : Advanced Microscopy and Visualization of Host-Pathogen Communication.Adv Exp Med Biol. 2023;1406:41-57. doi: 10.1007/978-3-031-26462-7_3. Adv Exp Med Biol. 2023. PMID: 37016110 Review.
References
-
- WHO Coronavirus Disease (COVID-19) Dashboard | WHO Coronavirus Disease (COVID-19) Dashboard. [cited 2021 Jan 13]. Available from: https://covid19.who.int/.
-
- WHO | Summary of probable SARS cases with onset of illness from 1 November 2002 to 31 July 2003. [cited 2020 Mar 23]. Available from: https://www.who.int/csr/sars/country/table2004_04_21/en/.
Publication types
MeSH terms
Substances
LinkOut - more resources
Full Text Sources
Other Literature Sources
Molecular Biology Databases
Miscellaneous
