

Modeling the spatial distribution of anthrax in southern Kenya
- PMID: 33780459
- PMCID: PMC8032196
- DOI: 10.1371/journal.pntd.0009301
Modeling the spatial distribution of anthrax in southern Kenya
Abstract
Background: Anthrax is an important zoonotic disease in Kenya associated with high animal and public health burden and widespread socio-economic impacts. The disease occurs in sporadic outbreaks that involve livestock, wildlife, and humans, but knowledge on factors that affect the geographic distribution of these outbreaks is limited, challenging public health intervention planning.
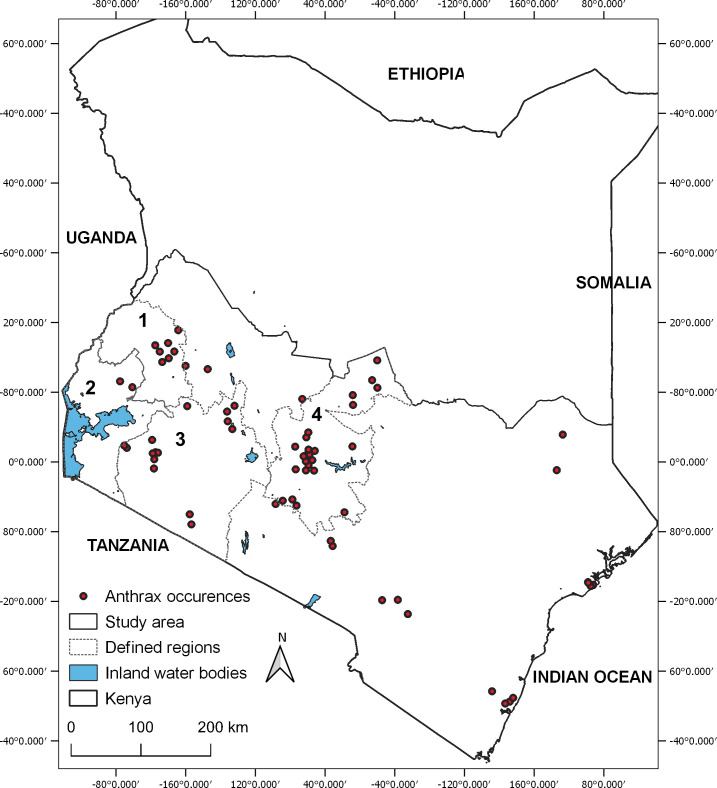
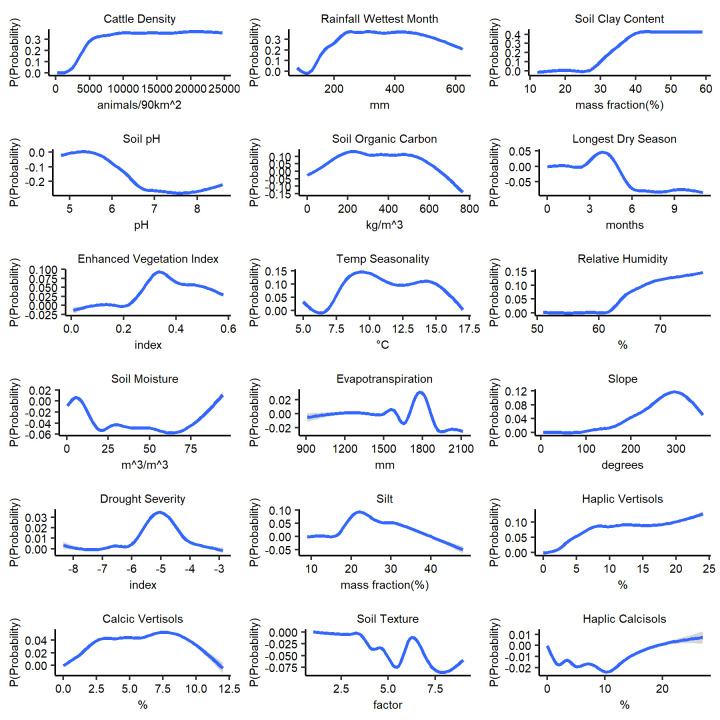
Methods: Anthrax surveillance data reported in southern Kenya from 2011 to 2017 were modeled using a boosted regression trees (BRT) framework. An ensemble of 100 BRT experiments was developed using a variable set of 18 environmental covariates and 69 unique anthrax locations. Model performance was evaluated using AUC (area under the curve) ROC (receiver operating characteristics) curves.
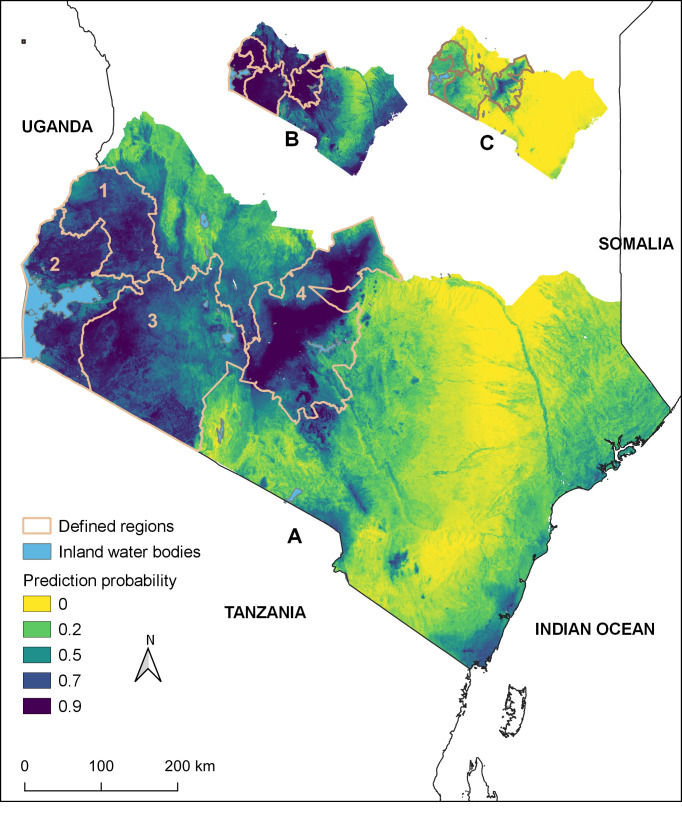
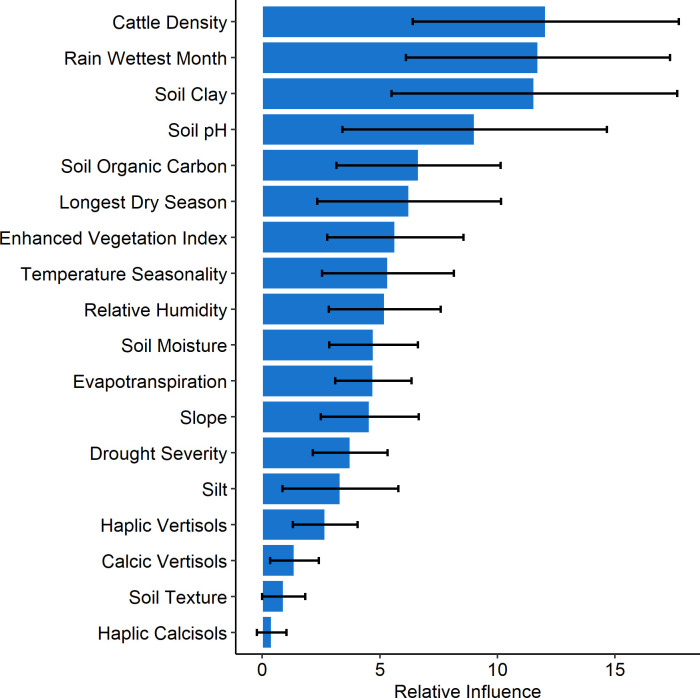
Results: Cattle density, rainfall of wettest month, soil clay content, soil pH, soil organic carbon, length of longest dry season, vegetation index, temperature seasonality, in order, were identified as key variables for predicting environmental suitability for anthrax in the region. BRTs performed well with a mean AUC of 0.8. Areas highly suitable for anthrax were predicted predominantly in the southwestern region around the shared Kenya-Tanzania border and a belt through the regions and highlands in central Kenya. These suitable regions extend westwards to cover large areas in western highlands and the western regions around Lake Victoria and bordering Uganda. The entire eastern and lower-eastern regions towards the coastal region were predicted to have lower suitability for anthrax.
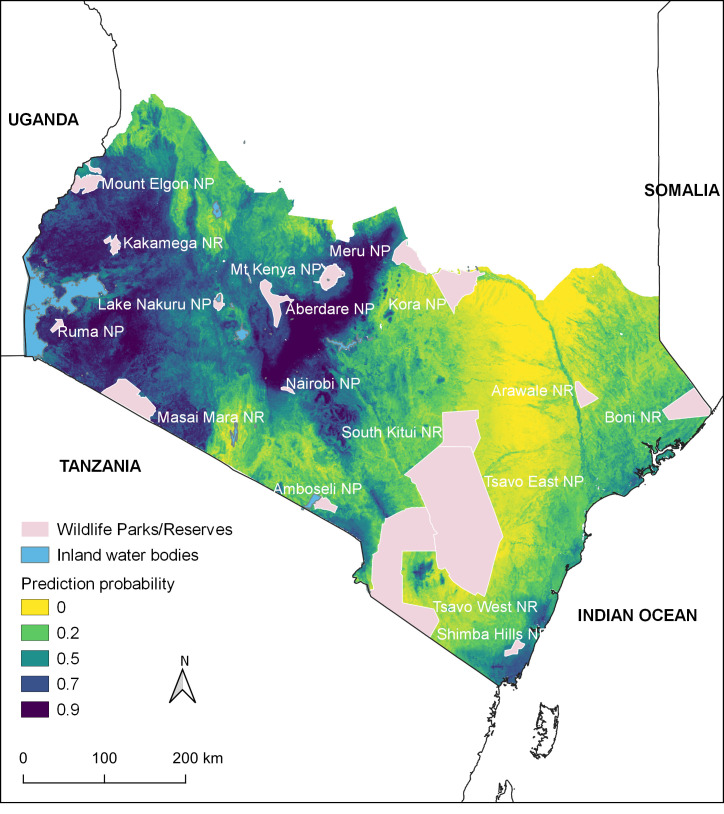
Conclusion: These modeling efforts identified areas of anthrax suitability across southern Kenya, including high and medium agricultural potential regions and wildlife parks, important for tourism and foreign exchange. These predictions are useful for policy makers in designing targeted surveillance and/or control interventions in Kenya. We thank the staff of Directorate of Veterinary Services under the Ministry of Agriculture, Livestock and Fisheries, for collecting and providing the anthrax historical occurrence data.
Conflict of interest statement
The authors have declared that no competing interests exist.
Figures
References
-
- Turnbull PCB, WHO. Anthrax in humans and animals. World Health Organization; 2008. - PubMed
-
- Gachohi JM, Gakuya F, Lekolool I, Osoro E, Nderitu L, Munyua P, et al. Temporal and spatial distribution of anthrax outbreaks among Kenyan wildlife, 1999–2017. Epidemiol Infect. 2019;147.
Publication types
MeSH terms
Substances
LinkOut - more resources
Full Text Sources
Other Literature Sources
Medical
