

Decreased incidence, virus transmission capacity, and severity of COVID-19 at altitude on the American continent
- PMID: 33780470
- PMCID: PMC8006995
- DOI: 10.1371/journal.pone.0237294
Decreased incidence, virus transmission capacity, and severity of COVID-19 at altitude on the American continent
Abstract
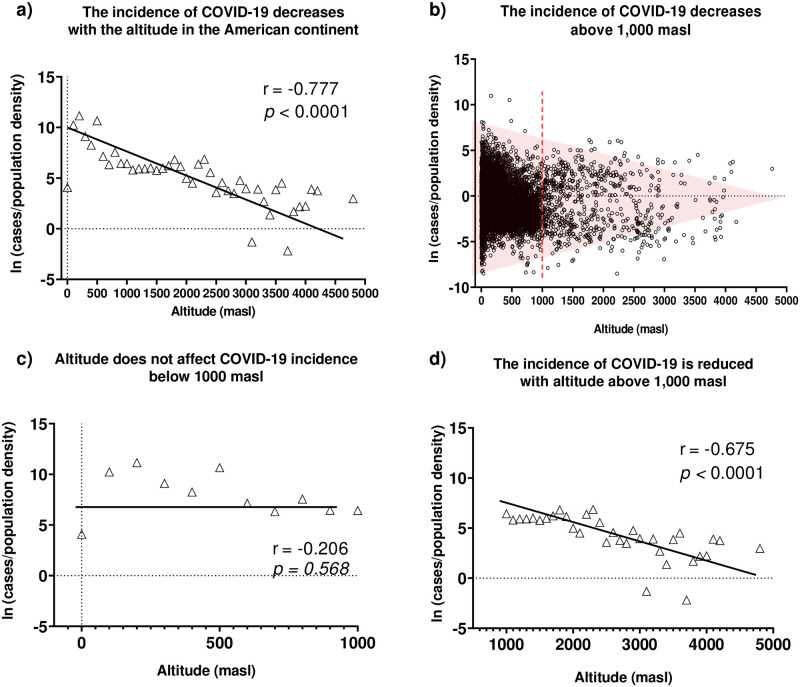
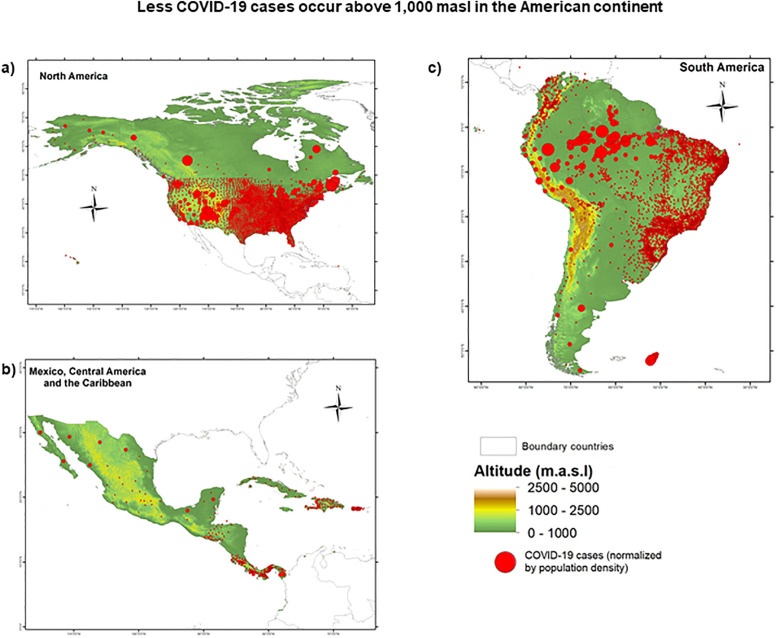
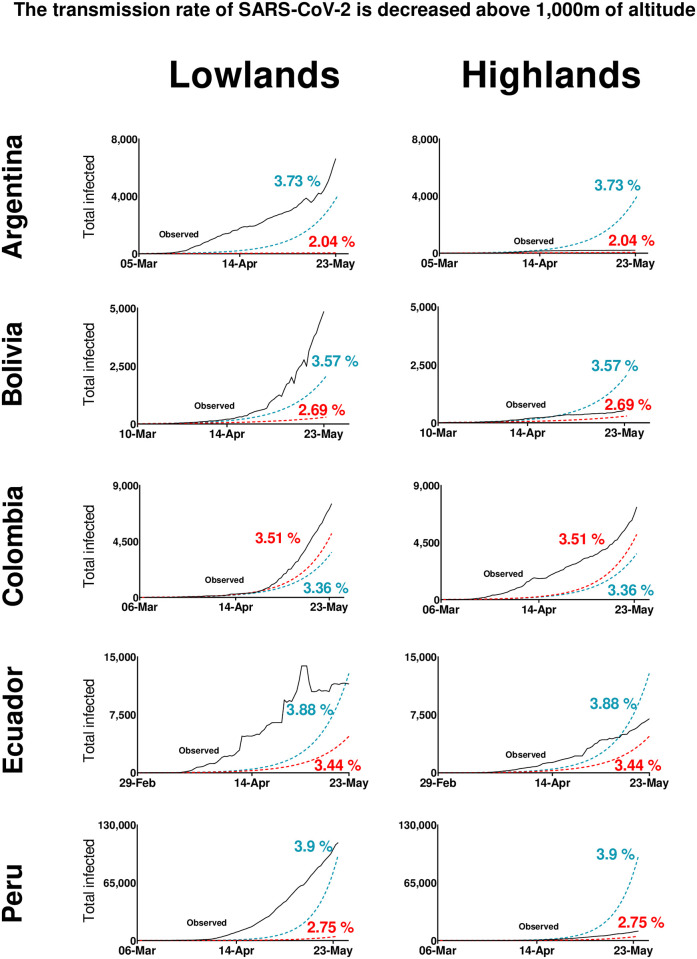
The coronavirus disease 2019 (COVID-19) outbreak in North, Central, and South America has become the epicenter of the current pandemic. We have suggested previously that the infection rate of this virus might be lower in people living at high altitude (over 2,500 m) compared to that in the lowlands. Based on data from official sources, we performed a new epidemiological analysis of the development of the pandemic in 23 countries on the American continent as of May 23, 2020. Our results confirm our previous finding, further showing that the incidence of COVID-19 on the American continent decreases significantly starting at 1,000 m above sea level (masl). Moreover, epidemiological modeling indicates that the virus transmission rate is lower in the highlands (>1,000 masl) than in the lowlands (<1,000 masl). Finally, evaluating the differences in the recovery percentage of patients, the death-to-case ratio, and the theoretical fraction of undiagnosed cases, we found that the severity of COVID-19 is also decreased above 1,000 m. We conclude that the impact of the COVID-19 decreases significantly with altitude.
Conflict of interest statement
The authors have declared that no competing interests exist.
Figures
References
-
- World Health Organization. Coronavirus Disease (COVID-19)—events as they happen 2020. https://www.who.int/emergencies/diseases/novel-coronavirus-2019/events-a....
-
- Joshua Berlinger CNN. Coronavirus has now spread to every continent except Antarctica 2020. https://www.cnn.com/2020/02/25/asia/novel-coronavirus-covid-update-us-so....
-
- NPR. Millions Return To Work In Italy After Weeks Of Lockdown: @NPR; 2020. https://www.npr.org/sections/coronavirus-live-updates/2020/05/04/8499899....
-
- Langton K. China lockdown: How long was China on lockdown? Express. 2020 2020-05-06.
-
- France 24. France sticks by lockdown easing plan despite mayors’ ‘forced march’ concerns: @FRANCE24; 2020 [updated 2020-05-04]. https://www.france24.com/en/20200504-france-sticks-by-lockdown-easing-pl....
MeSH terms
LinkOut - more resources
Full Text Sources
Other Literature Sources
Medical
