. 2021 Mar 29;16(3):e0249262.
doi: 10.1371/journal.pone.0249262. eCollection 2021.

The effect of control measures on COVID-19 transmission in South Korea

Affiliations

The effect of control measures on COVID-19 transmission in South Korea

Taeyong Lee et al. PLoS One. .

Abstract

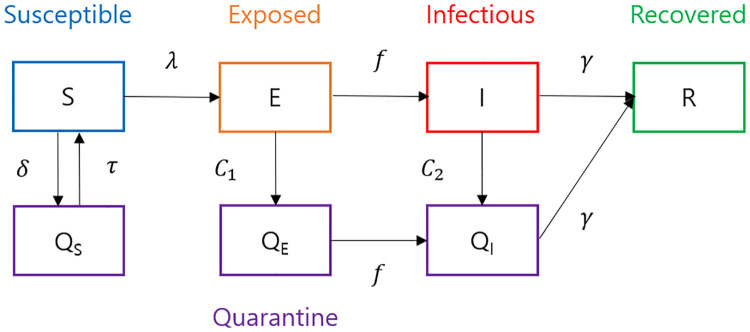
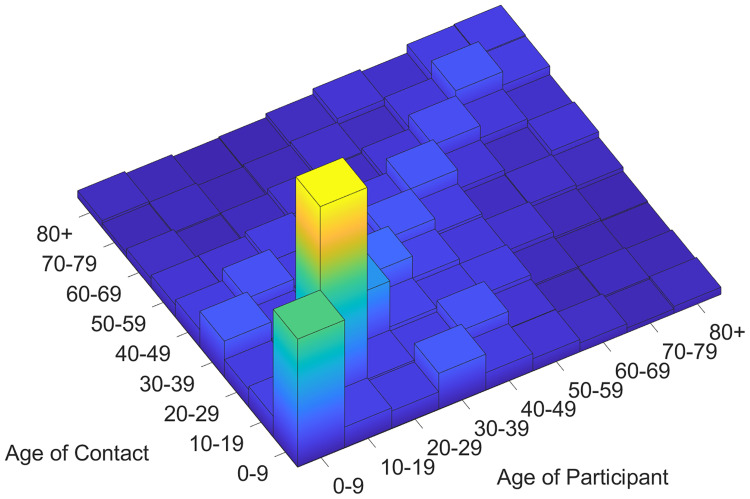
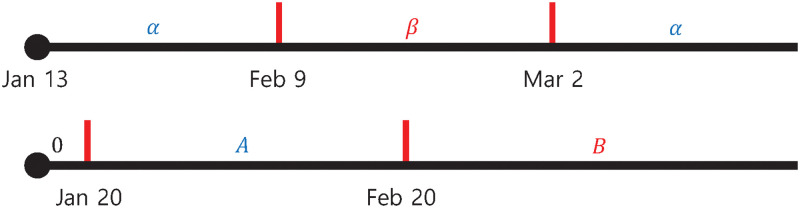
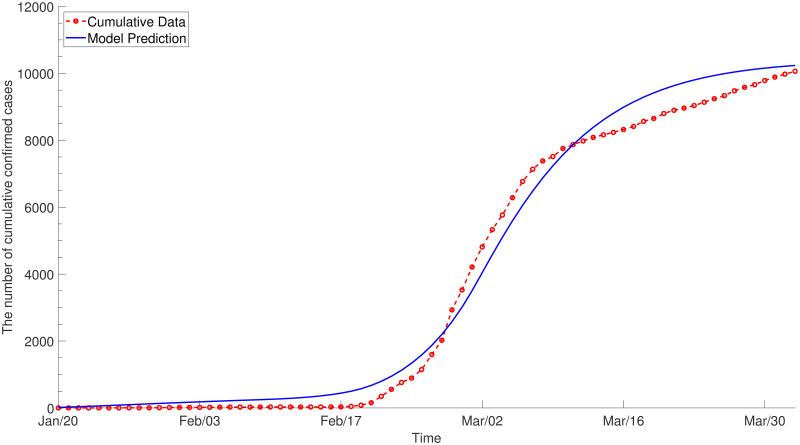
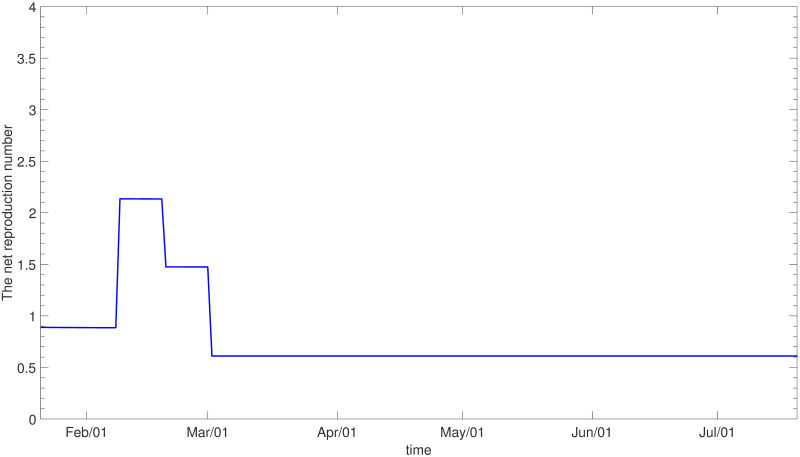
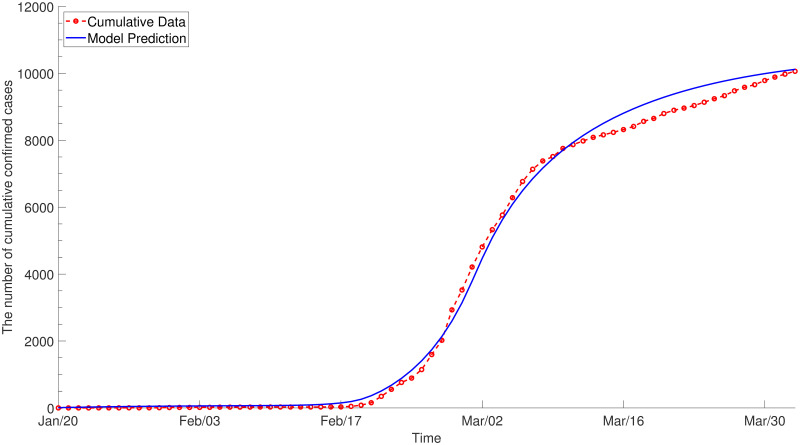
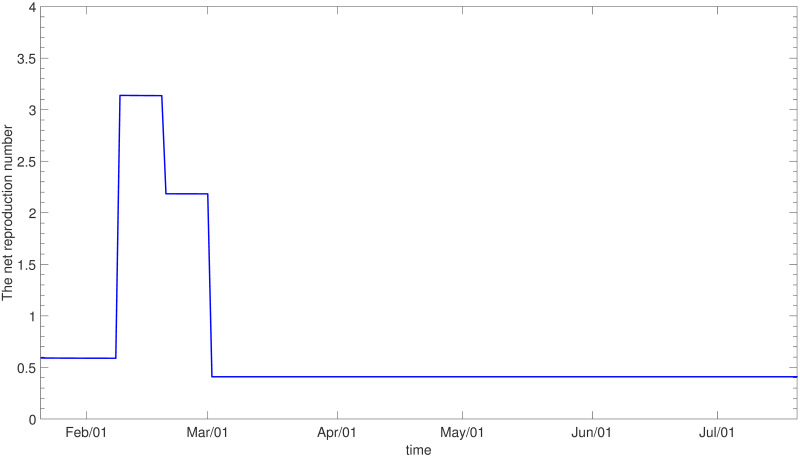
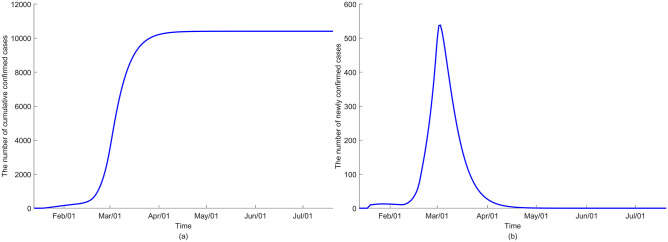
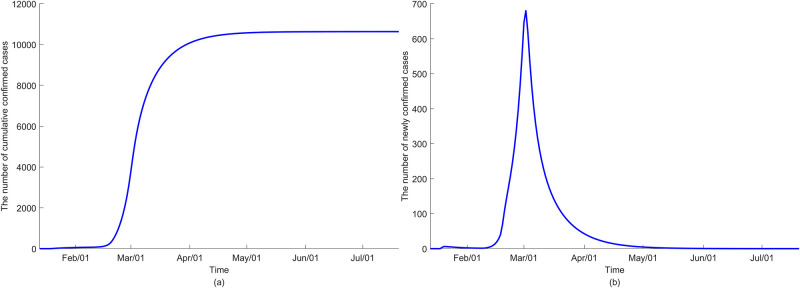
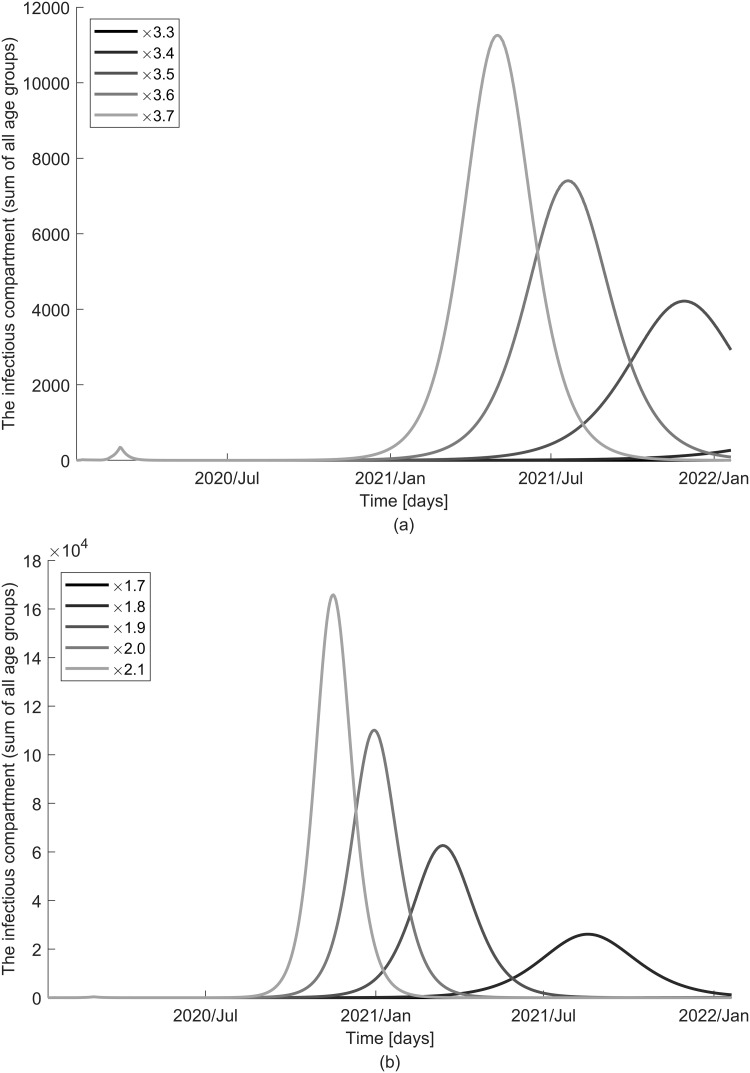
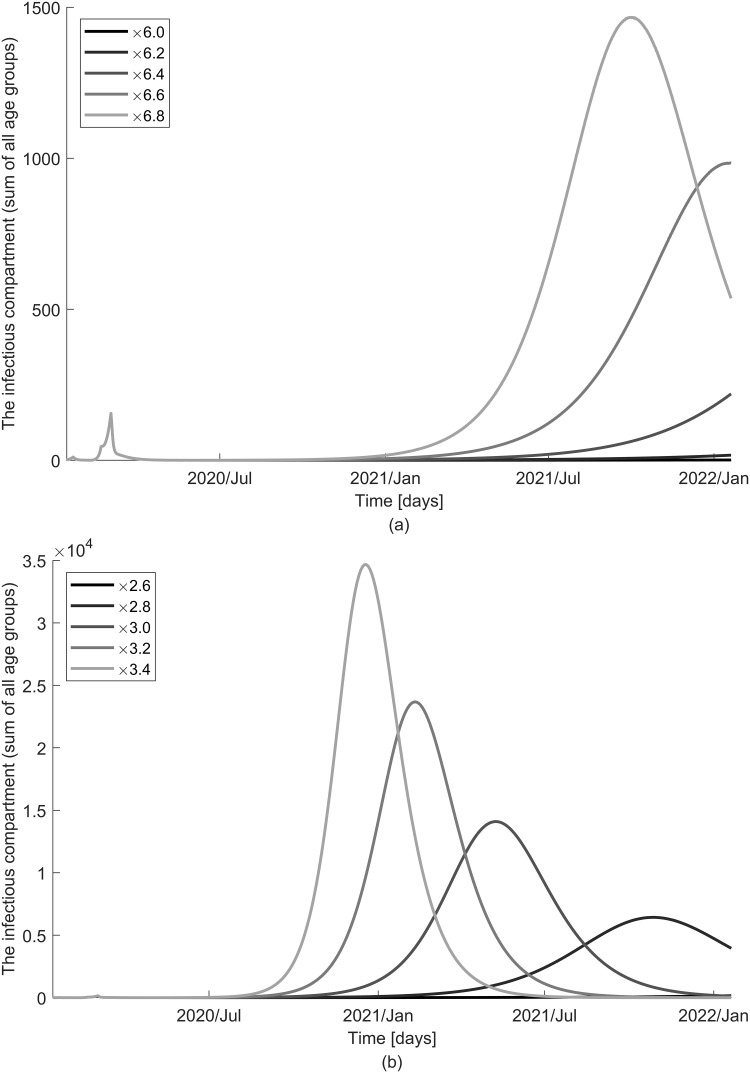
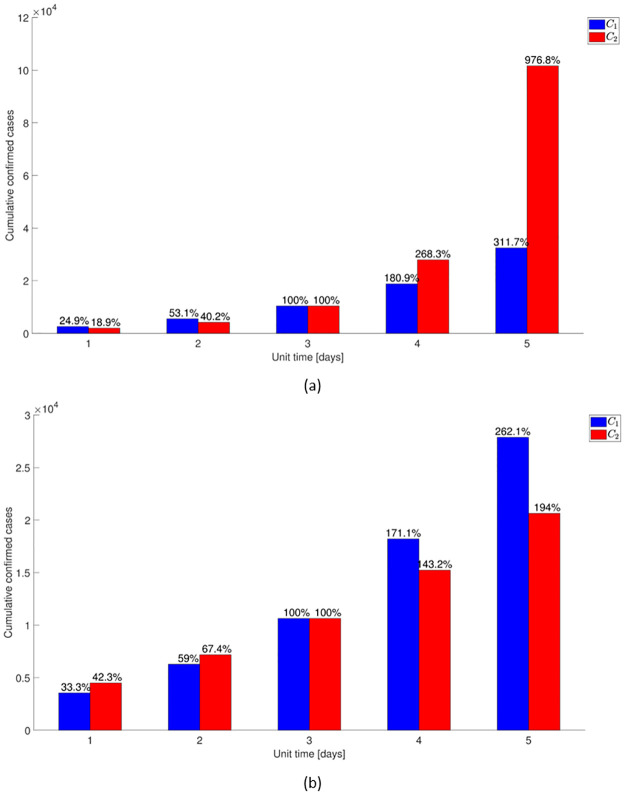
Countries around the world have taken control measures to mitigate the spread of COVID-19, including Korea. Social distancing is considered an essential strategy to reduce transmission in the absence of vaccination or treatment. While interventions have been successful in controlling COVID-19 in Korea, maintaining the current restrictions incurs great social costs. Thus, it is important to analyze the impact of different polices on the spread of the epidemic. To model the COVID-19 outbreak, we use an extended age-structured SEIR model with quarantine and isolation compartments. The model is calibrated to age-specific cumulative confirmed cases provided by the Korea Disease Control and Prevention Agency (KDCA). Four control measures-school closure, social distancing, quarantine, and isolation-are investigated. Because the infectiousness of the exposed has been controversial, we study two major scenarios, considering contributions to infection of the exposed, the quarantined, and the isolated. Assuming the transmission rate would increase more than 1.7 times after the end of social distancing, a second outbreak is expected in the first scenario. The epidemic threshold for increase of contacts between teenagers after school reopening is 3.3 times, which brings the net reproduction number to 1. The threshold values are higher in the second scenario. If the average time taken until isolation and quarantine reduces from three days to two, cumulative cases are reduced by 60% and 47% in the first scenario, respectively. Meanwhile, the reduction is 33% and 41%, respectively, for rapid isolation and quarantine in the second scenario. Without social distancing, a second wave is possible, irrespective of whether we assume risk of infection by the exposed. In the non-infectivity of the exposed scenario, early detection and isolation are significantly more effective than quarantine. Furthermore, quarantining the exposed is as important as isolating the infectious when we assume that the exposed also contribute to infection.


Conflict of interest statement

The authors have declared that no competing interests exist.

Figures

Fig 1
Fig 1. Model diagram.
This figure shows the proposed model to describe the dynamics of COVID-19 in South Korea, based on the SEIR model. Three compartments are added to represent the quarantined susceptible QS, quarantined exposed QE, and isolated QI.
Fig 2
Fig 2. Contact rate matrix.
The contact rate matrix is obtained from the POLYMOD survey data [13].
Fig 3
Fig 3. The period of piece-wise constant parameters according to the timeline of events.
q represents the transmission rates, qis in Eq (1), and C represents both C1 and C2. Of note, interventions began on 20 January 2020 when the first COVID-19 patient was confirmed in South Korea.
Fig 4
Fig 4. The results of parameter estimation (ε = 0).
WAIFW and the rates of quarantine and isolation are fitted to the age-specific cumulative confirmed cases by assuming that only the infectious contribute to the force of infection. The dotted line with circles denotes the target data and the solid line denotes the model prediction with estimated parameters.
Fig 5
Fig 5. The net reproduction number (ε = 0).
Fig 6
Fig 6. The results of parameter estimation (ε ≠ 0).
WAIFW and the rates of quarantine and isolation are fitted to the age-specific cumulative confirmed cases by assuming reduced infectivity of the exposed, quarantined and isolated. The dotted line with circles denotes the target data and the solid line denotes the model prediction with estimated parameters.
Fig 7
Fig 7. The net reproduction number (ε ≠ 0).
Fig 8
Fig 8. The dynamics of COVID-19 transmission under the assumption that only the infectious contribute to the FOI (ε = 0) in (a) cumulative confirmed cases and (b) newly confirmed cases.
Fig 9
Fig 9. The dynamics of COVID-19 transmission under the assumption that the exposed, quarantined and isolated also contribute to the FOI (ε ≠ 0) in (a) cumulative confirmed cases and (b) newly confirmed cases.
Fig 10
Fig 10. Impact of school closure and social distancing on the dynamics of disease spread when no infectivity of the exposed is assumed (ε = 0).
The number of the infectious is displayed with various contact rates resulting from changes in control measures: (a) school starts on 4 May 2020 and (b) social distancing is relaxed on 4 May 2020.
Fig 11
Fig 11. Impact of school closure and social distancing on the dynamics of disease spread when infectivity of the exposed is assumed (ε ≠ 0).
The number of the infectious is displayed with various contact rates resulting from changes in control measures: (a) school starts on 4 May 2020 and (b) social distancing is relaxed on 4 May 2020.
Fig 12
Fig 12. Effect of the coverage rates on the COVID-19 epidemic.
The histogram shows the cumulative confirmed cases with a different quarantine rate, C1, and isolation rate, C2 under the assumption that (a) the exposed do not contribute to FOI (ε = 0) and (b) the exposed contribute to FOI (ε ≠ 0). The change in rates is represented by varying the time taken for coverage beginning on 20 February 2020 from one day to five days. Each bar in the histogram indicates the relative amount to the cumulative cases in the baseline scenario of three days.

Similar articles

Cited by

References

    1. Kermack WO, McKendrick AG. A contribution to the mathematical theory of epidemics. Proceedings of the royal society of London Series A, Containing papers of a mathematical and physical character. 1927;115(772):700–721.
    1. Hethcote HW. The mathematics of infectious diseases. SIAM review. 2000;42(4):599–653. 10.1137/S0036144500371907 - DOI
    1. Brauer F. Some simple epidemic models. Mathematical Biosciences & Engineering. 2006;3(1):1. 10.3934/mbe.2006.3.1 - DOI - PubMed
    1. Arino J, Brauer F, van den Driessche P, Watmough J, Wu J. Simple models for containment of a pandemic. Journal of the Royal Society Interface. 2006;3(8):453–457. 10.1098/rsif.2006.0112 - DOI - PMC - PubMed
    1. Chen Y, Cheng J, Jiang Y, Liu K. A time delay dynamic system with external source for the local outbreak of 2019-nCoV. Applicable Analysis. 2020; p. 1–12.

Publication types