

Opa1 relies on cristae preservation and ATP synthase to curtail reactive oxygen species accumulation in mitochondria
- PMID: 33780775
- PMCID: PMC8039725
- DOI: 10.1016/j.redox.2021.101944
Opa1 relies on cristae preservation and ATP synthase to curtail reactive oxygen species accumulation in mitochondria
Abstract
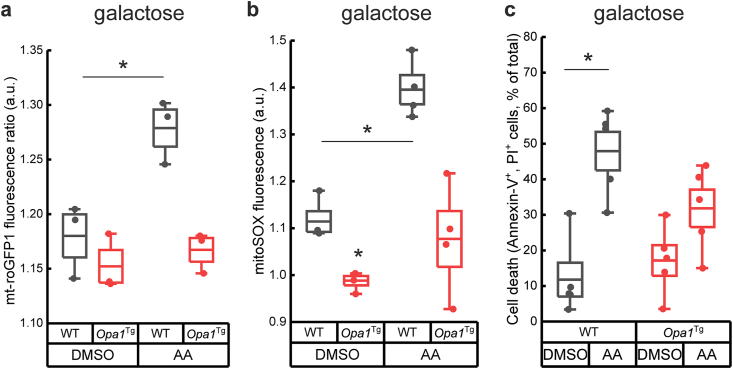
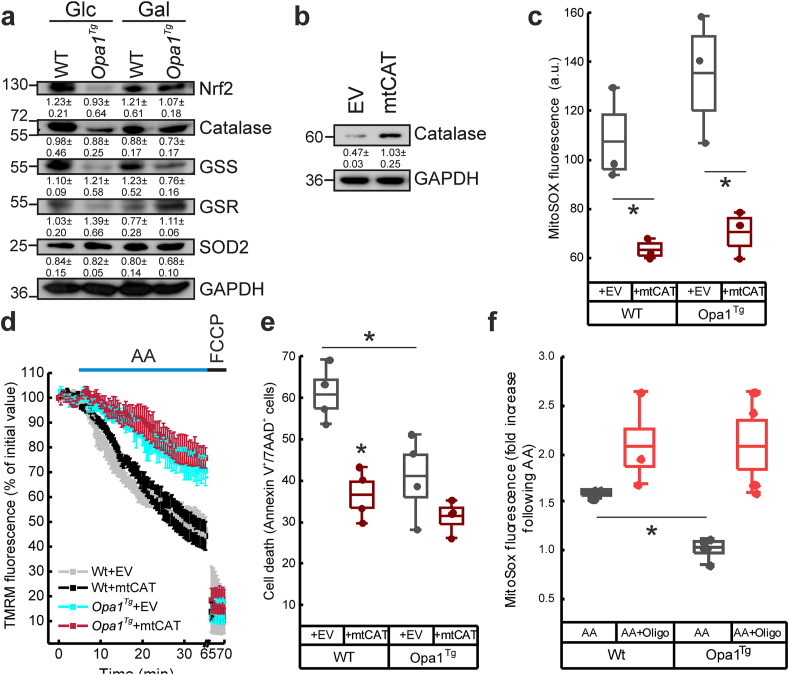
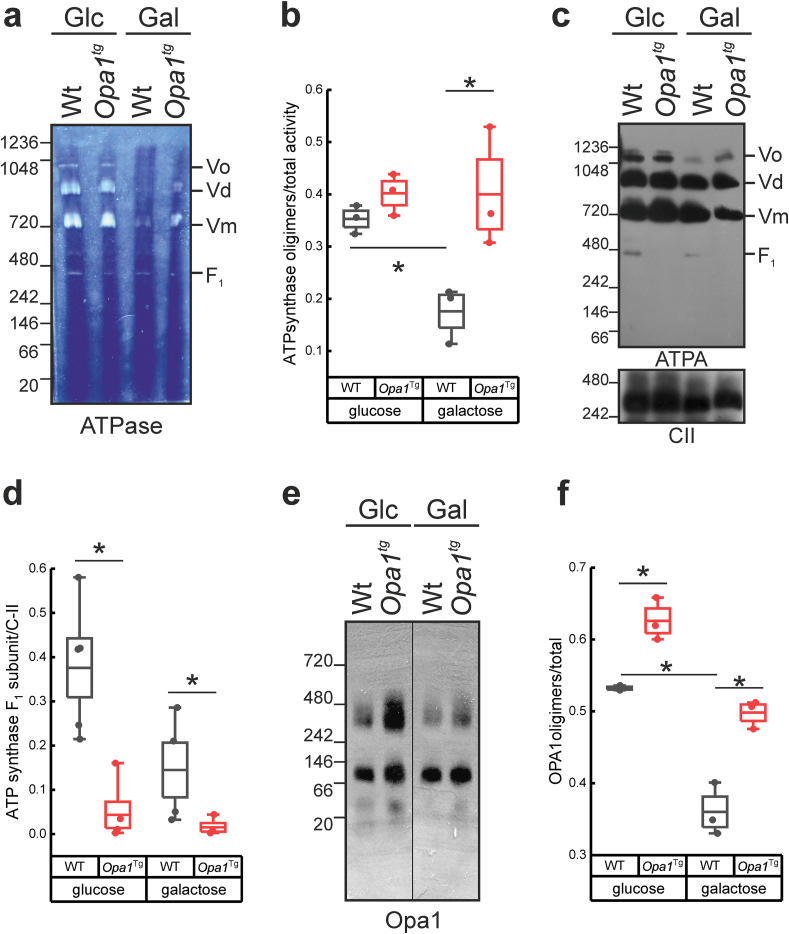
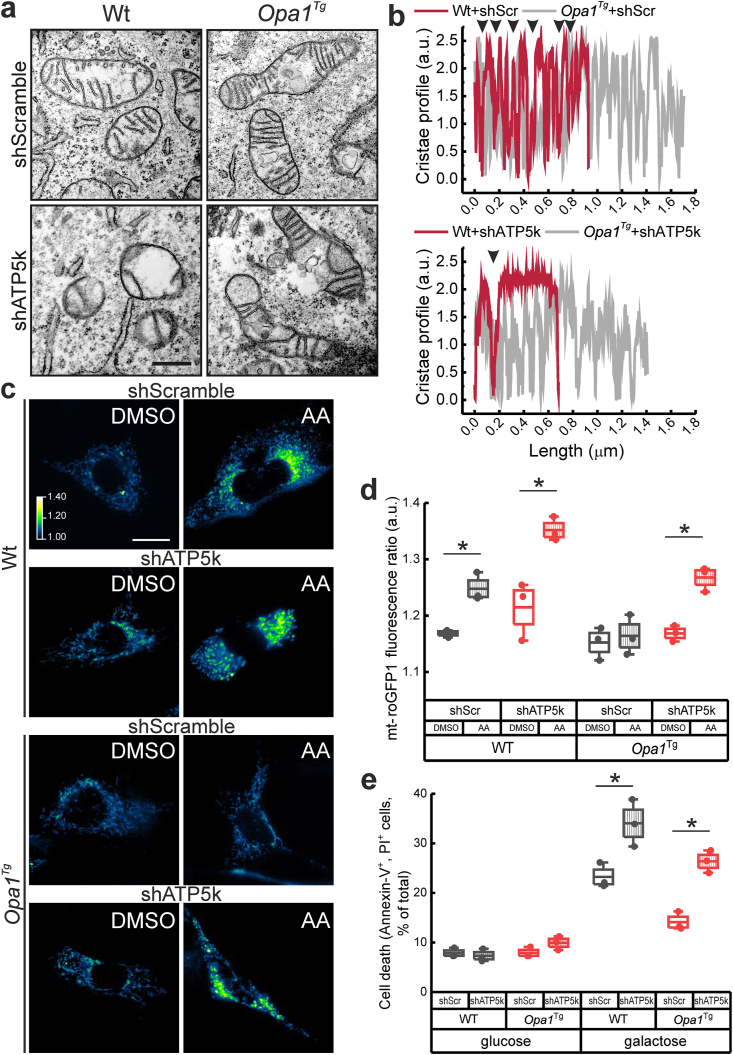
Reactive oxygen species (ROS) are a common product of active mitochondrial respiration carried in mitochondrial cristae, but whether cristae shape influences ROS levels is unclear. Here we report that the mitochondrial fusion and cristae shape protein Opa1 requires mitochondrial ATP synthase oligomers to reduce ROS accumulation. In cells fueled with galactose to force ATP production by mitochondria, cristae are enlarged, ATP synthase oligomers destabilized, and ROS accumulate. Opa1 prevents both cristae remodeling and ROS generation, without impinging on levels of mitochondrial antioxidant defense enzymes that are unaffected by Opa1 overexpression. Genetic and pharmacologic experiments indicate that Opa1 requires ATP synthase oligomerization and activity to reduce ROS levels upon a blockage of the electron transport chain. Our results indicate that the converging effect of Opa1 and mitochondrial ATP synthase on mitochondrial ultrastructure regulate ROS abundance to sustain cell viability.
Keywords: Bioenergetics; F(1)F(O)-ATP synthase; Mitochondrial cristae; Opa1; ROS; Ultrastructure.
Copyright © 2021 The Author(s). Published by Elsevier B.V. All rights reserved.
Conflict of interest statement
The authors declare that they have no known competing financial interests or personal relationships that could have appeared to influence the work reported in this paper.
Figures


Similar articles
-
The cristae modulator Optic atrophy 1 requires mitochondrial ATP synthase oligomers to safeguard mitochondrial function.Nat Commun. 2018 Aug 24;9(1):3399. doi: 10.1038/s41467-018-05655-x. Nat Commun. 2018. PMID: 30143614 Free PMC article.
-
OPA1-dependent cristae modulation is essential for cellular adaptation to metabolic demand.EMBO J. 2014 Nov 18;33(22):2676-91. doi: 10.15252/embj.201488349. Epub 2014 Oct 8. EMBO J. 2014. PMID: 25298396 Free PMC article.
-
Who and how in the regulation of mitochondrial cristae shape and function.Biochem Biophys Res Commun. 2018 May 27;500(1):94-101. doi: 10.1016/j.bbrc.2017.04.088. Epub 2017 Apr 21. Biochem Biophys Res Commun. 2018. PMID: 28438601 Review.
-
The short variant of the mitochondrial dynamin OPA1 maintains mitochondrial energetics and cristae structure.J Biol Chem. 2017 Apr 28;292(17):7115-7130. doi: 10.1074/jbc.M116.762567. Epub 2017 Mar 15. J Biol Chem. 2017. PMID: 28298442 Free PMC article.
-
Integration of superoxide formation and cristae morphology for mitochondrial redox signaling.Int J Biochem Cell Biol. 2016 Nov;80:31-50. doi: 10.1016/j.biocel.2016.09.010. Epub 2016 Sep 15. Int J Biochem Cell Biol. 2016. PMID: 27640755 Review.
Cited by
-
Mechanistic study of modulating mitochondrial fission and fusion to ameliorate neuropathic pain in mice.Sci Rep. 2025 May 4;15(1):15571. doi: 10.1038/s41598-025-99300-5. Sci Rep. 2025. PMID: 40320455 Free PMC article.
-
Mitochondrial dysfunction in diabetic ulcers: pathophysiological mechanisms and targeted therapeutic strategies.Front Cell Dev Biol. 2025 Aug 21;13:1625474. doi: 10.3389/fcell.2025.1625474. eCollection 2025. Front Cell Dev Biol. 2025. PMID: 40917755 Free PMC article. Review.
-
Targeting DRP1 with Mdivi-1 to correct mitochondrial abnormalities in ADOA+ syndrome.JCI Insight. 2024 Jun 25;9(15):e180582. doi: 10.1172/jci.insight.180582. JCI Insight. 2024. PMID: 38916953 Free PMC article.
-
Long-lived mitochondrial proteins and why they exist.Trends Cell Biol. 2022 Aug;32(8):646-654. doi: 10.1016/j.tcb.2022.02.001. Epub 2022 Feb 24. Trends Cell Biol. 2022. PMID: 35221146 Free PMC article. Review.
-
Disruption of mitochondrial homeostasis and permeability transition pore opening in OPA1 iPSC-derived retinal ganglion cells.Acta Neuropathol Commun. 2025 Feb 13;13(1):28. doi: 10.1186/s40478-025-01942-z. Acta Neuropathol Commun. 2025. PMID: 39948685 Free PMC article.
References
-
- Walker J.E. The ATP synthase: the understood, the uncertain and the unknown. Biochem. Soc. Trans. 2013;41:1–16. - PubMed
-
- Kucharczyk R., Zick M., Bietenhader M., Rak M., Couplan E., Blondel M., Caubet S.D., di Rago J.P. Mitochondrial ATP synthase disorders: Molecular mechanisms and the quest for curative therapeutic approaches. Biochim. Biophys. Acta Mol. Cell Res. 2009;1793:186–199. - PubMed
-
- Reid R.A., Moyle J., Mitchell P. Synthesis of adenosine triphosphate by a protonmotive force in rat liver mitochondria. Nature. 1966;212:257–258. - PubMed
Publication types
MeSH terms
Substances
LinkOut - more resources
Full Text Sources
Other Literature Sources
Molecular Biology Databases
