

Spatiotemporal patterns of gene expression around implanted silicon electrode arrays
- PMID: 33780909
- PMCID: PMC8650570
- DOI: 10.1088/1741-2552/abf2e6
Spatiotemporal patterns of gene expression around implanted silicon electrode arrays
Abstract
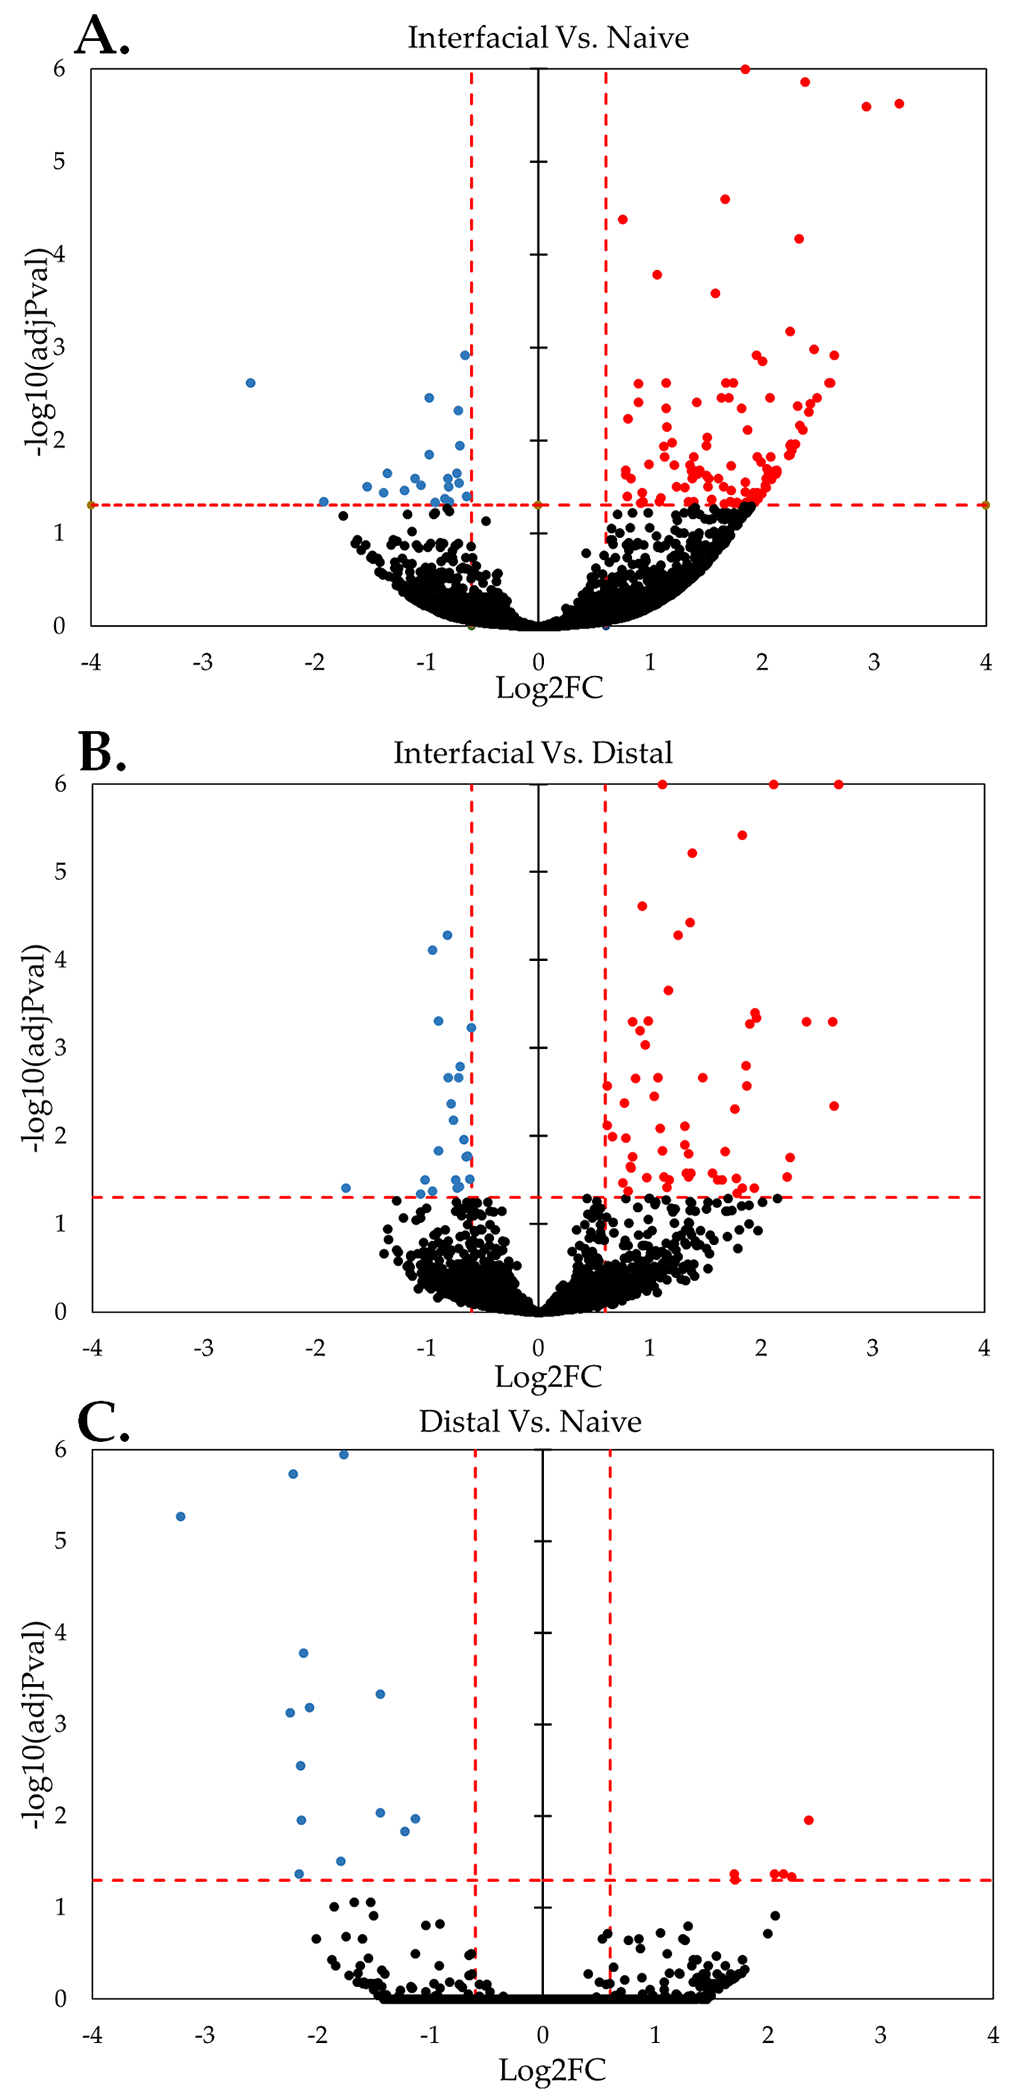
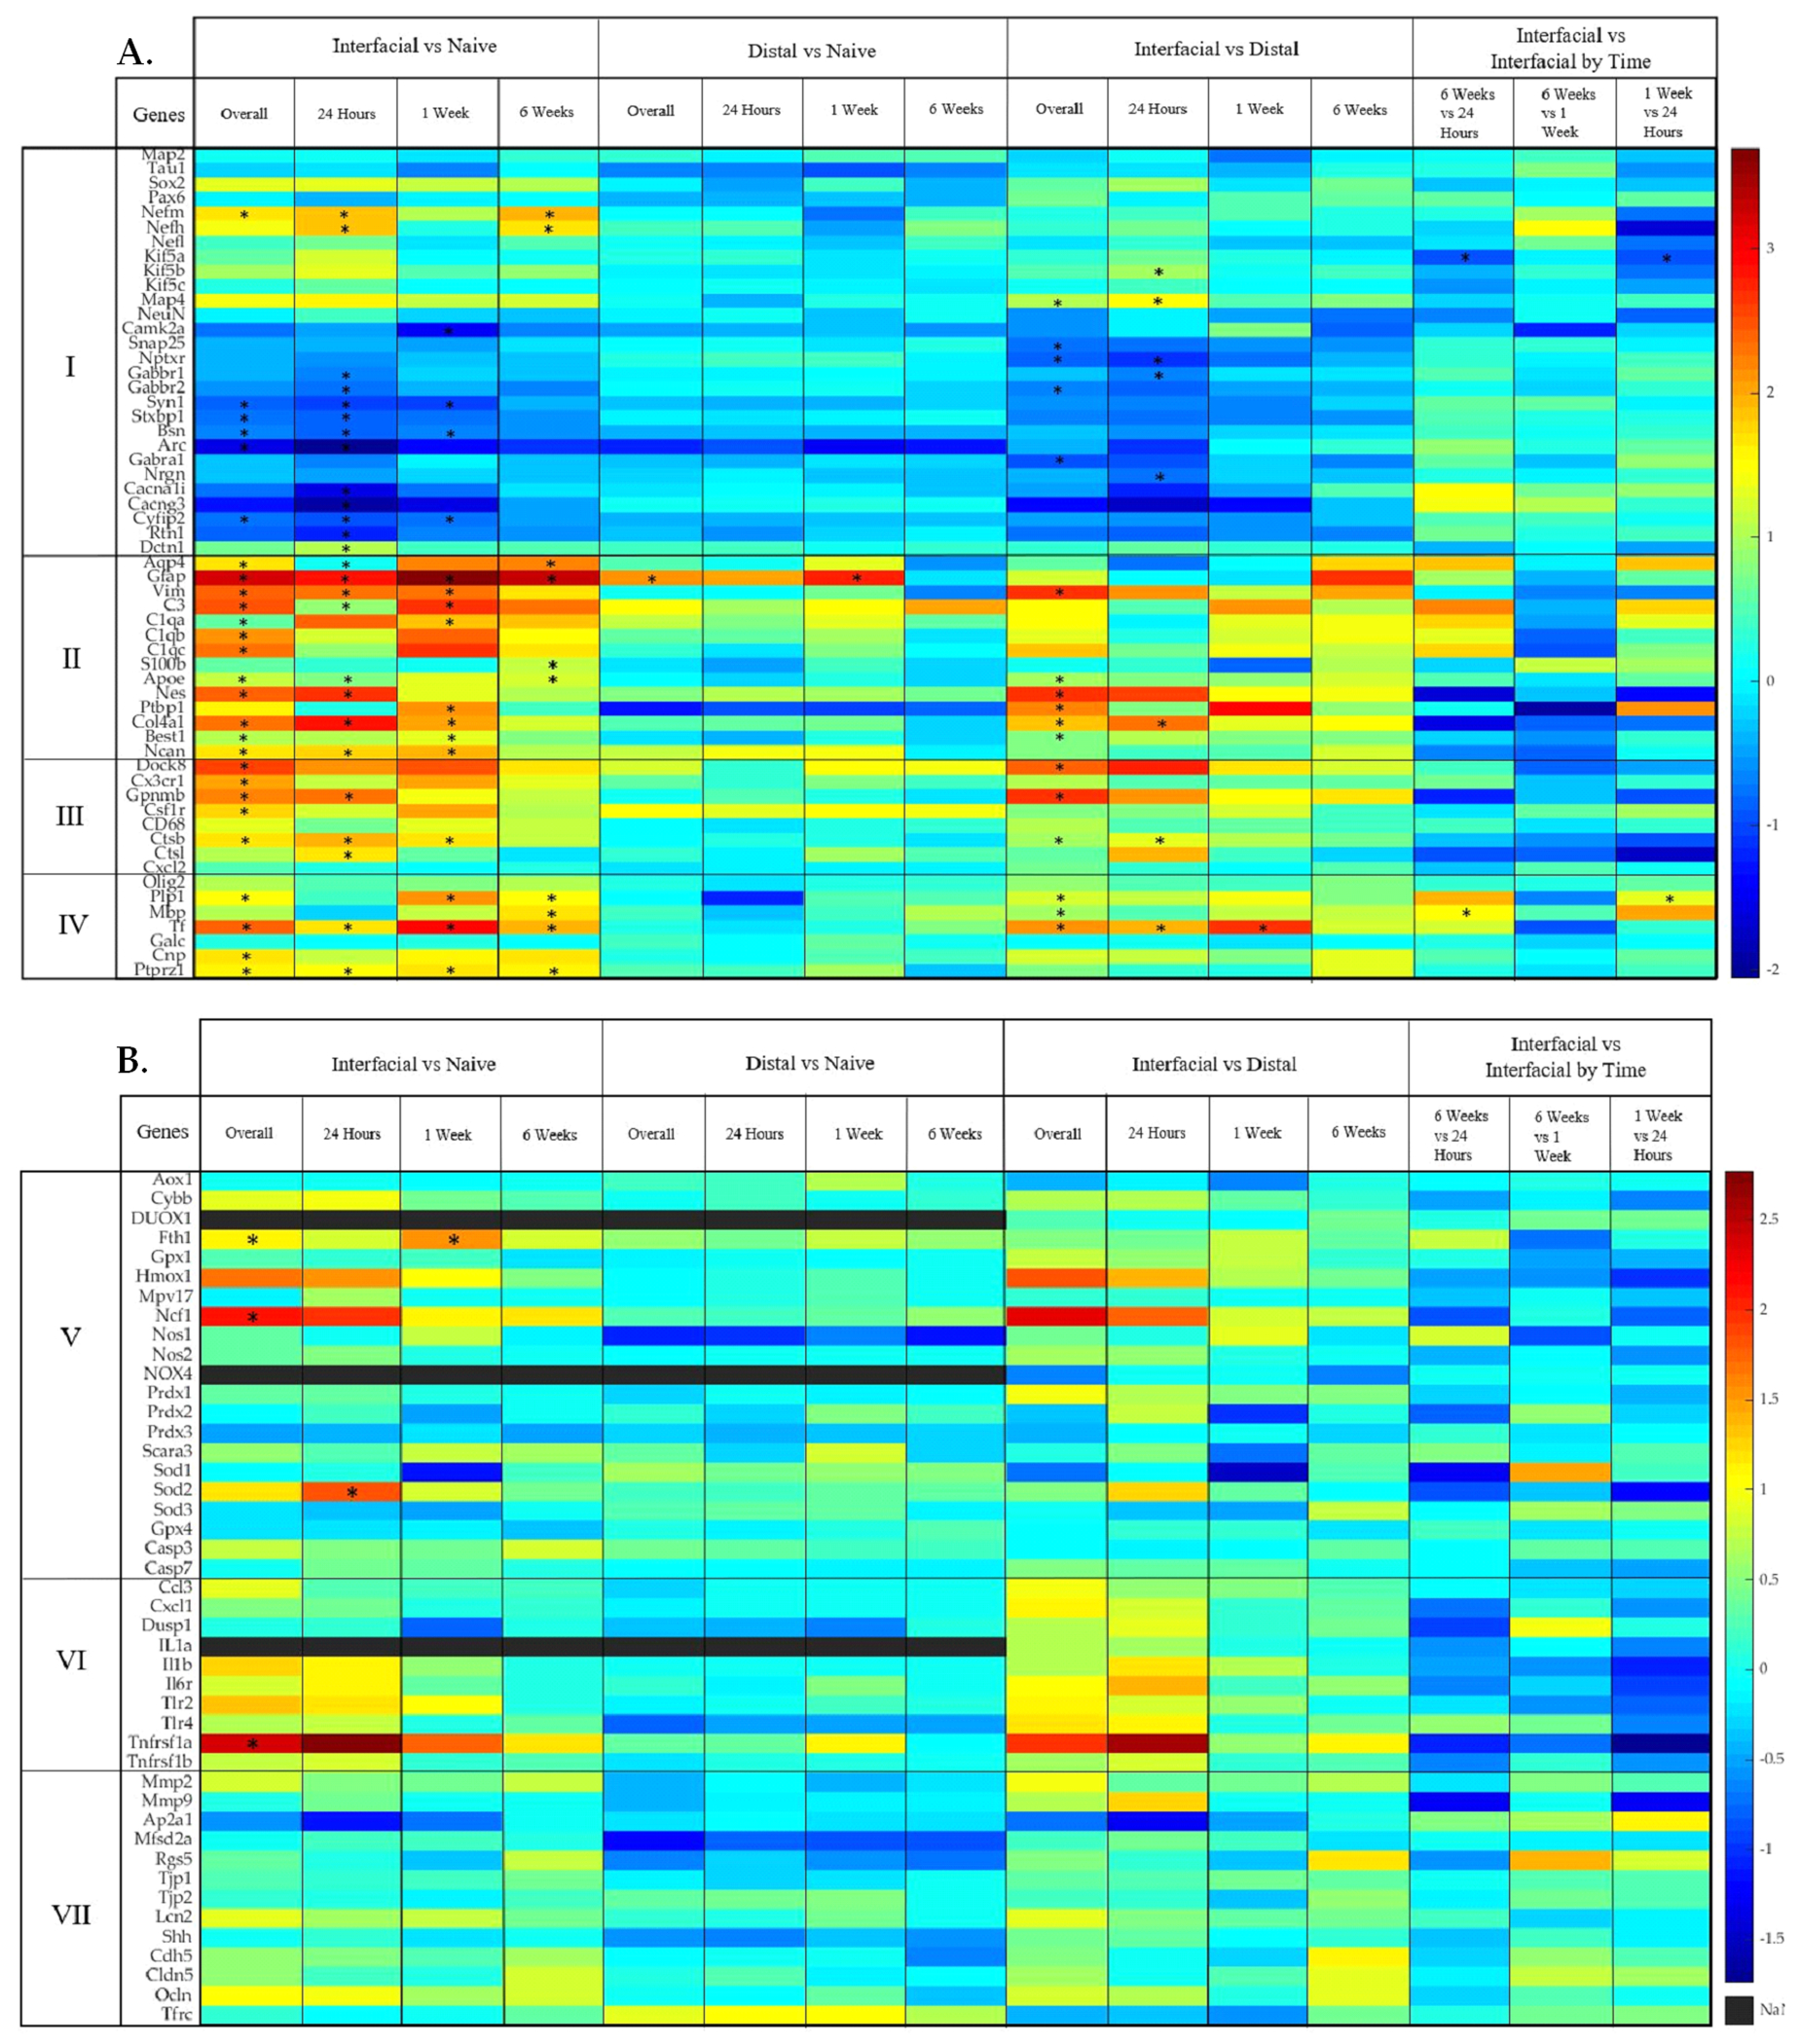
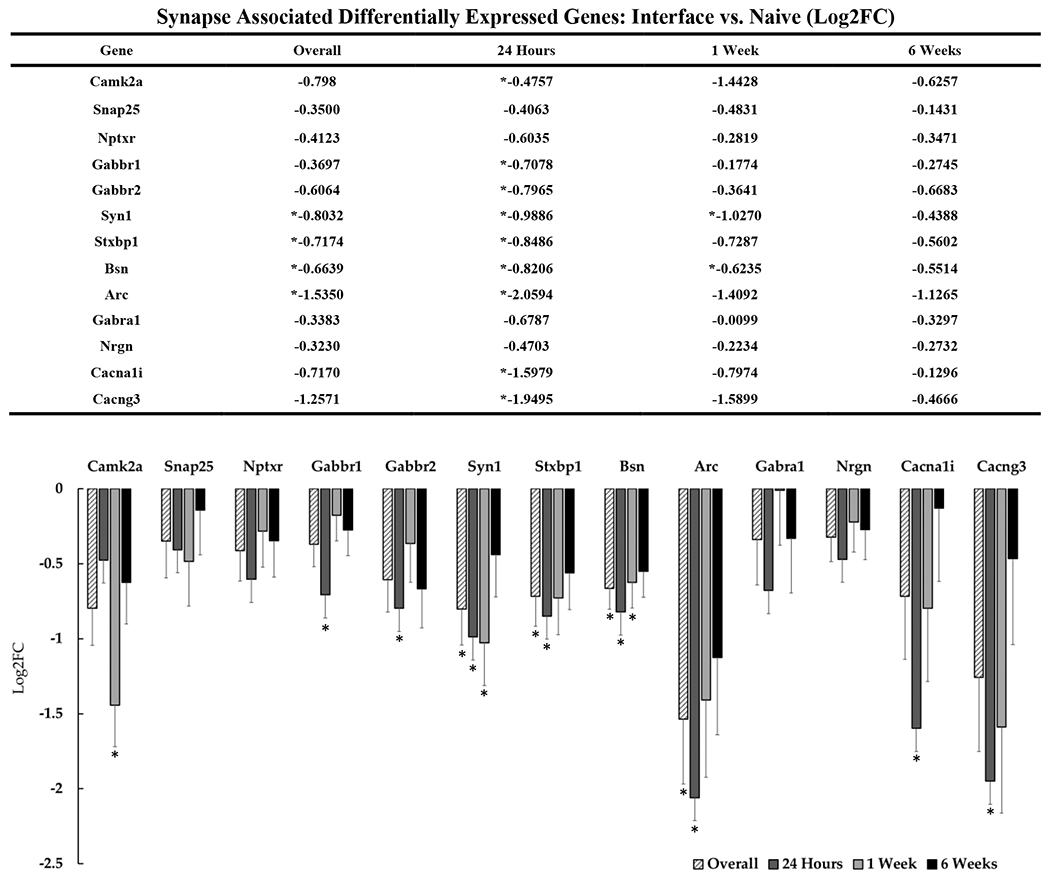
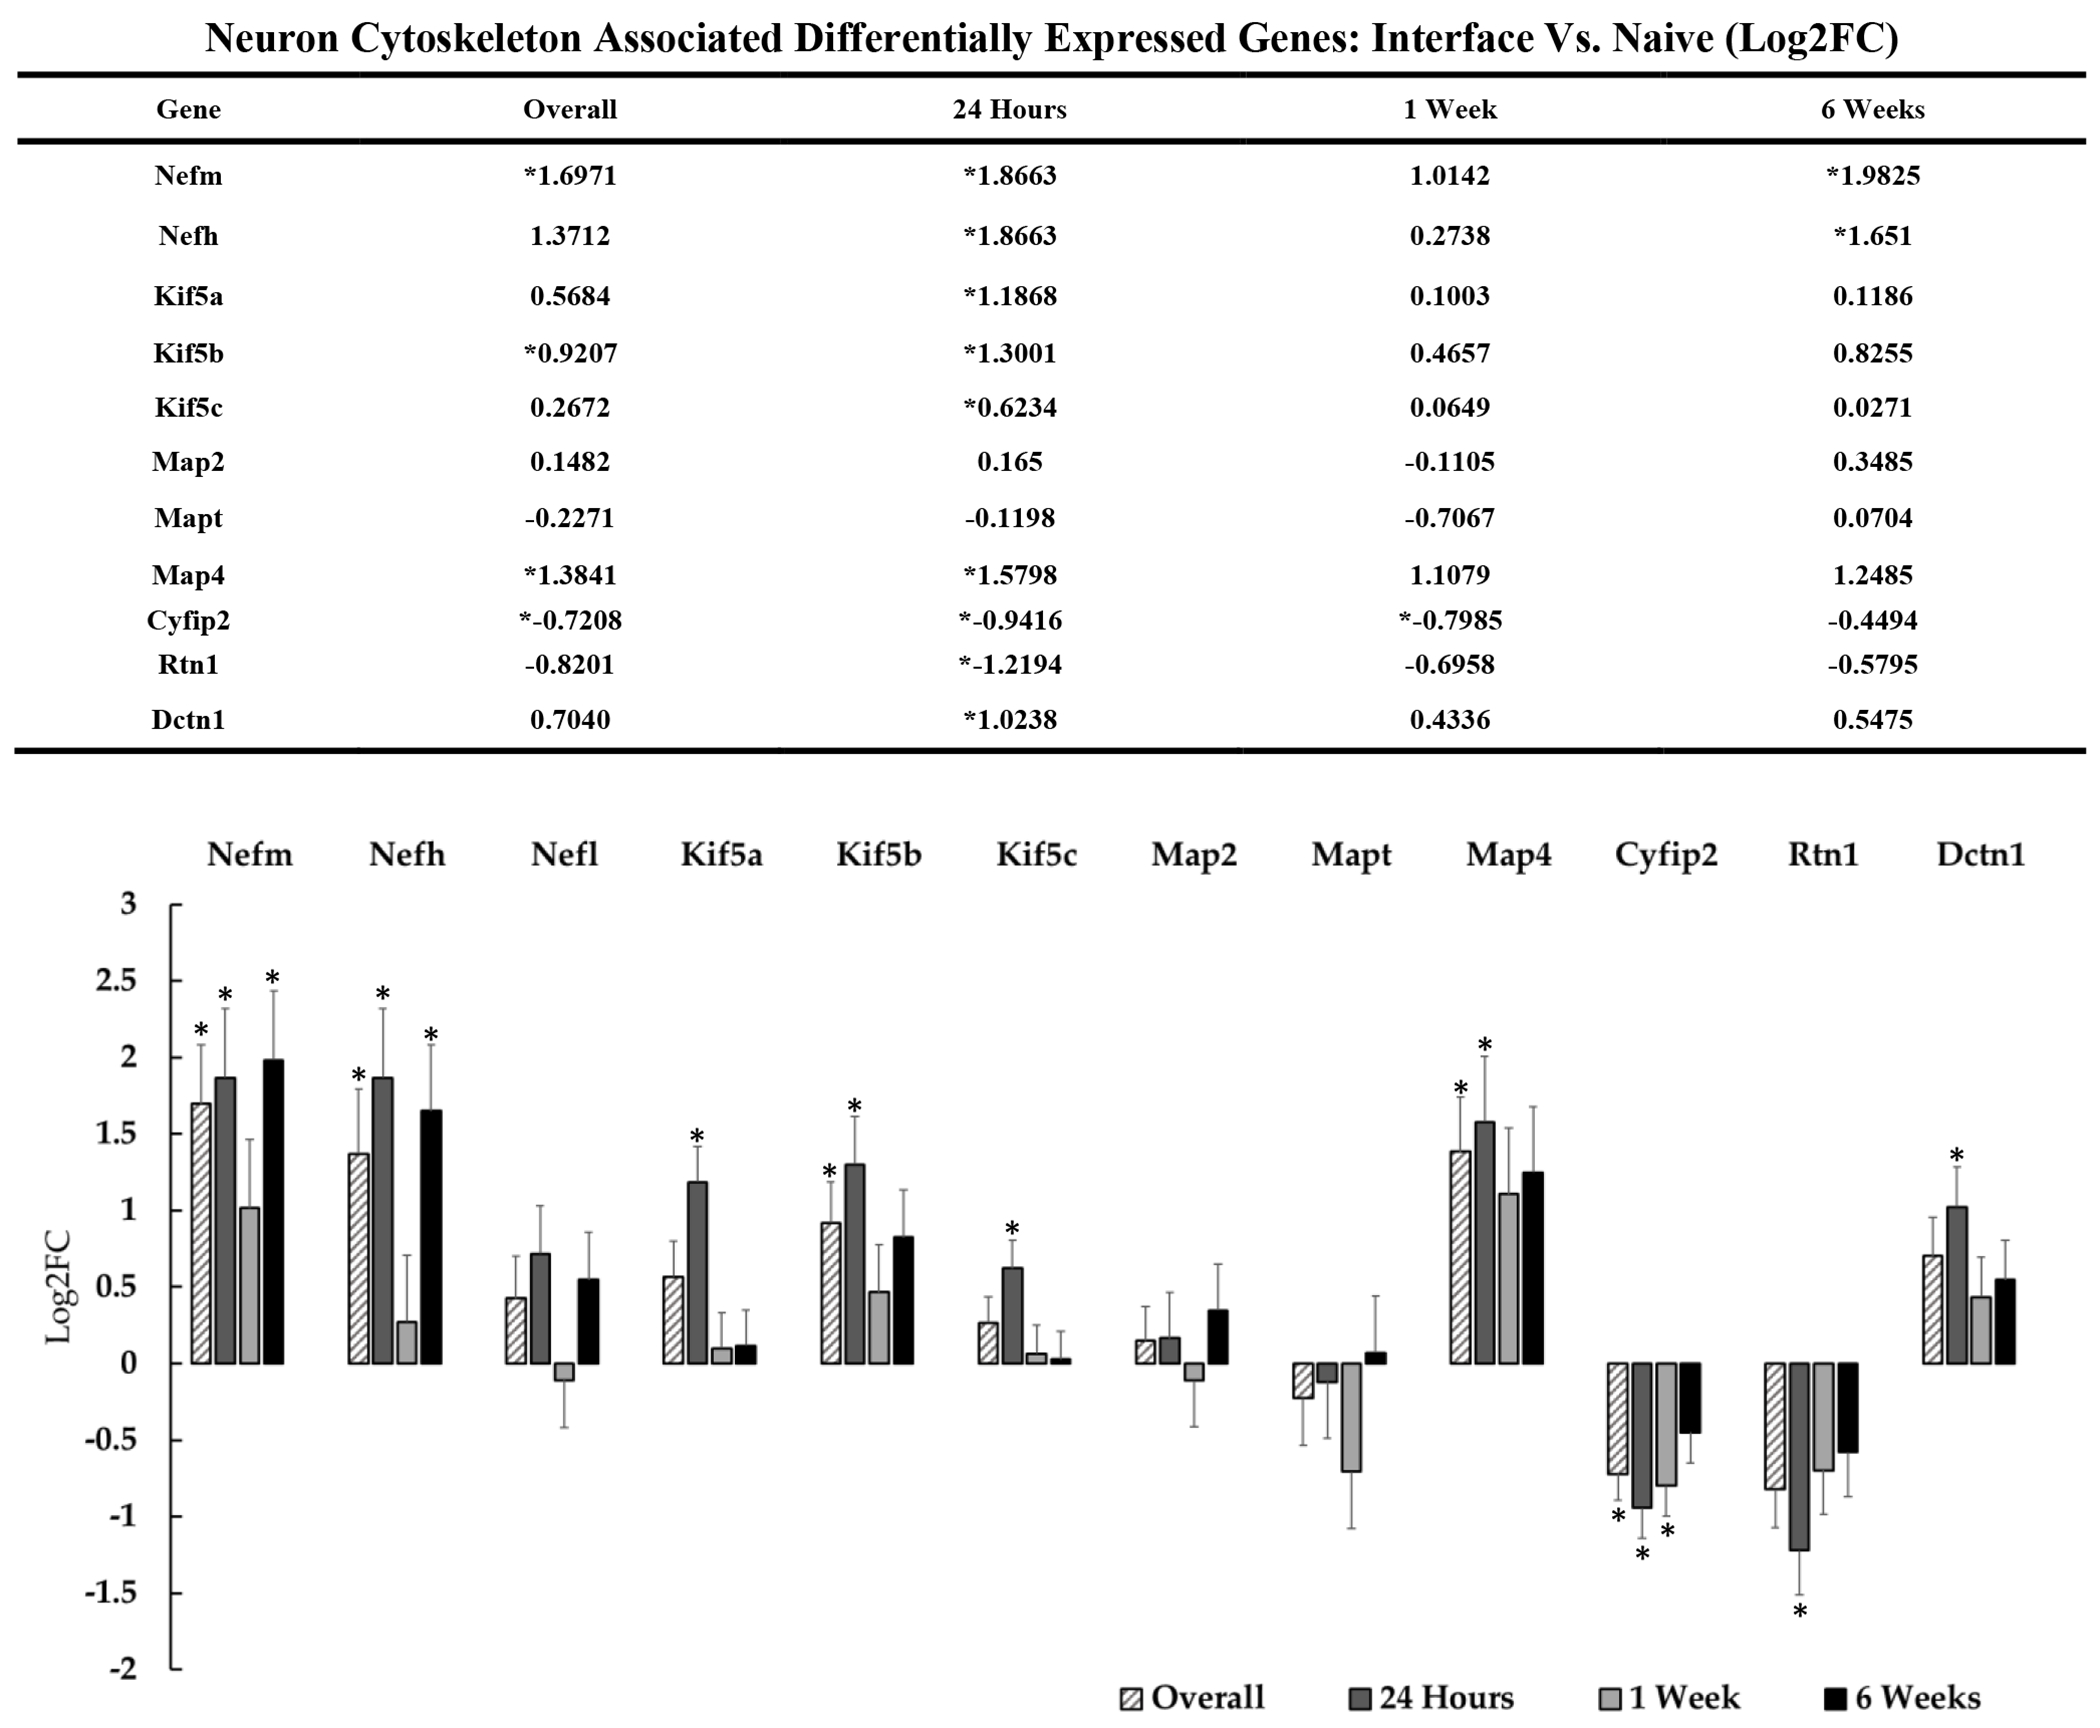
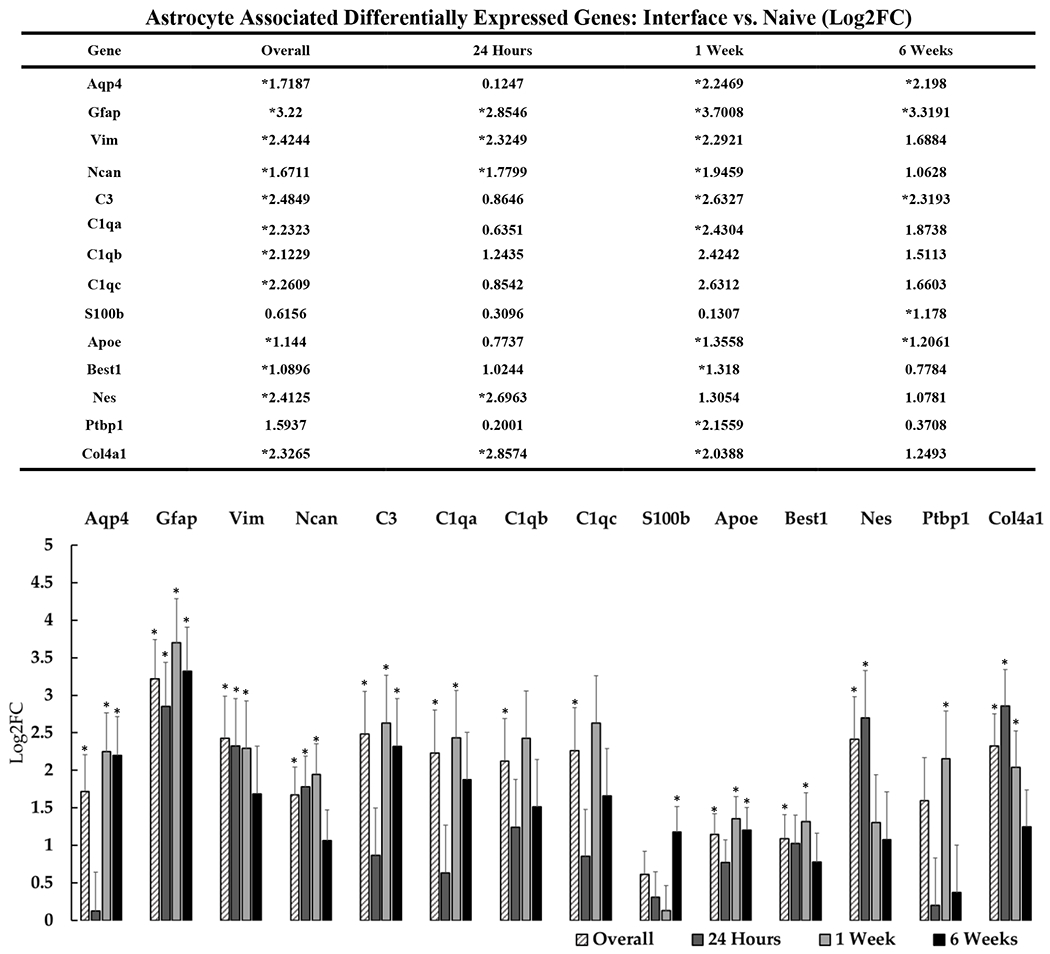
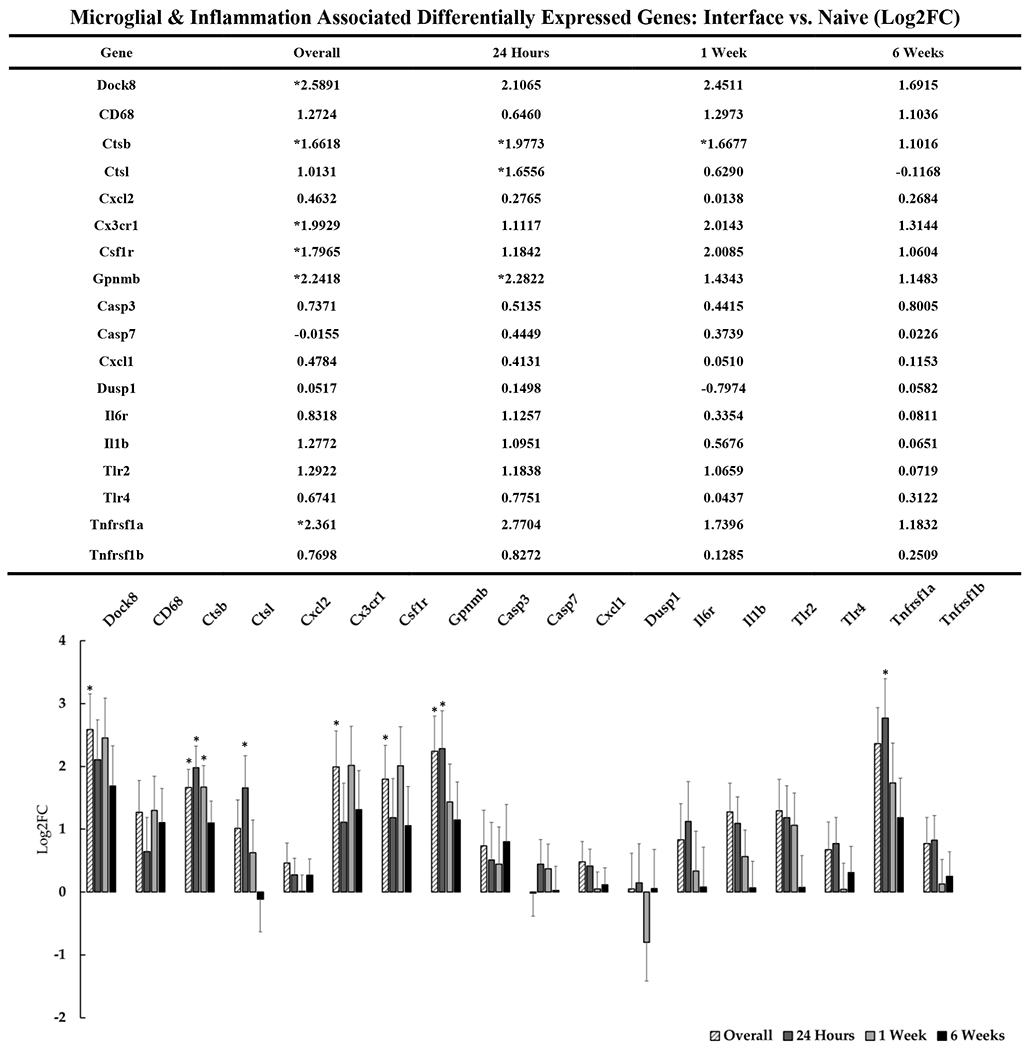
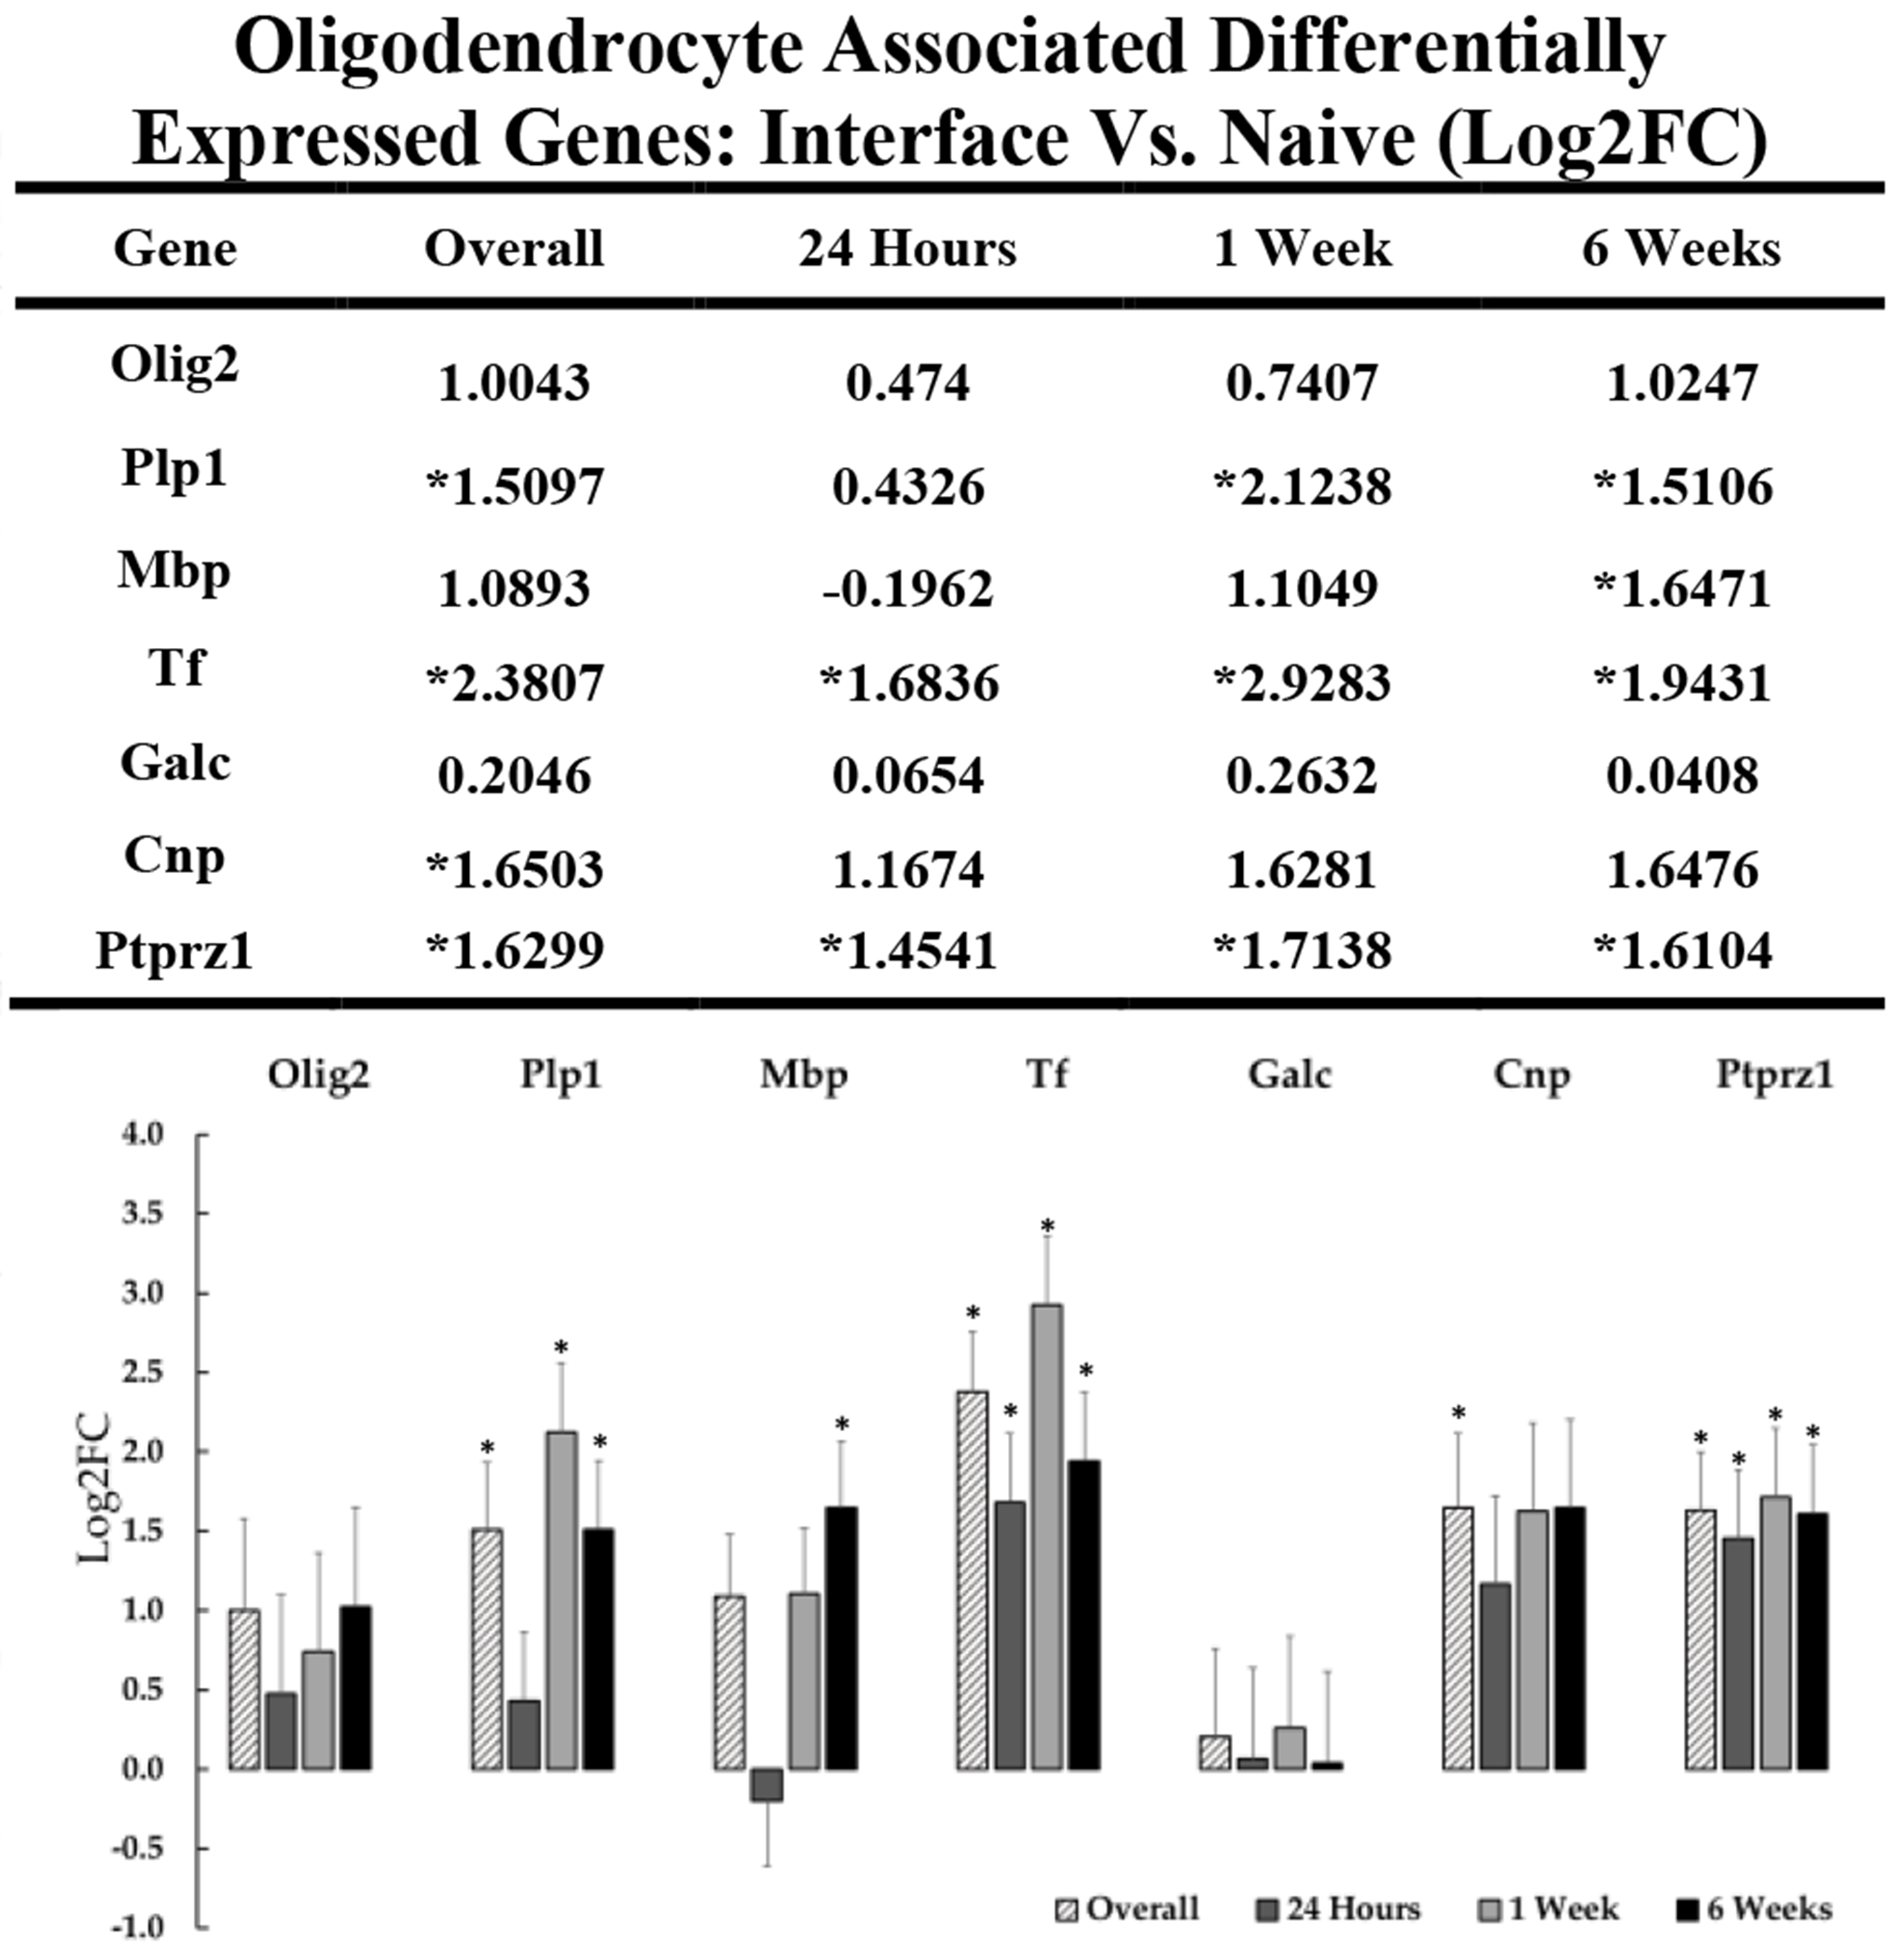
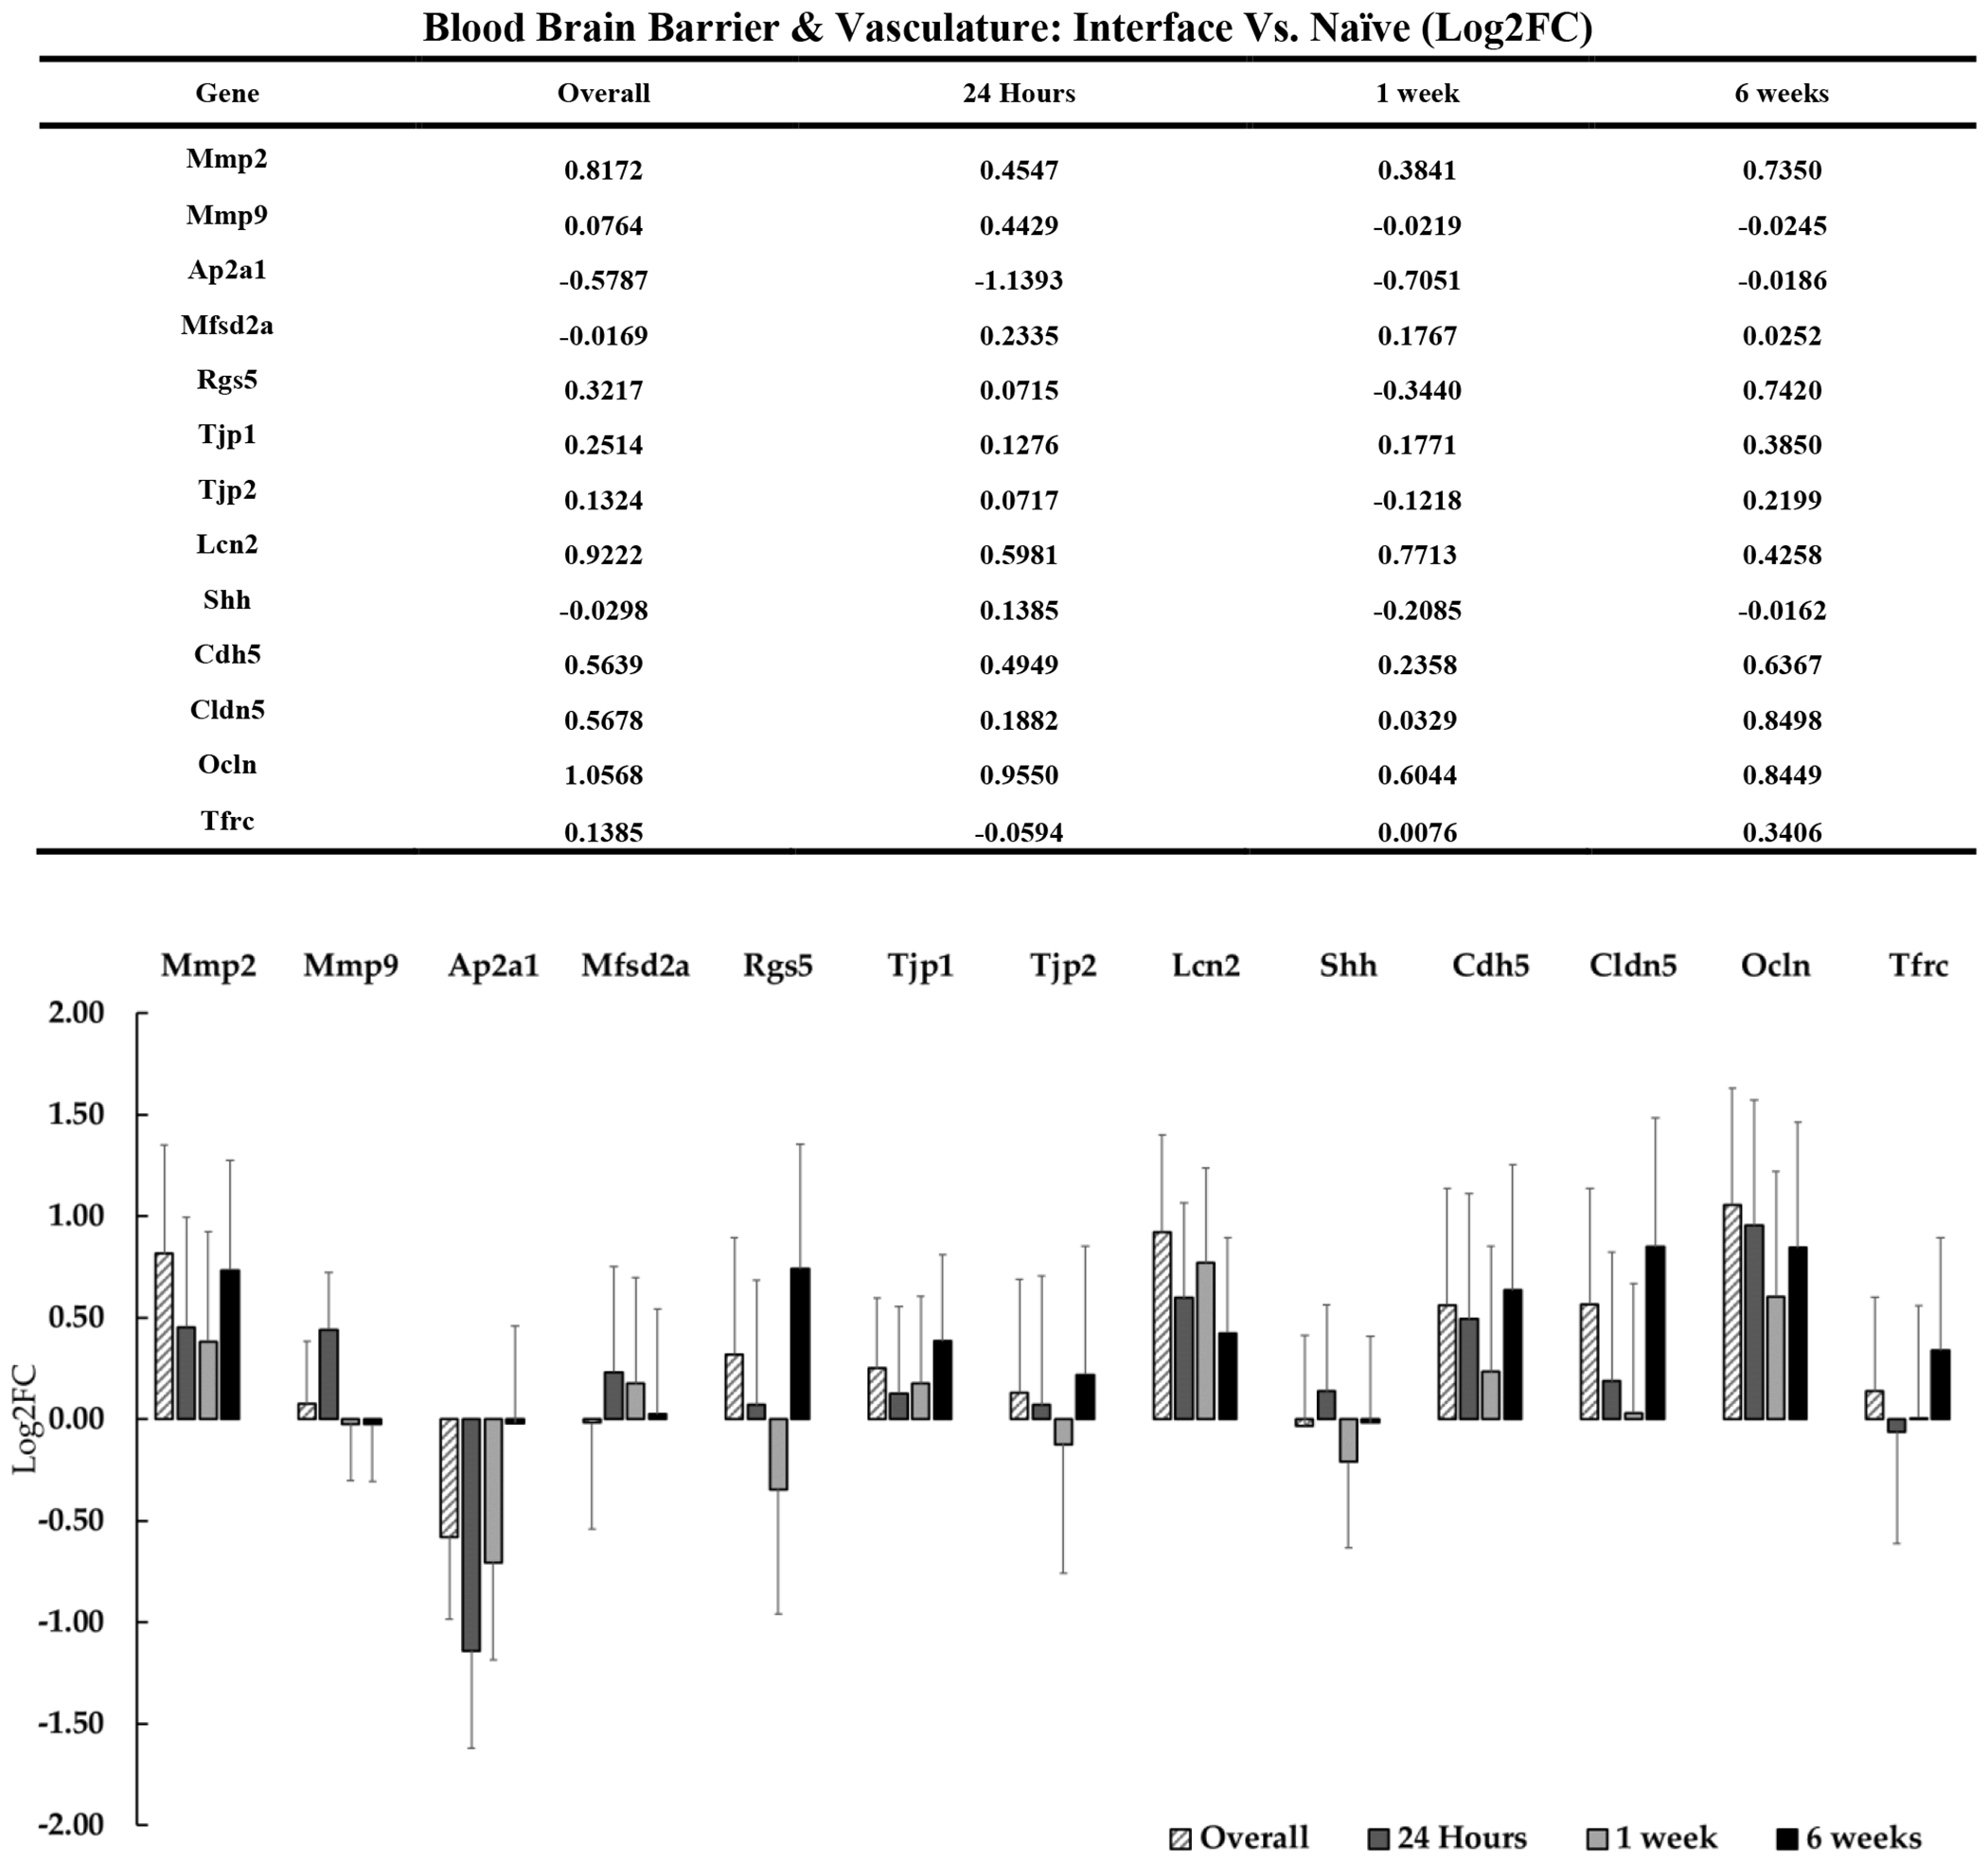
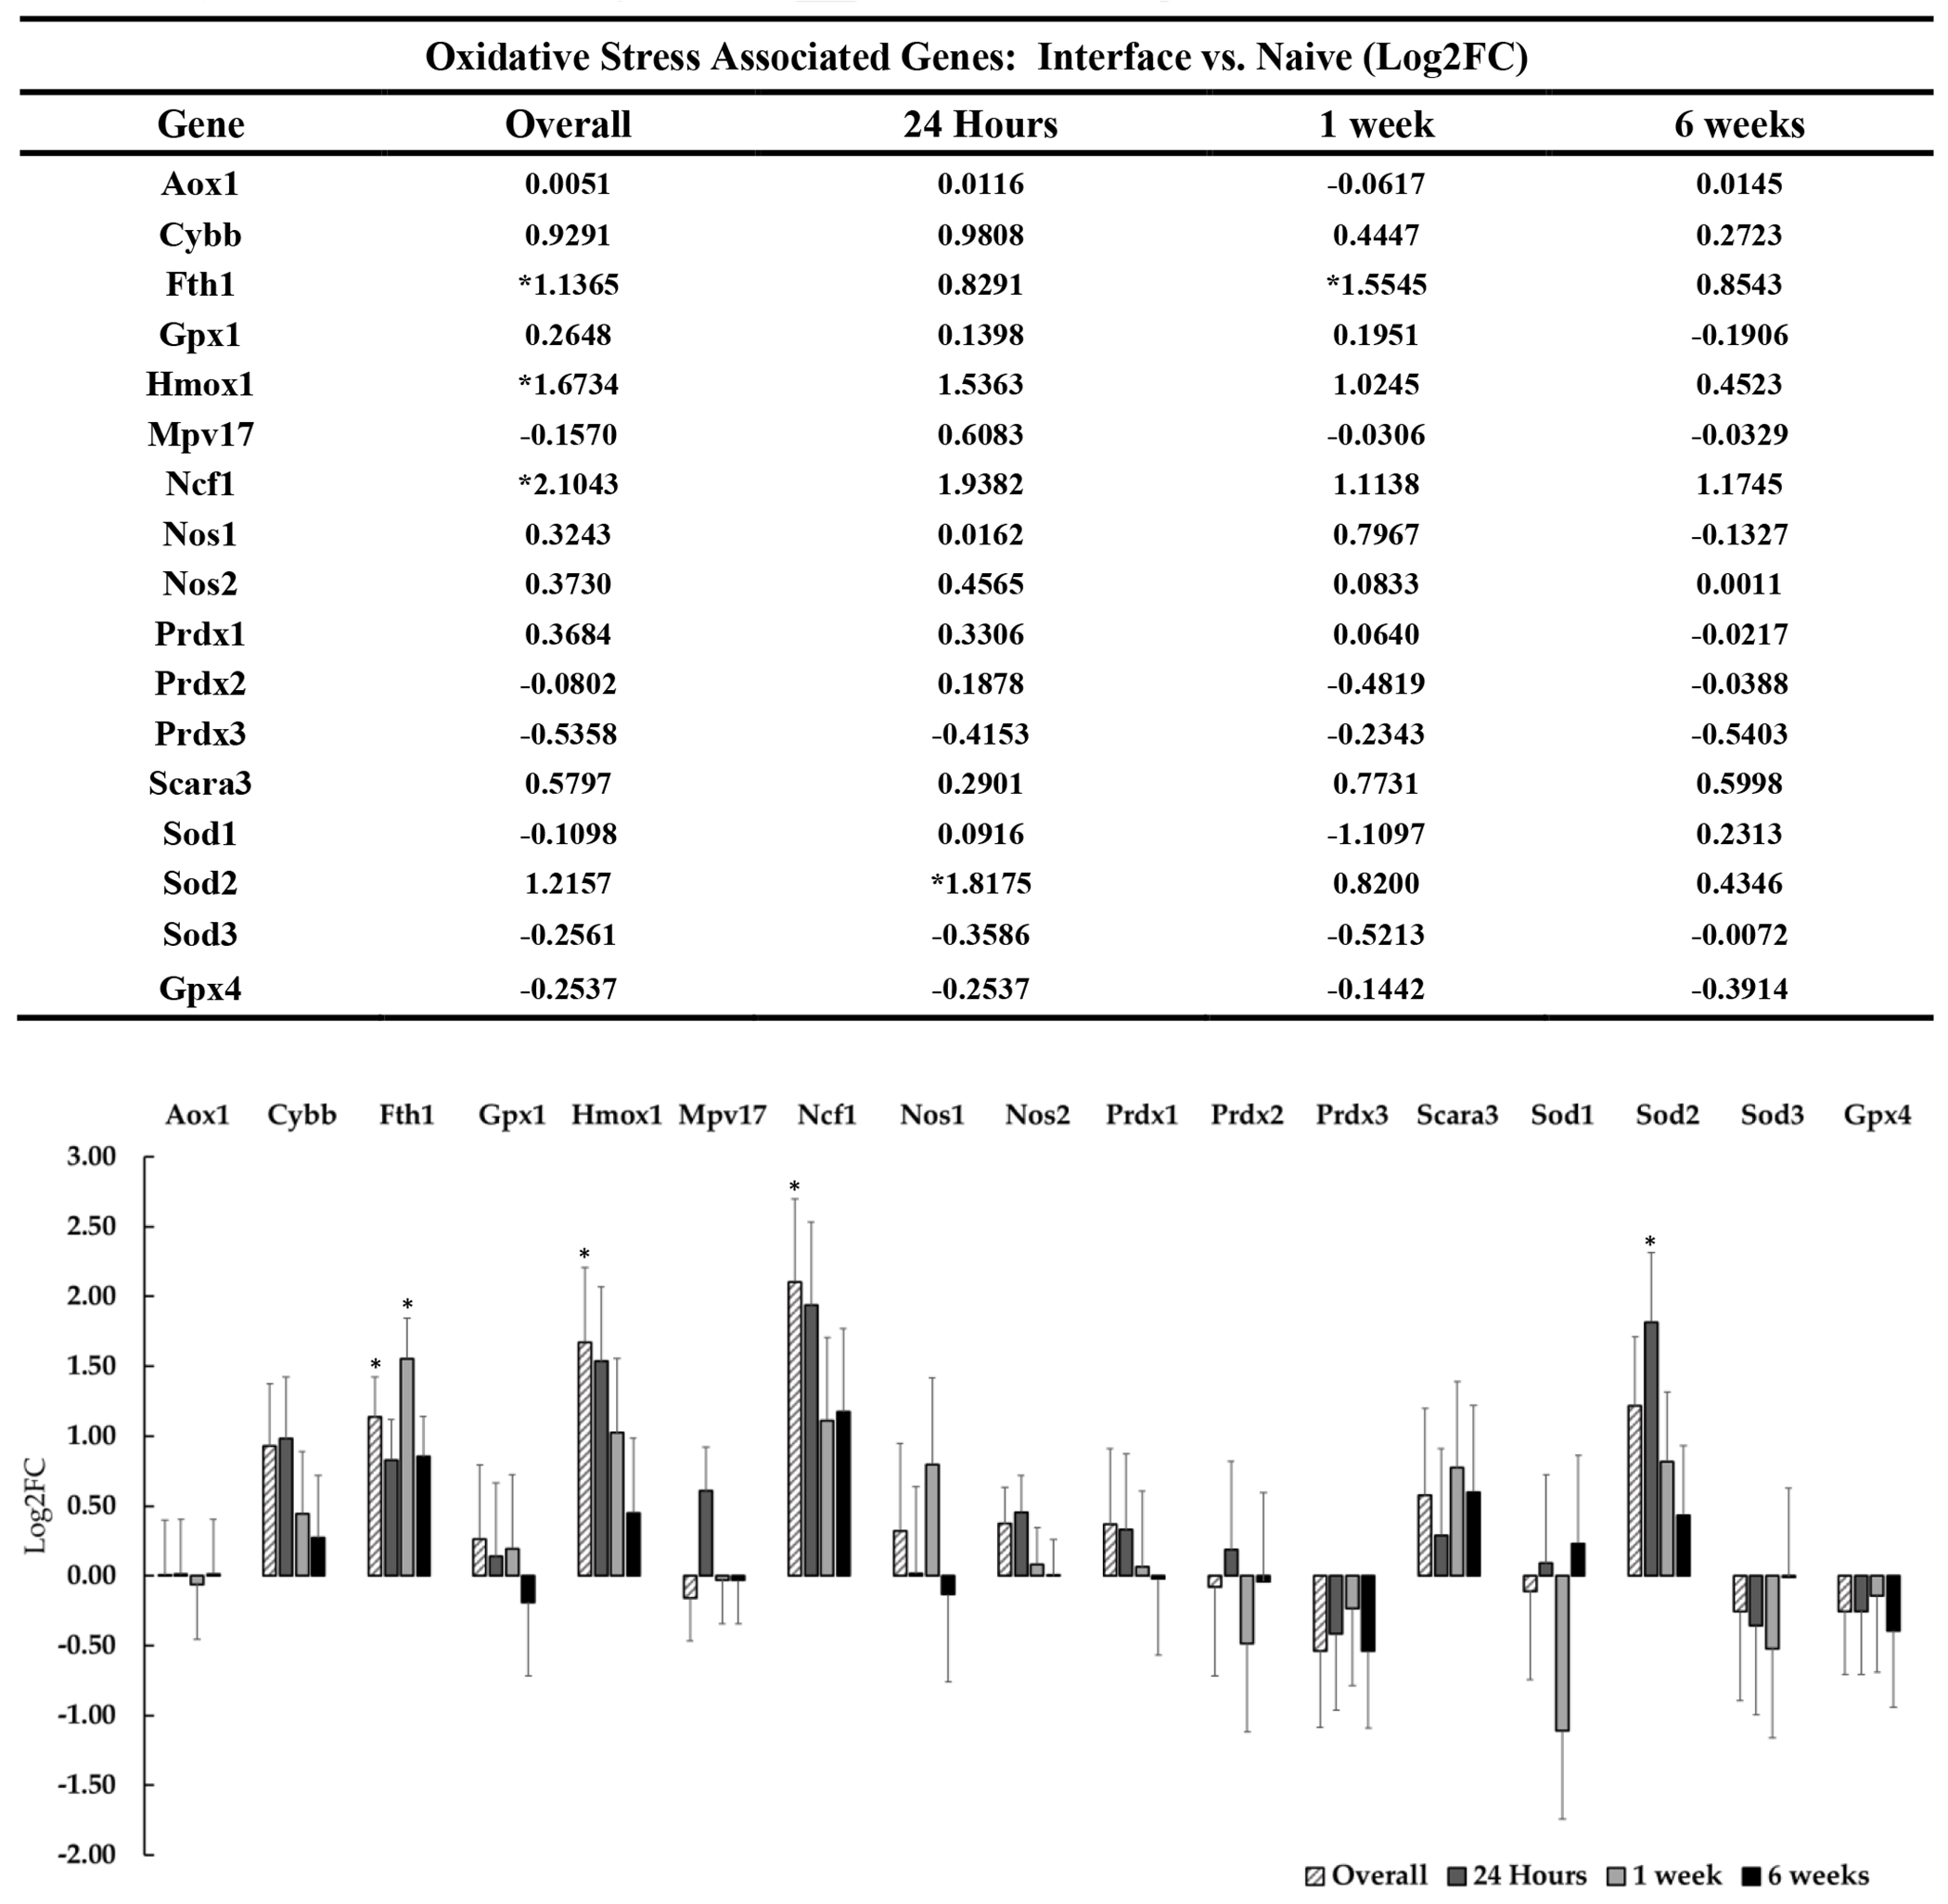
Objective.Intracortical brain interfaces are an ever evolving technology with growing potential for clinical and research applications. The chronic tissue response to these devices traditionally has been characterized by glial scarring, inflammation, oxidative stress, neuronal loss, and blood-brain barrier disruptions. The full complexity of the tissue response to implanted devices is still under investigation.Approach.In this study, we have utilized RNA-sequencing to identify the spatiotemporal gene expression patterns in interfacial (within 100µm) and distal (500µm from implant) brain tissue around implanted silicon microelectrode arrays. Naïve, unimplanted tissue served as a control.Main results.The data revealed significant overall differential expression (DE) in contrasts comparing interfacial tissue vs naïve (157 DE genes), interfacial vs distal (94 DE genes), and distal vs naïve tissues (21 DE genes). Our results captured previously characterized mechanisms of the foreign body response, such as astroglial encapsulation, as well as novel mechanisms which have not yet been characterized in the context of indwelling neurotechnologies. In particular, we have observed perturbations in multiple neuron-associated genes which potentially impact the intrinsic function and structure of neurons at the device interface. In addition to neuron-associated genes, the results presented in this study identified significant DE in genes which are associated with oligodendrocyte, microglia, and astrocyte involvement in the chronic tissue response.Significance. The results of this study increase the fundamental understanding of the complexity of tissue response in the brain and provide an expanded toolkit for future investigation into the bio-integration of implanted electronics with tissues in the central nervous system.
Keywords: Michigan probe; RNA-sequencing; inflammation; neural prostheses; tissue response.
Creative Commons Attribution license.
Figures
Similar articles
-
Spatiotemporal expression of RNA-seq identified proteins at the electrode interface.Acta Biomater. 2023 Jul 1;164:209-222. doi: 10.1016/j.actbio.2023.04.028. Epub 2023 Apr 26. Acta Biomater. 2023. PMID: 37116634
-
Differential expression of genes involved in the chronic response to intracortical microelectrodes.Acta Biomater. 2023 Oct 1;169:348-362. doi: 10.1016/j.actbio.2023.07.038. Epub 2023 Jul 26. Acta Biomater. 2023. PMID: 37507031 Free PMC article.
-
Ultrasoft microwire neural electrodes improve chronic tissue integration.Acta Biomater. 2017 Apr 15;53:46-58. doi: 10.1016/j.actbio.2017.02.010. Epub 2017 Feb 6. Acta Biomater. 2017. PMID: 28185910 Free PMC article.
-
Thinking Small: Progress on Microscale Neurostimulation Technology.Neuromodulation. 2017 Dec;20(8):745-752. doi: 10.1111/ner.12716. Epub 2017 Oct 27. Neuromodulation. 2017. PMID: 29076214 Free PMC article. Review.
-
Regenerative Electrode Interfaces for Neural Prostheses.Tissue Eng Part B Rev. 2016 Apr;22(2):125-35. doi: 10.1089/ten.TEB.2015.0279. Epub 2015 Nov 23. Tissue Eng Part B Rev. 2016. PMID: 26421660 Review.
Cited by
-
Differential Co-Expression Analysis of RNA-Seq Data Reveals Novel Potential Biomarkers of Device-Tissue Interaction.Annu Int Conf IEEE Eng Med Biol Soc. 2022 Jul;2022:3072-3076. doi: 10.1109/EMBC48229.2022.9871437. Annu Int Conf IEEE Eng Med Biol Soc. 2022. PMID: 36085767 Free PMC article.
-
Fabrication Methods and Chronic In Vivo Validation of Mechanically Adaptive Microfluidic Intracortical Devices.Micromachines (Basel). 2023 May 9;14(5):1015. doi: 10.3390/mi14051015. Micromachines (Basel). 2023. PMID: 37241639 Free PMC article.
-
Bacteria invade the brain following intracortical microelectrode implantation, inducing gut-brain axis disruption and contributing to reduced microelectrode performance.Nat Commun. 2025 Feb 20;16(1):1829. doi: 10.1038/s41467-025-56979-4. Nat Commun. 2025. PMID: 39979293 Free PMC article.
-
Effects of iron accumulation and its chelation on oxidative stress in intracortical implants.Acta Biomater. 2025 Jun 15;200:703-723. doi: 10.1016/j.actbio.2025.05.026. Epub 2025 May 10. Acta Biomater. 2025. PMID: 40355018
-
Down regulation of Cathepsin W is associated with poor prognosis in pancreatic cancer.Sci Rep. 2023 Oct 4;13(1):16678. doi: 10.1038/s41598-023-42928-y. Sci Rep. 2023. PMID: 37794108 Free PMC article.
References
-
- Laxton AW et al., “A phase I trial of deep brain stimulation of memory circuits in Alzheimer’s disease,” Ann. Neurol, vol. 68, no. 4, pp. 521–534, October. 2010. - PubMed
-
- Kuhn J et al., “Deep brain stimulation of the nucleus basalis of Meynert in Alzheimer’s dementia,” Mol. Psychiatry, vol. 20, no. 3, pp. 353–360, March. 2015. - PubMed
-
- Ho AL, Sussman ES, Pendharkar AV, Azagury DE, Bohon C, and Halpern CH, “Deep brain stimulation for obesity: rationale and approach to trial design,” Neurosurg. Focus, vol. 38, no. 6, p. E8, June. 2015. - PubMed
-
- Moore DR and Shannon RV, “Beyond cochlear implants: awakening the deafened brain,” Nat. Neurosci, vol. 12, no. 6, pp. 686–691, June. 2009. - PubMed
Publication types
MeSH terms
Substances
Grants and funding
LinkOut - more resources
Full Text Sources
Other Literature Sources