. 2021 May;593(7860):564-569.
doi: 10.1038/s41586-021-03475-6. Epub 2021 Mar 29.

The spatial landscape of lung pathology during COVID-19 progression

Affiliations

The spatial landscape of lung pathology during COVID-19 progression

André F Rendeiro et al. Nature. 2021 May.

Abstract

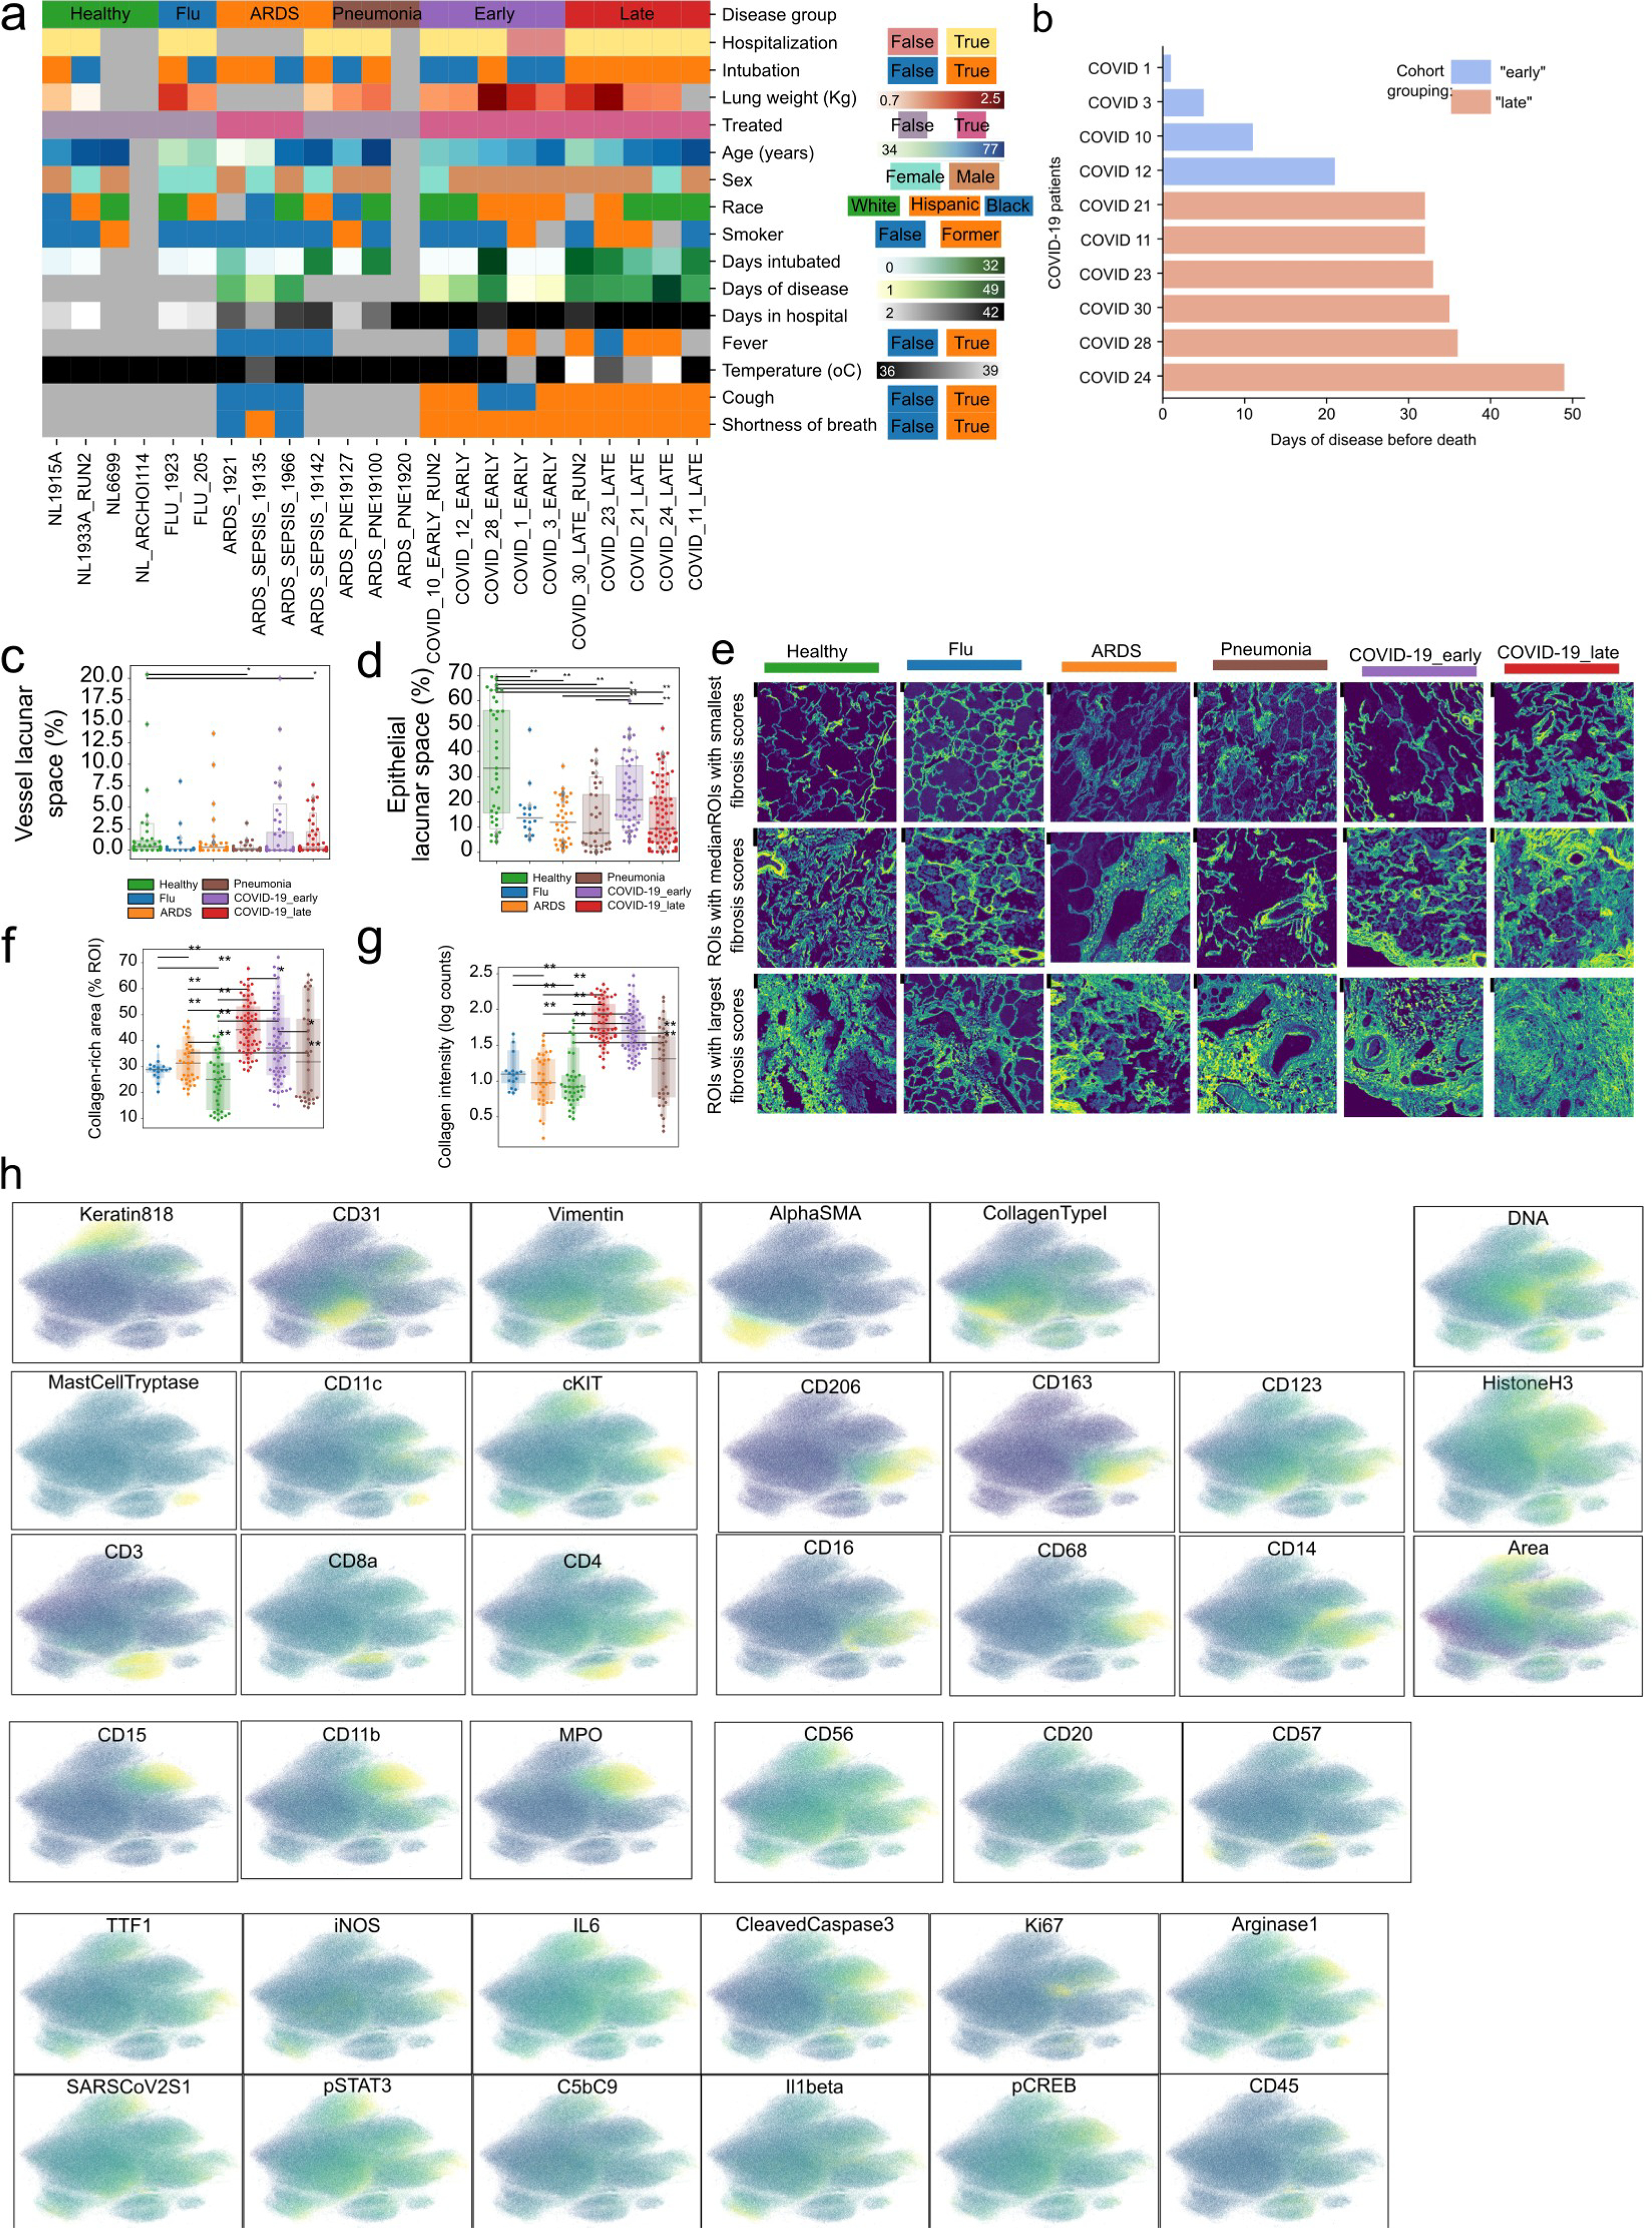
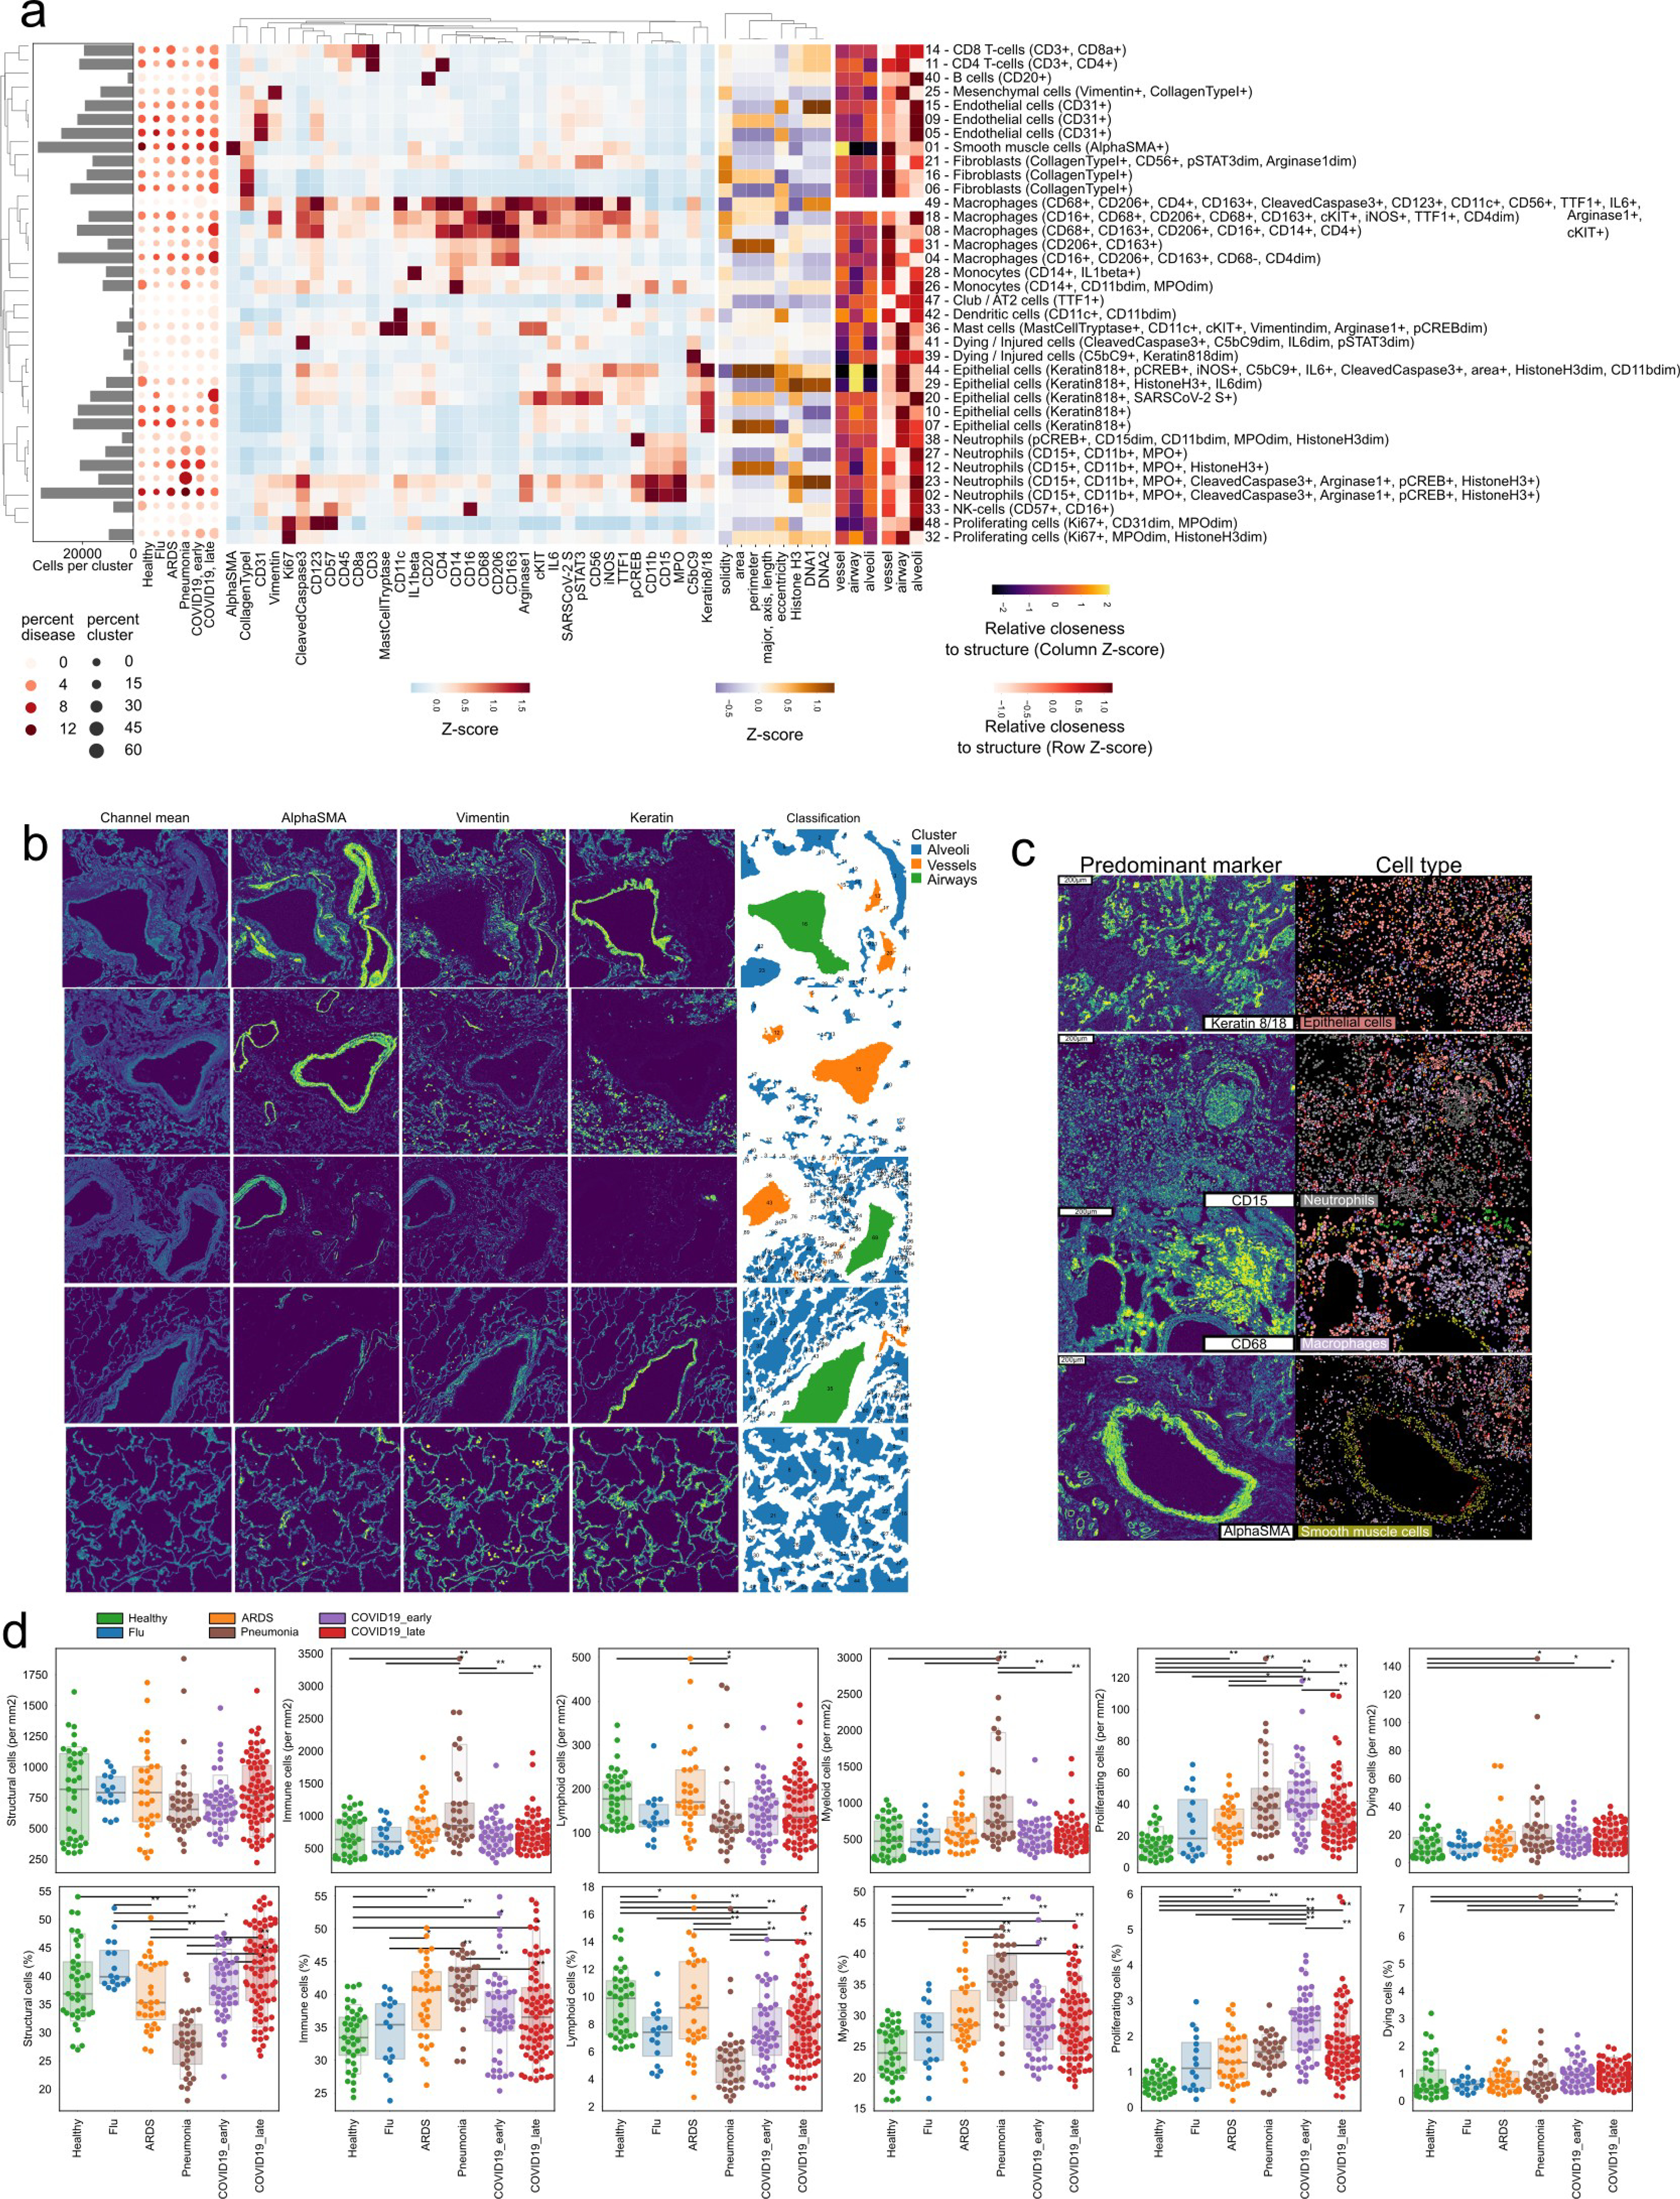
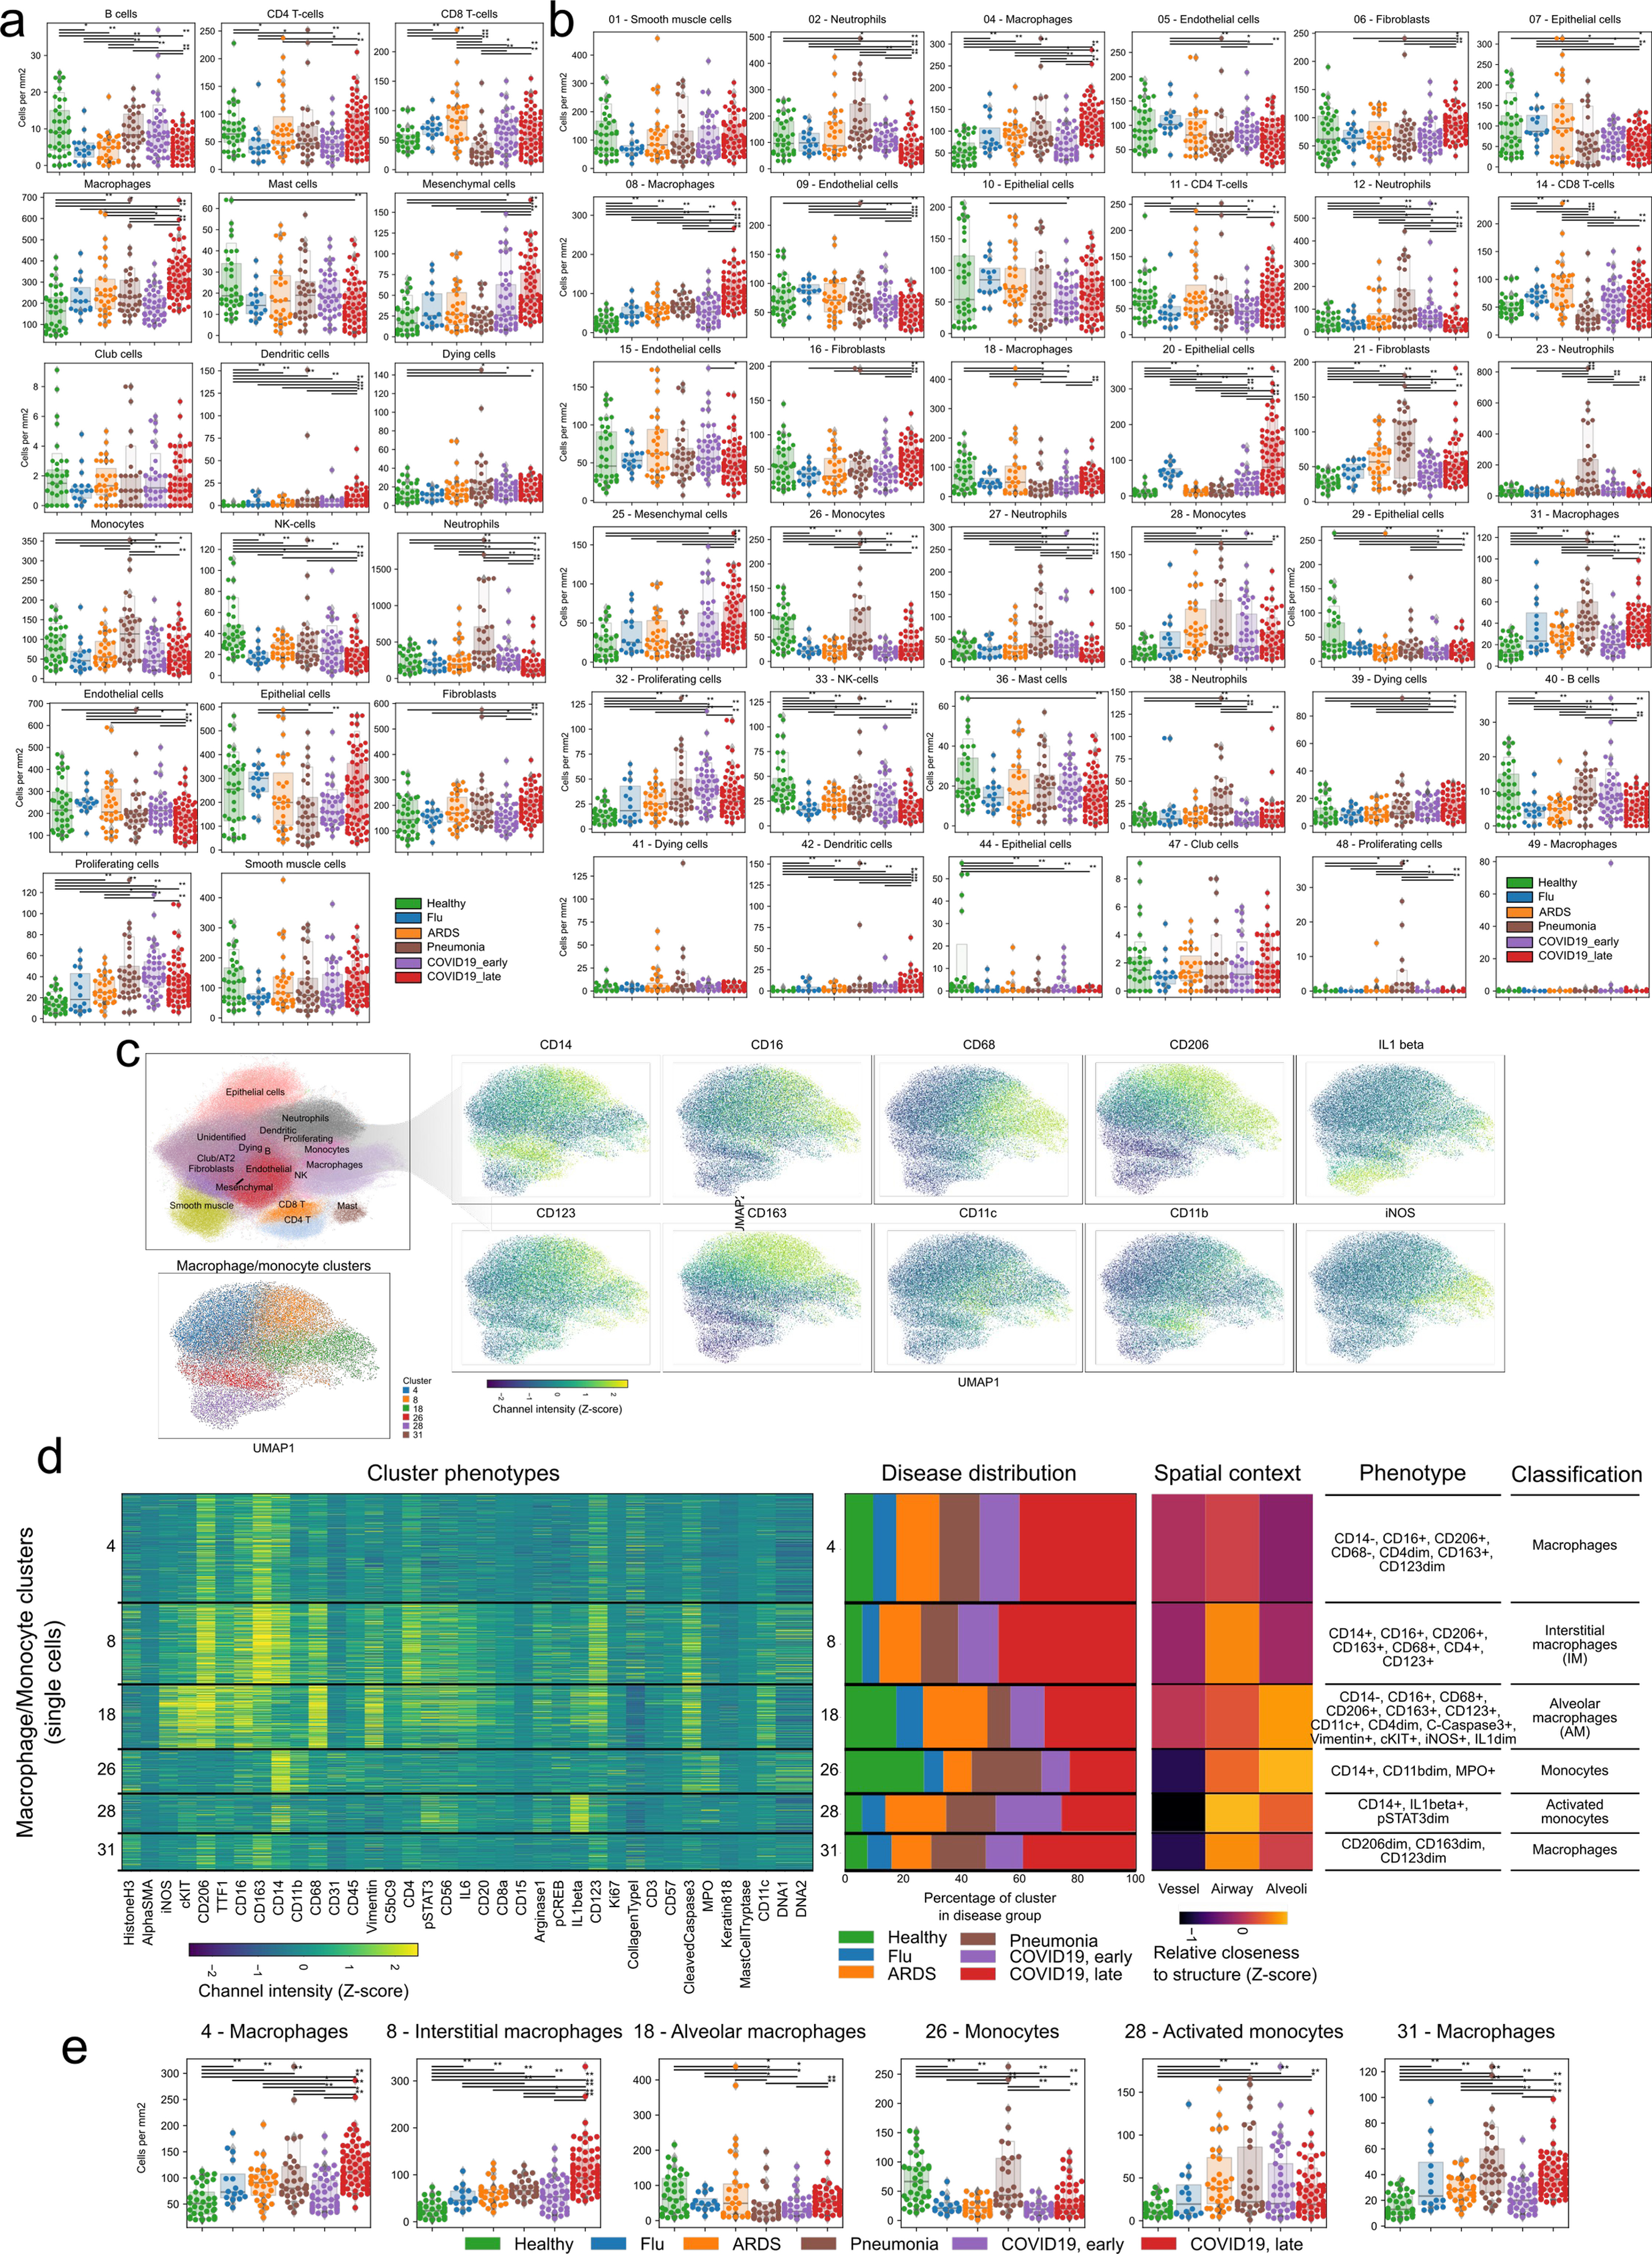
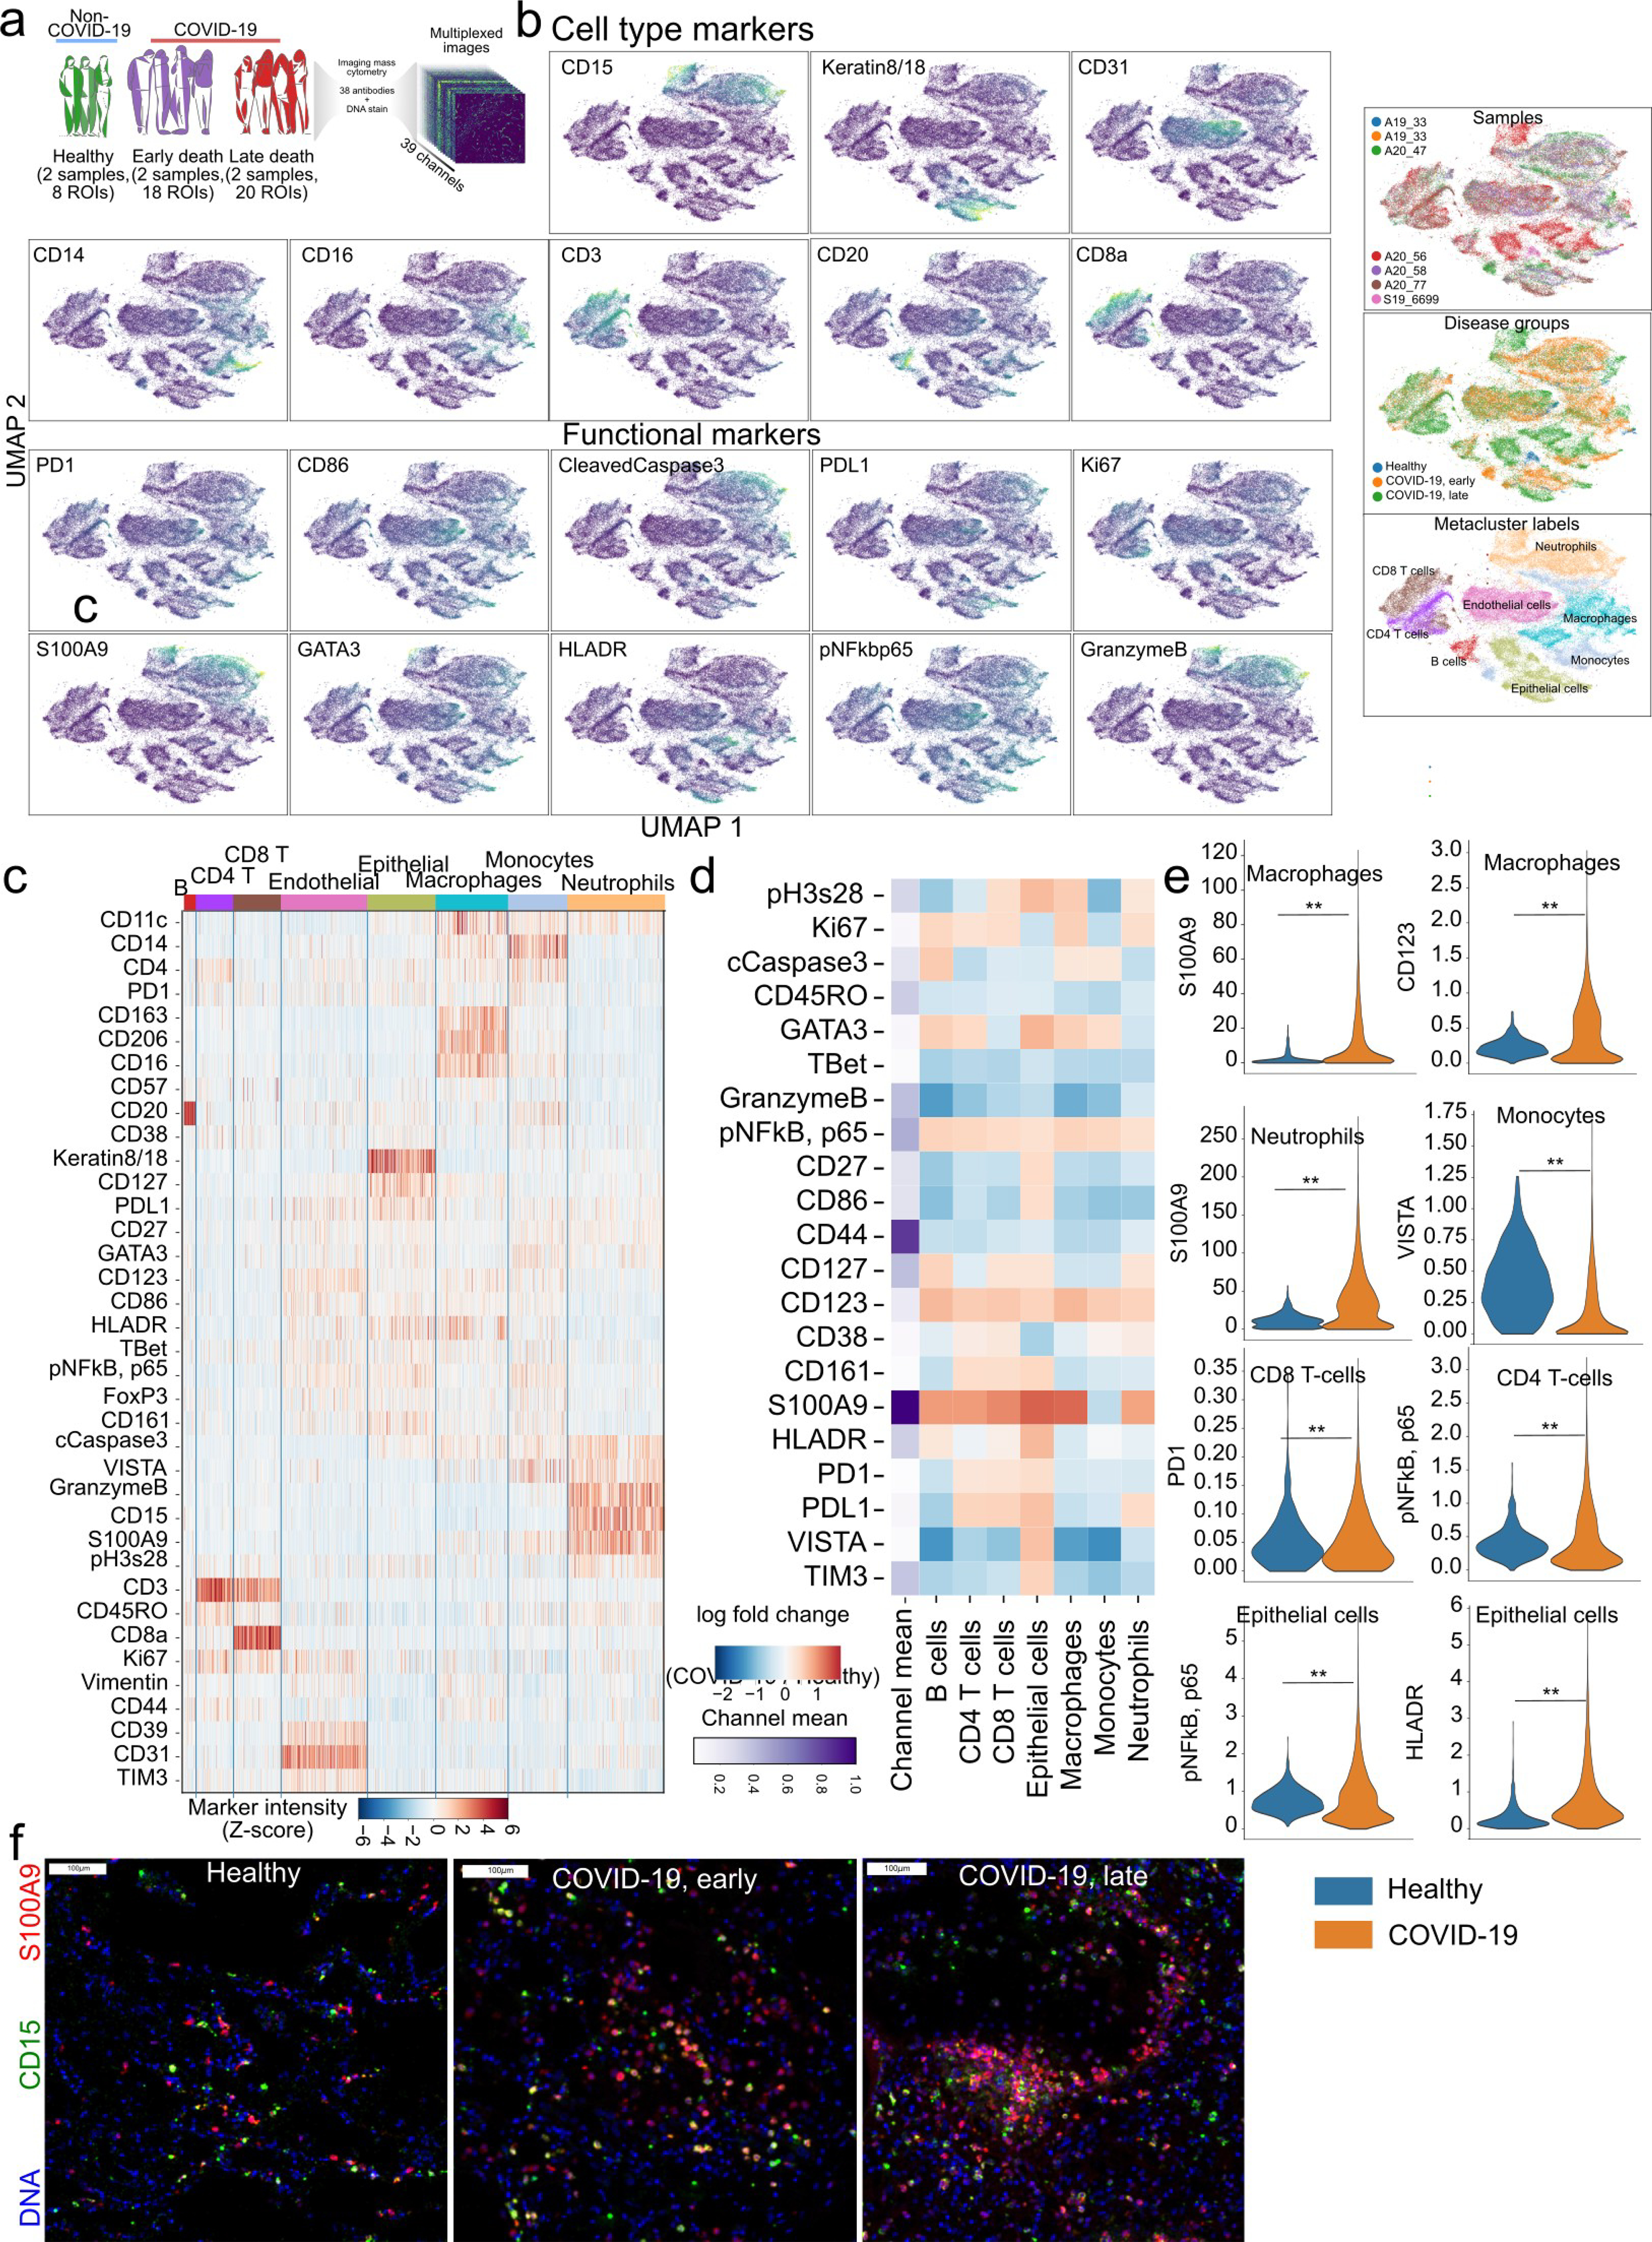
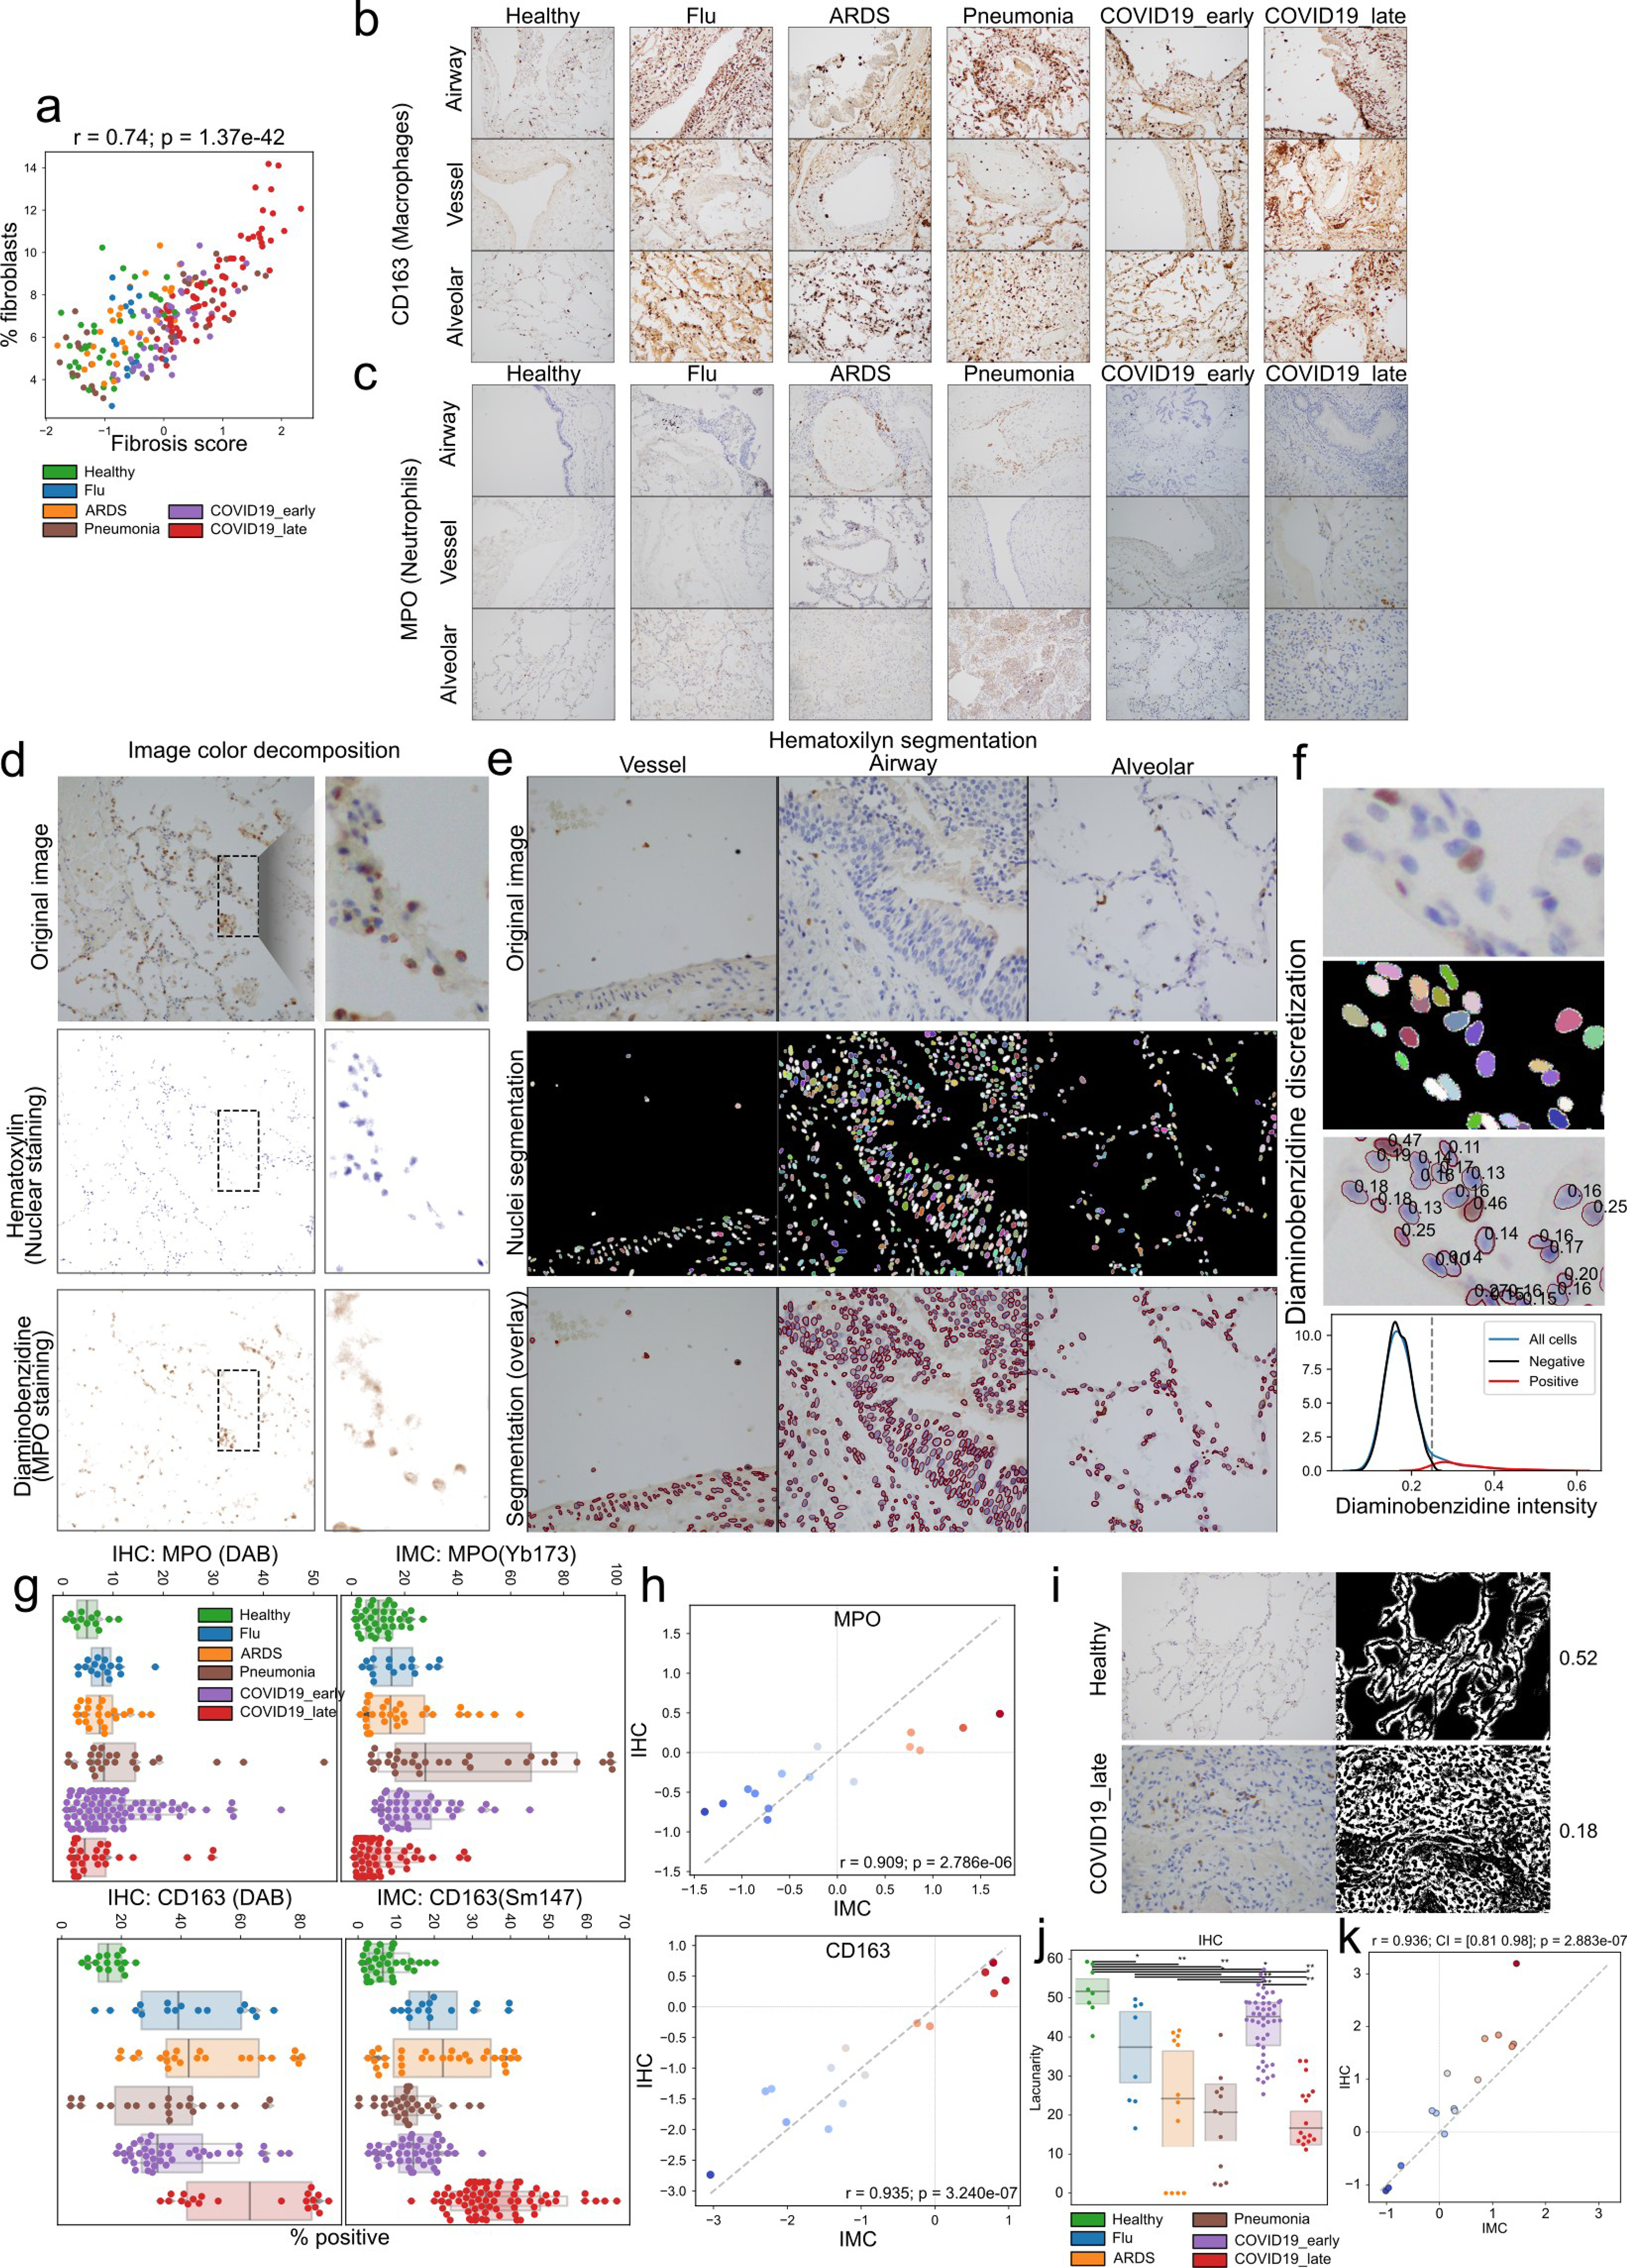
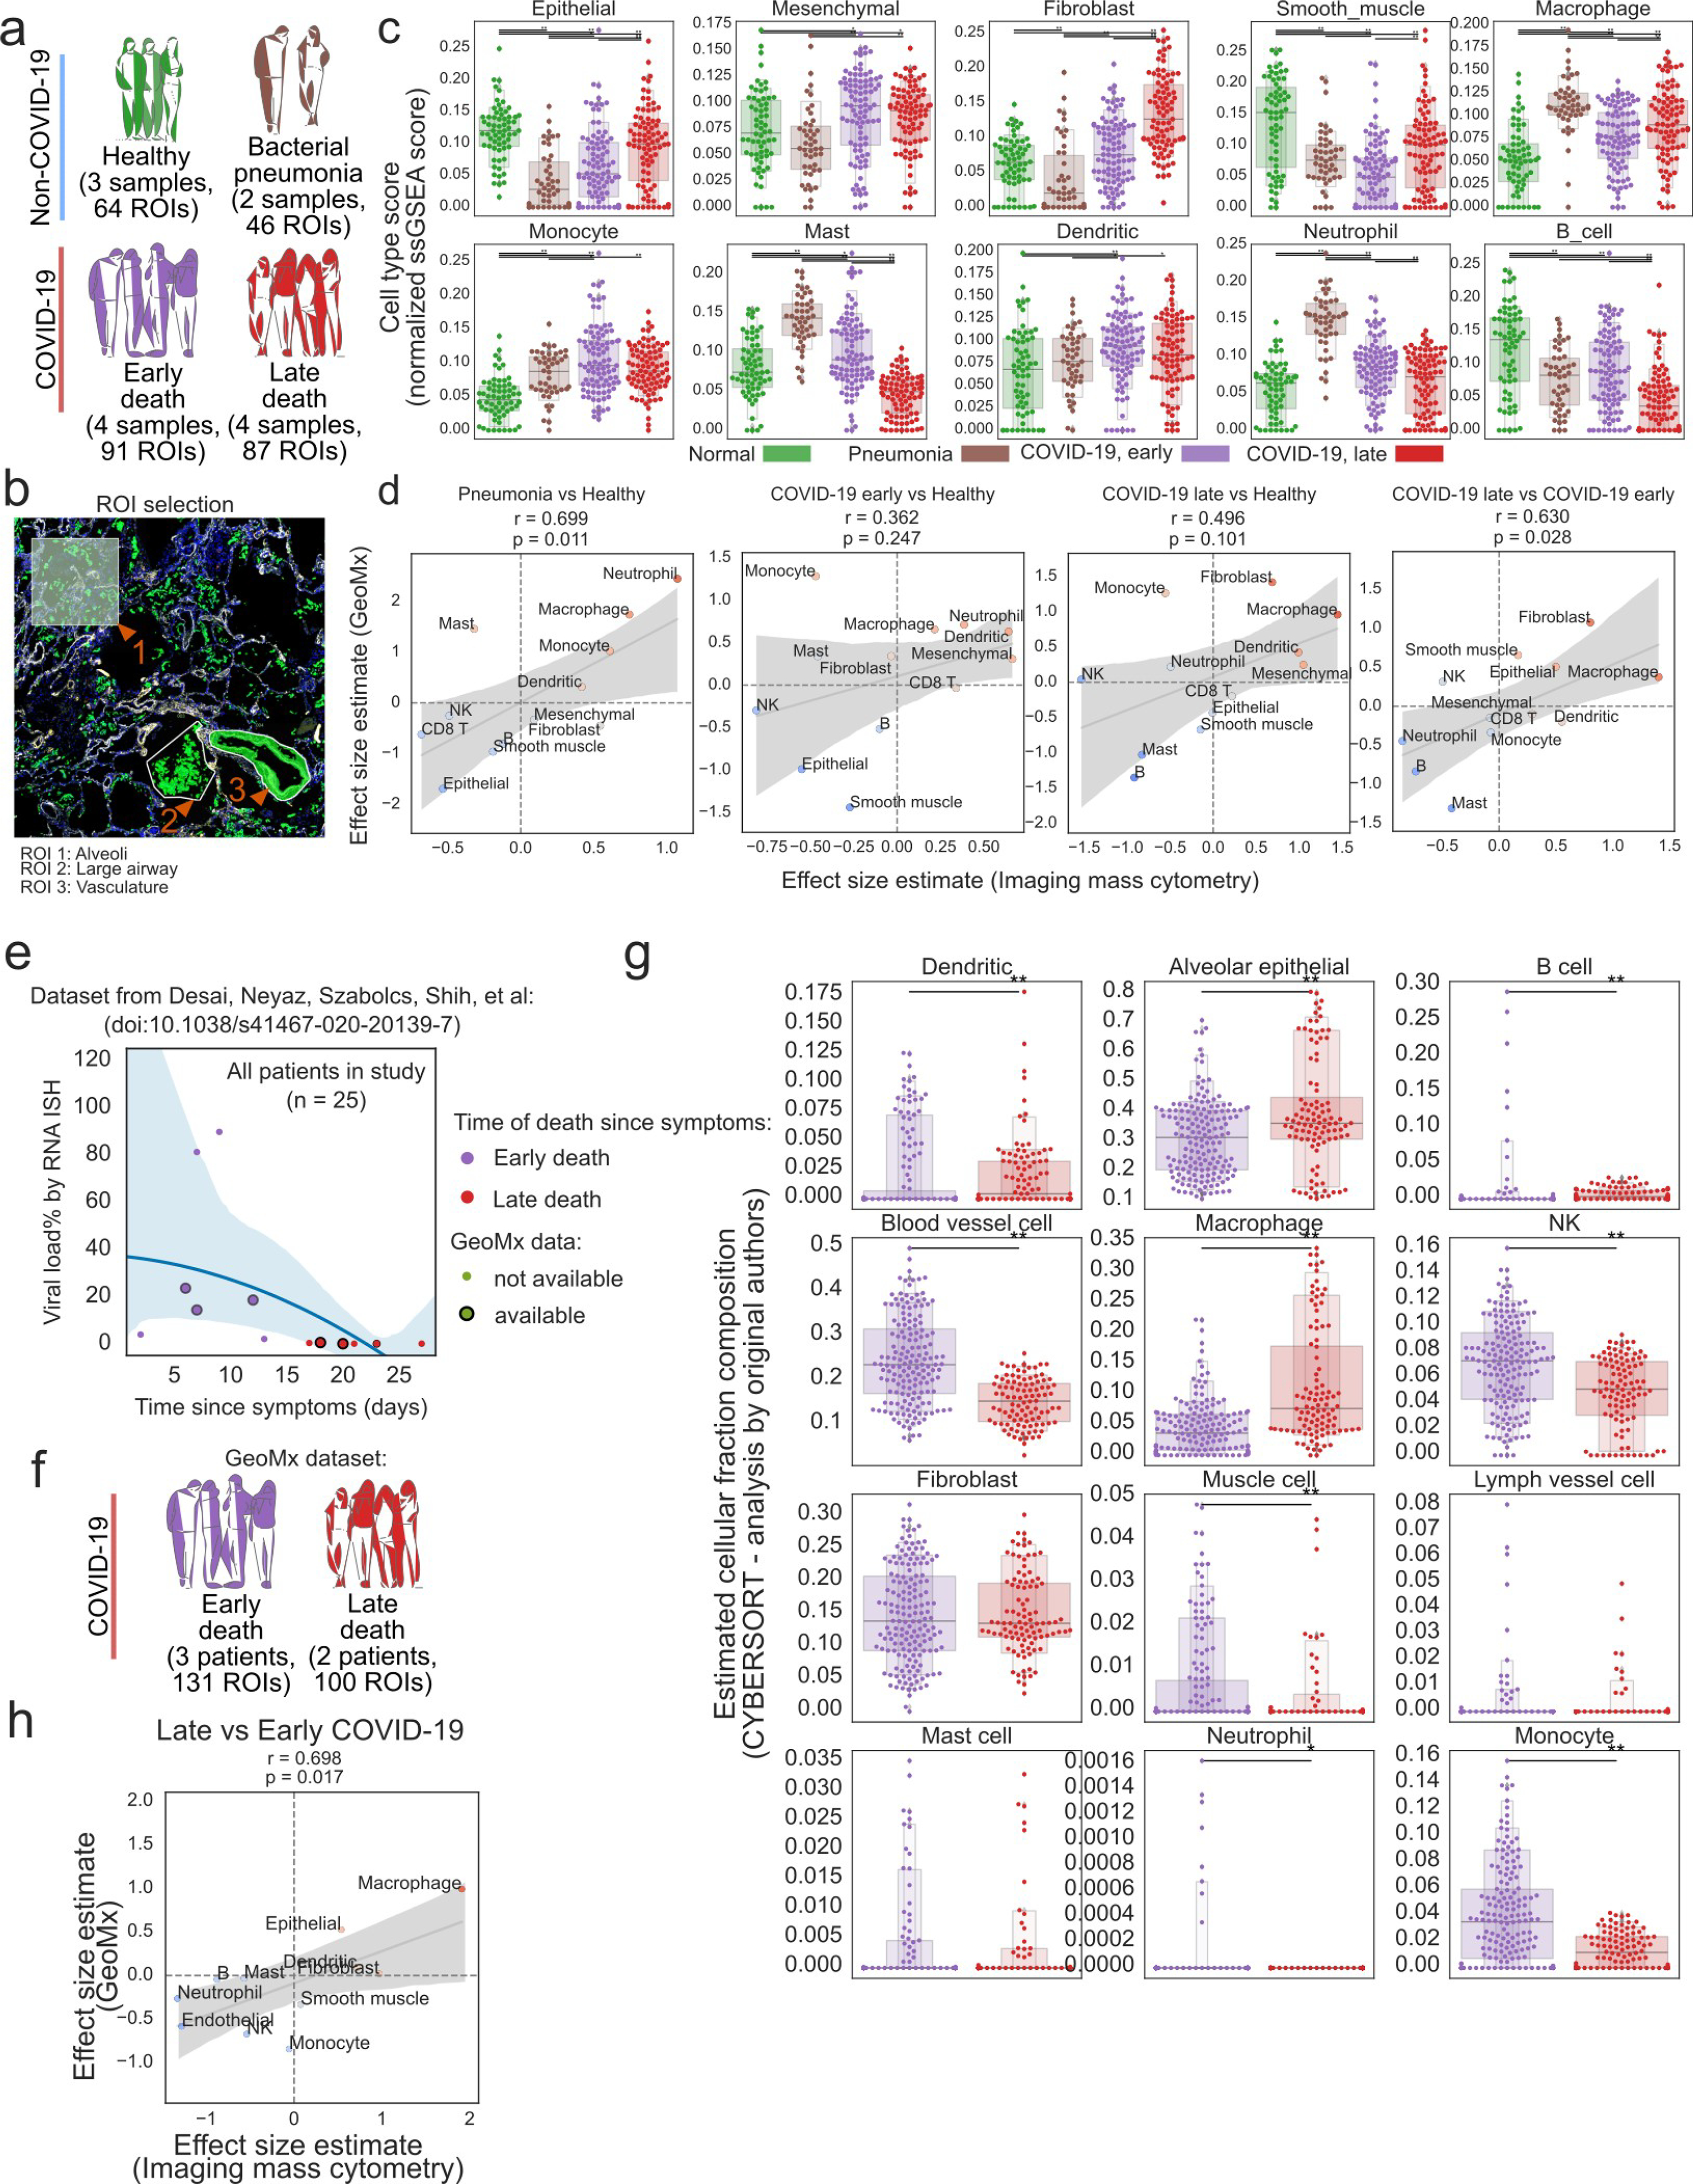
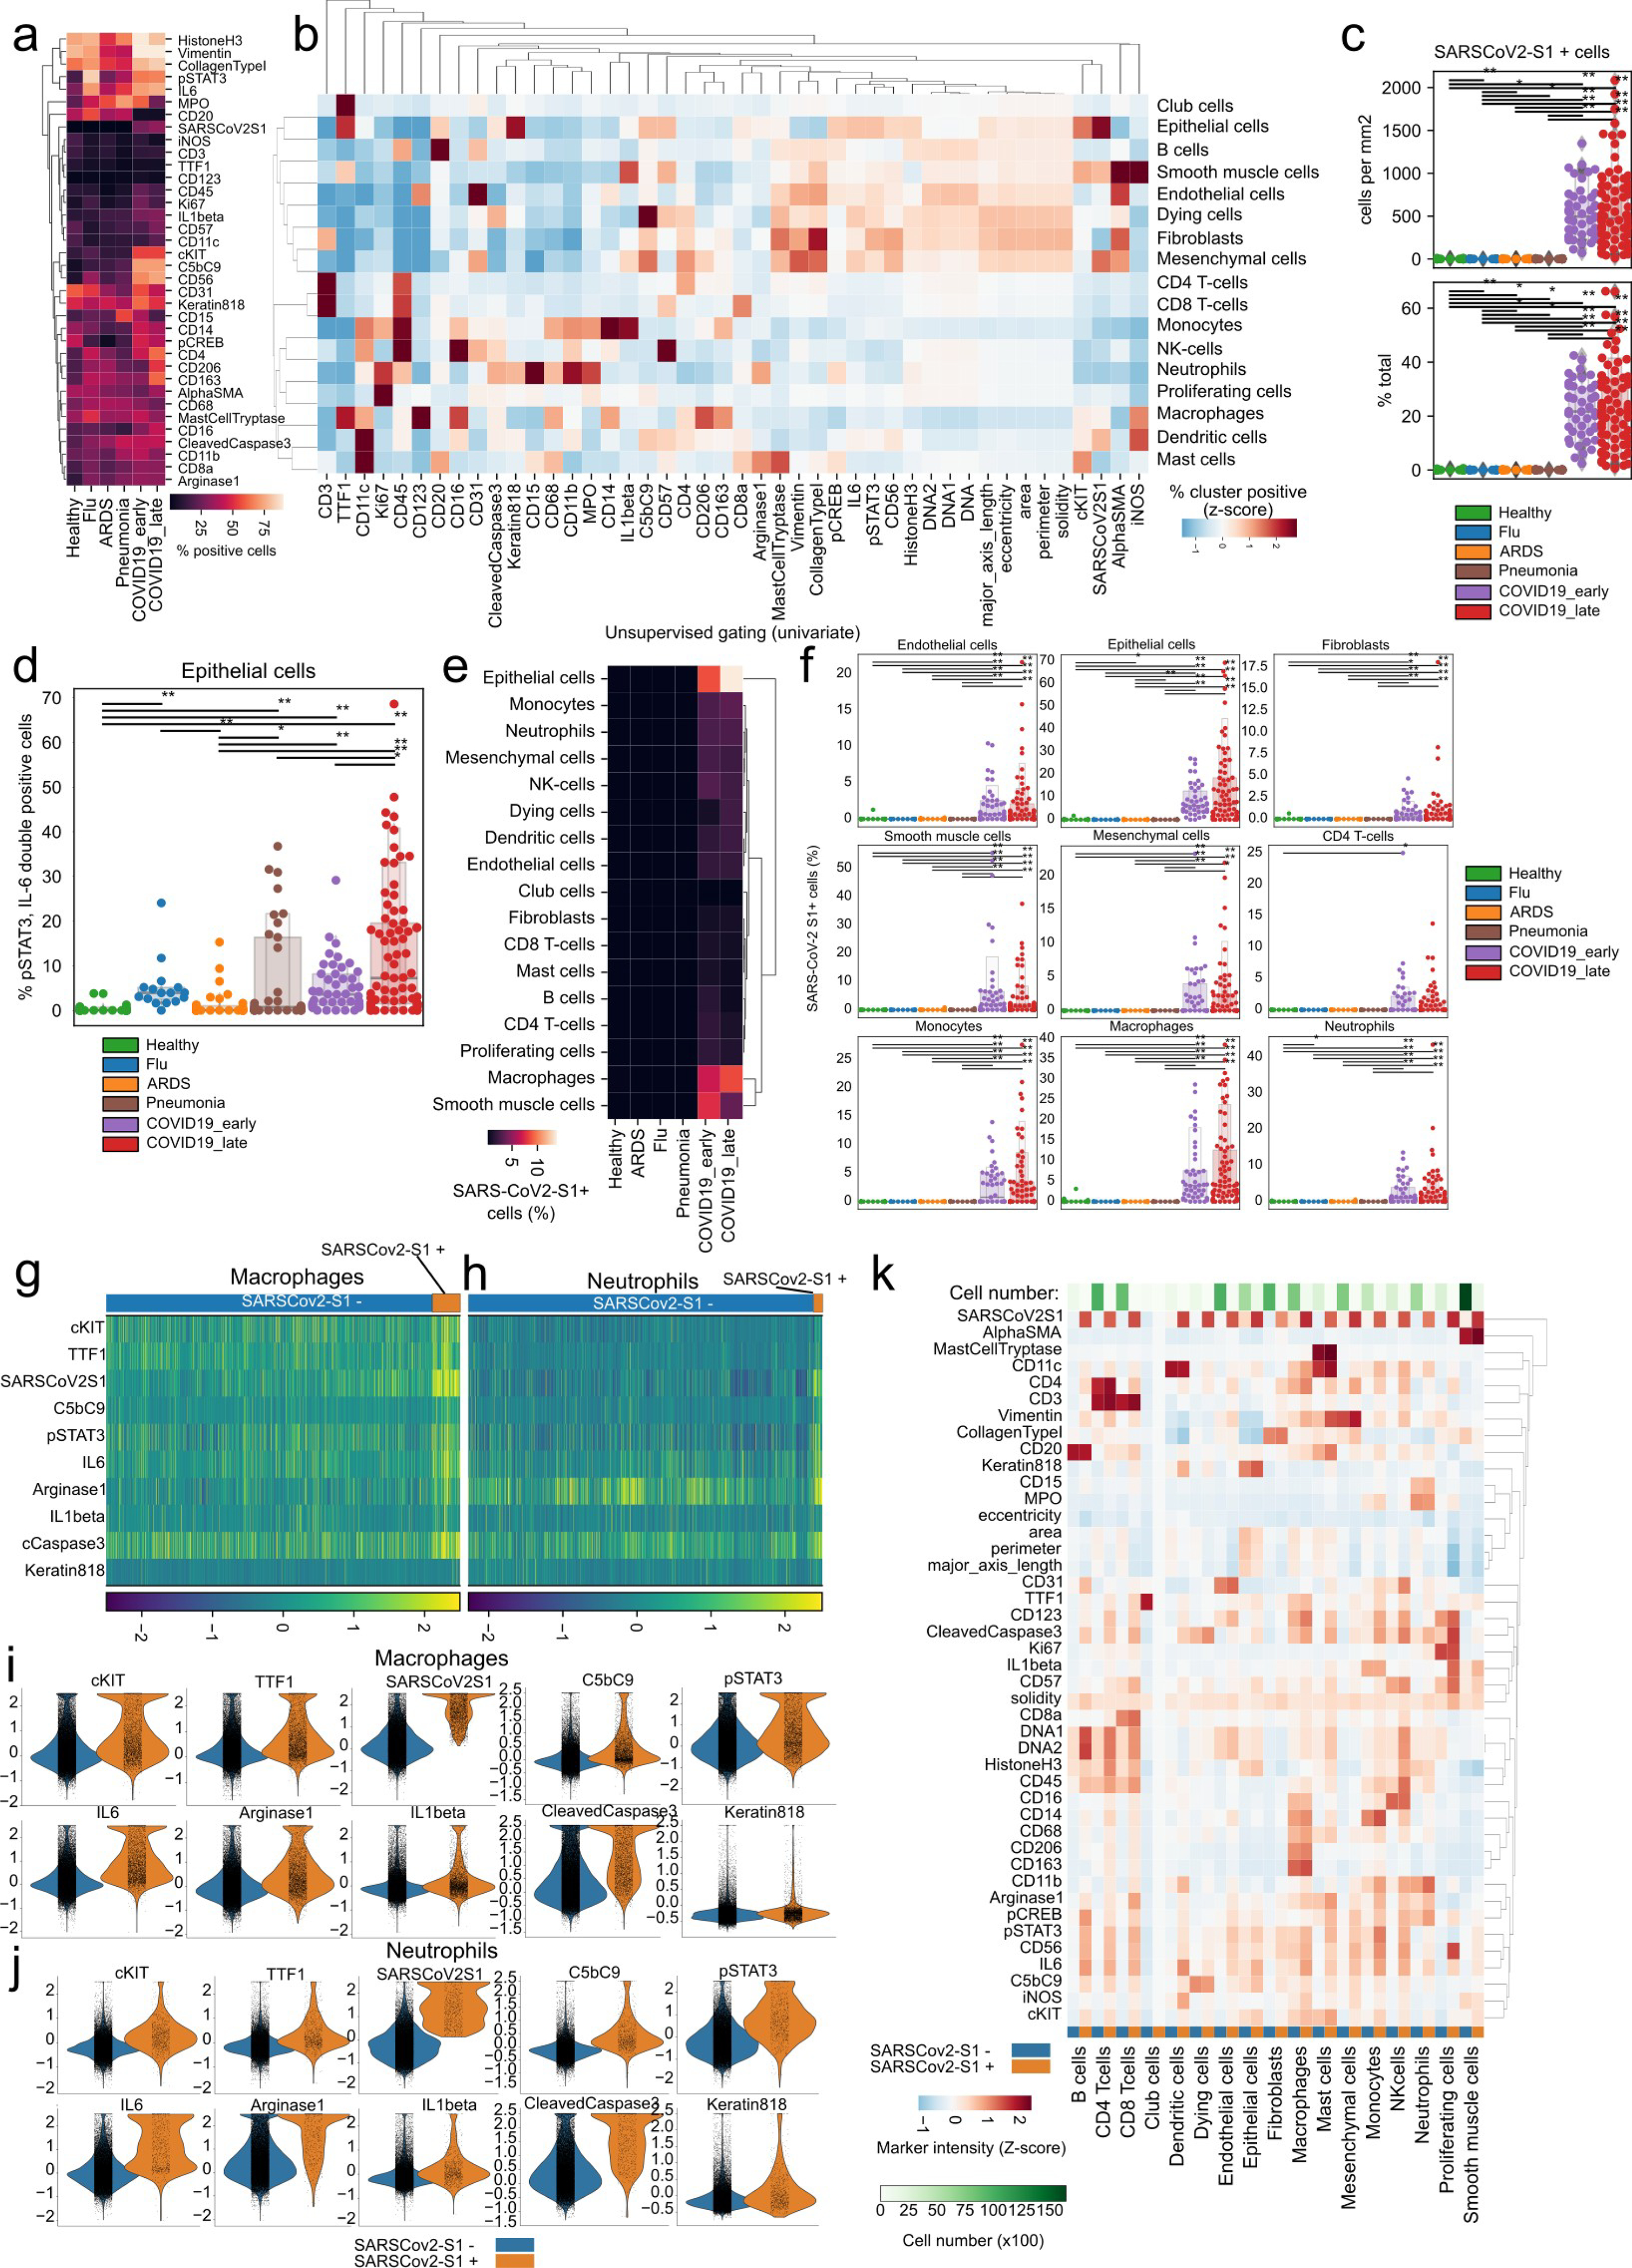
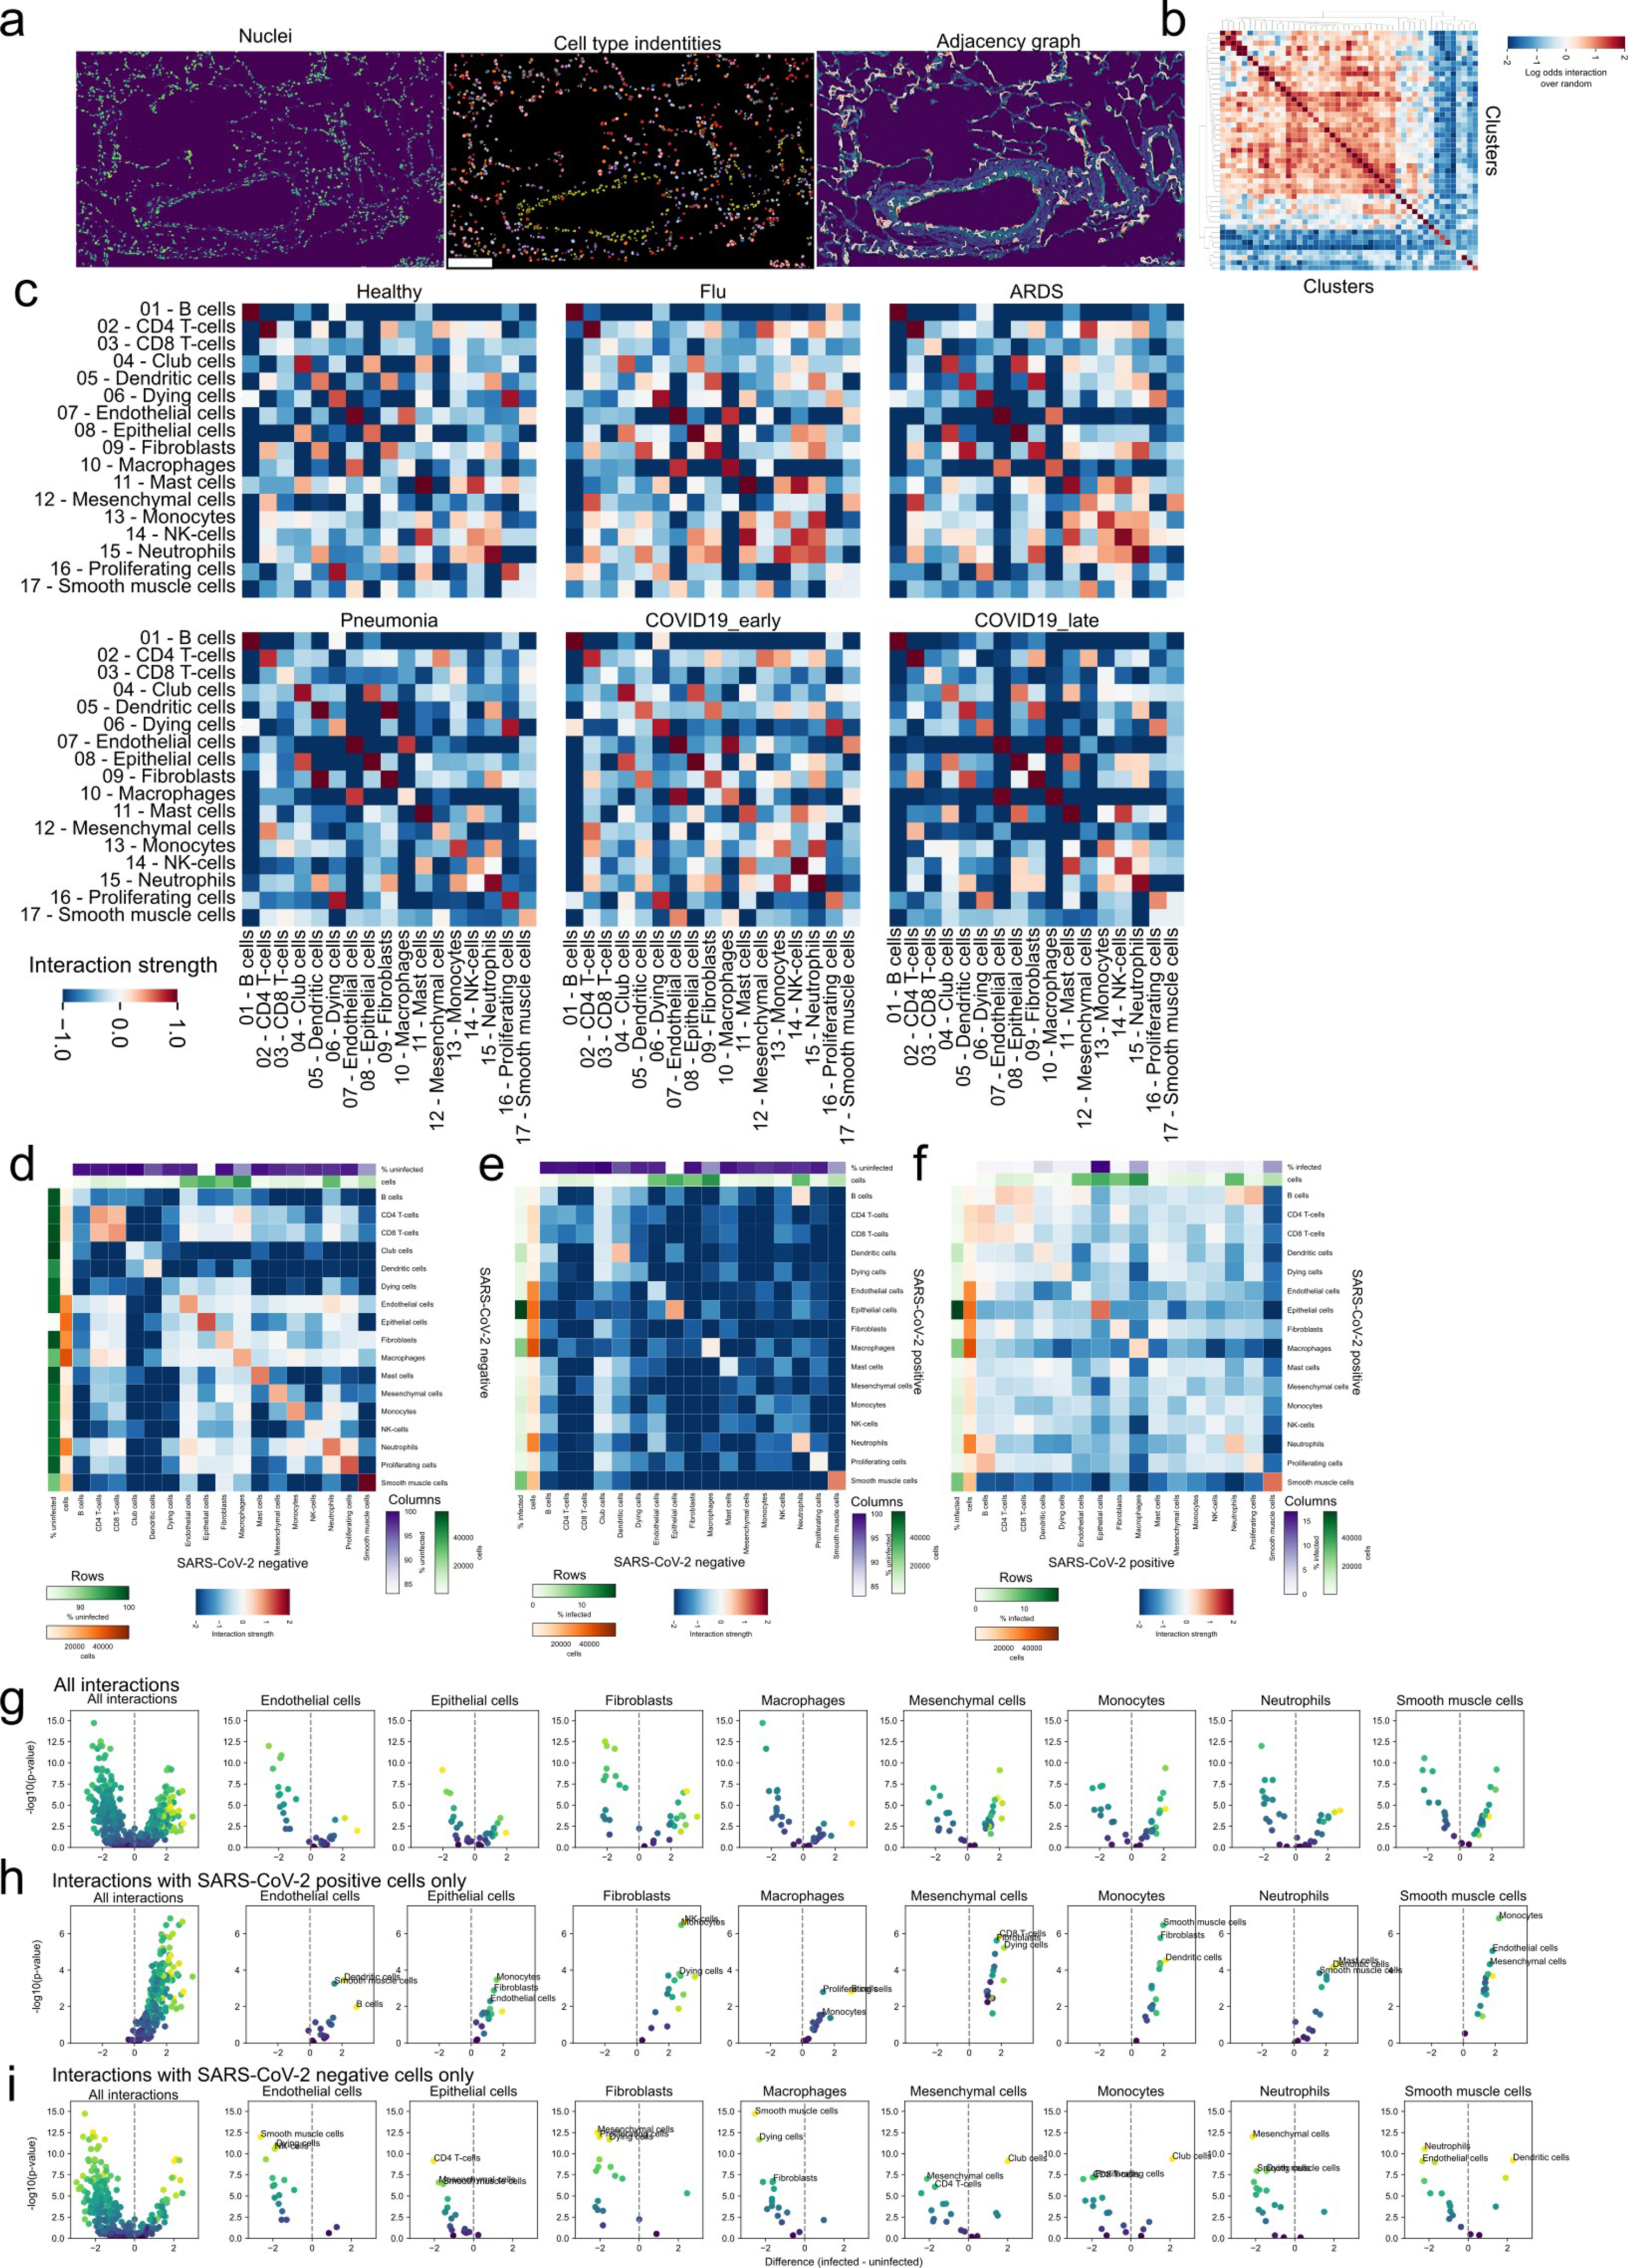
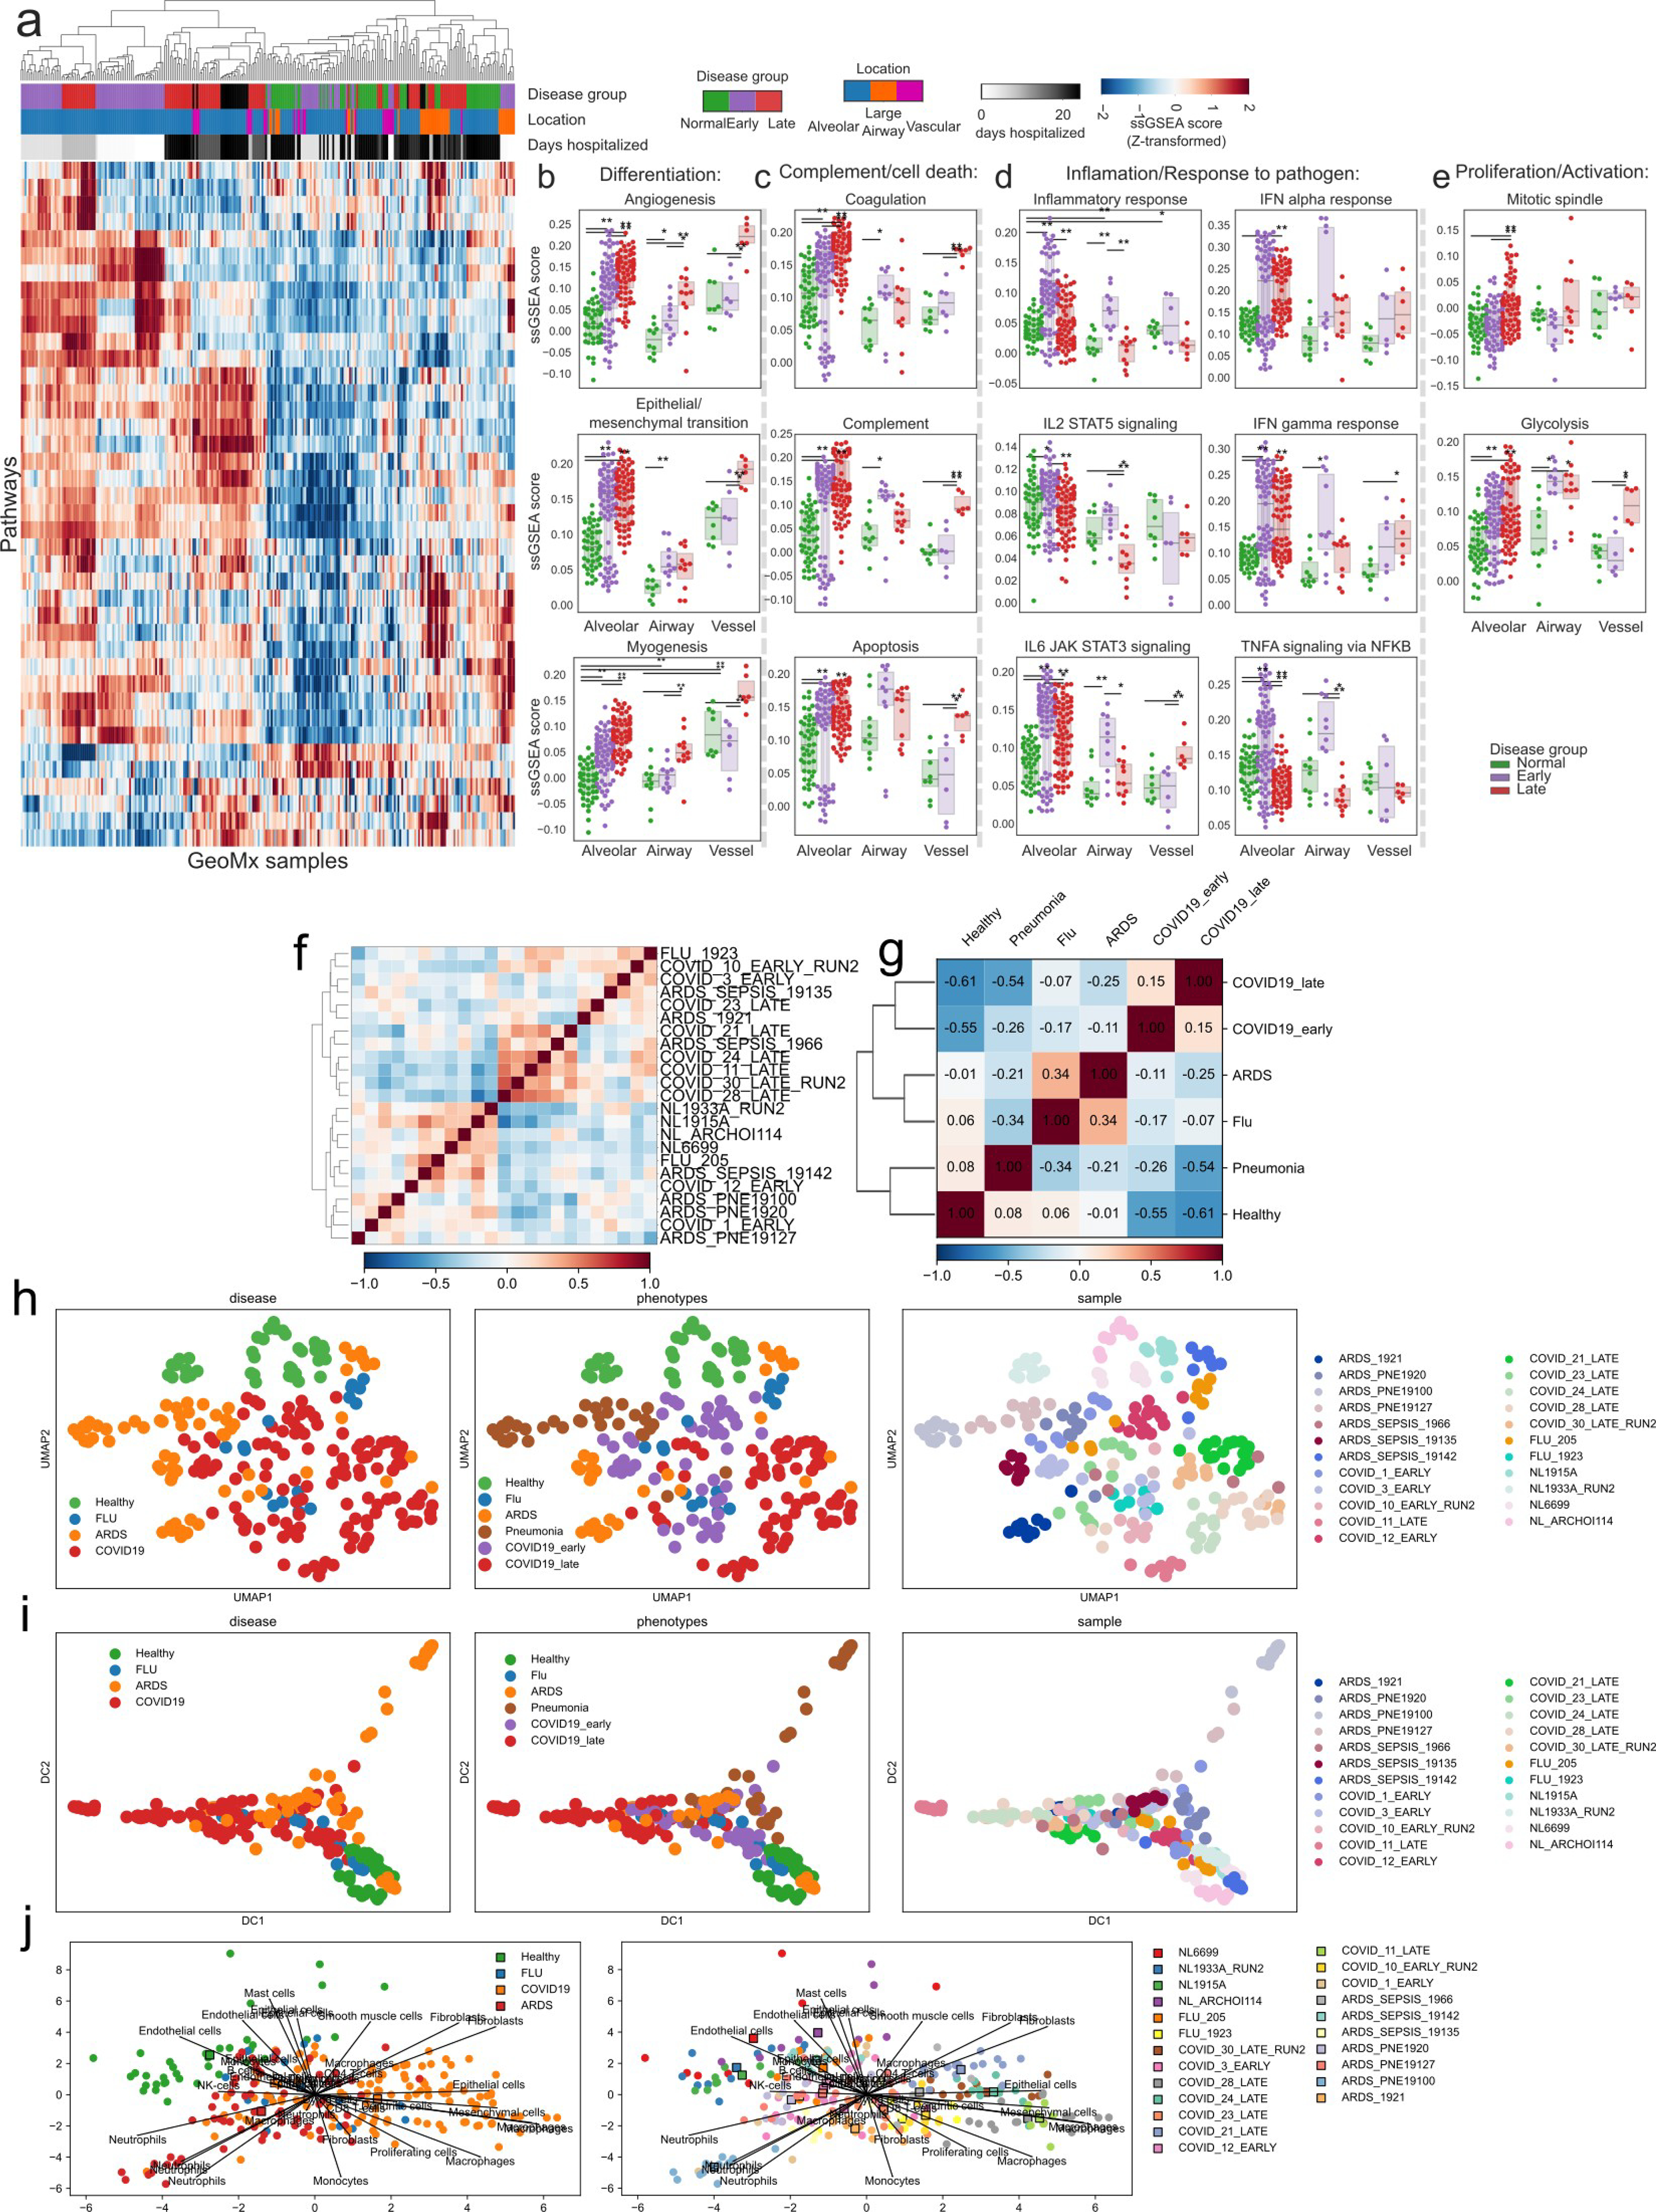
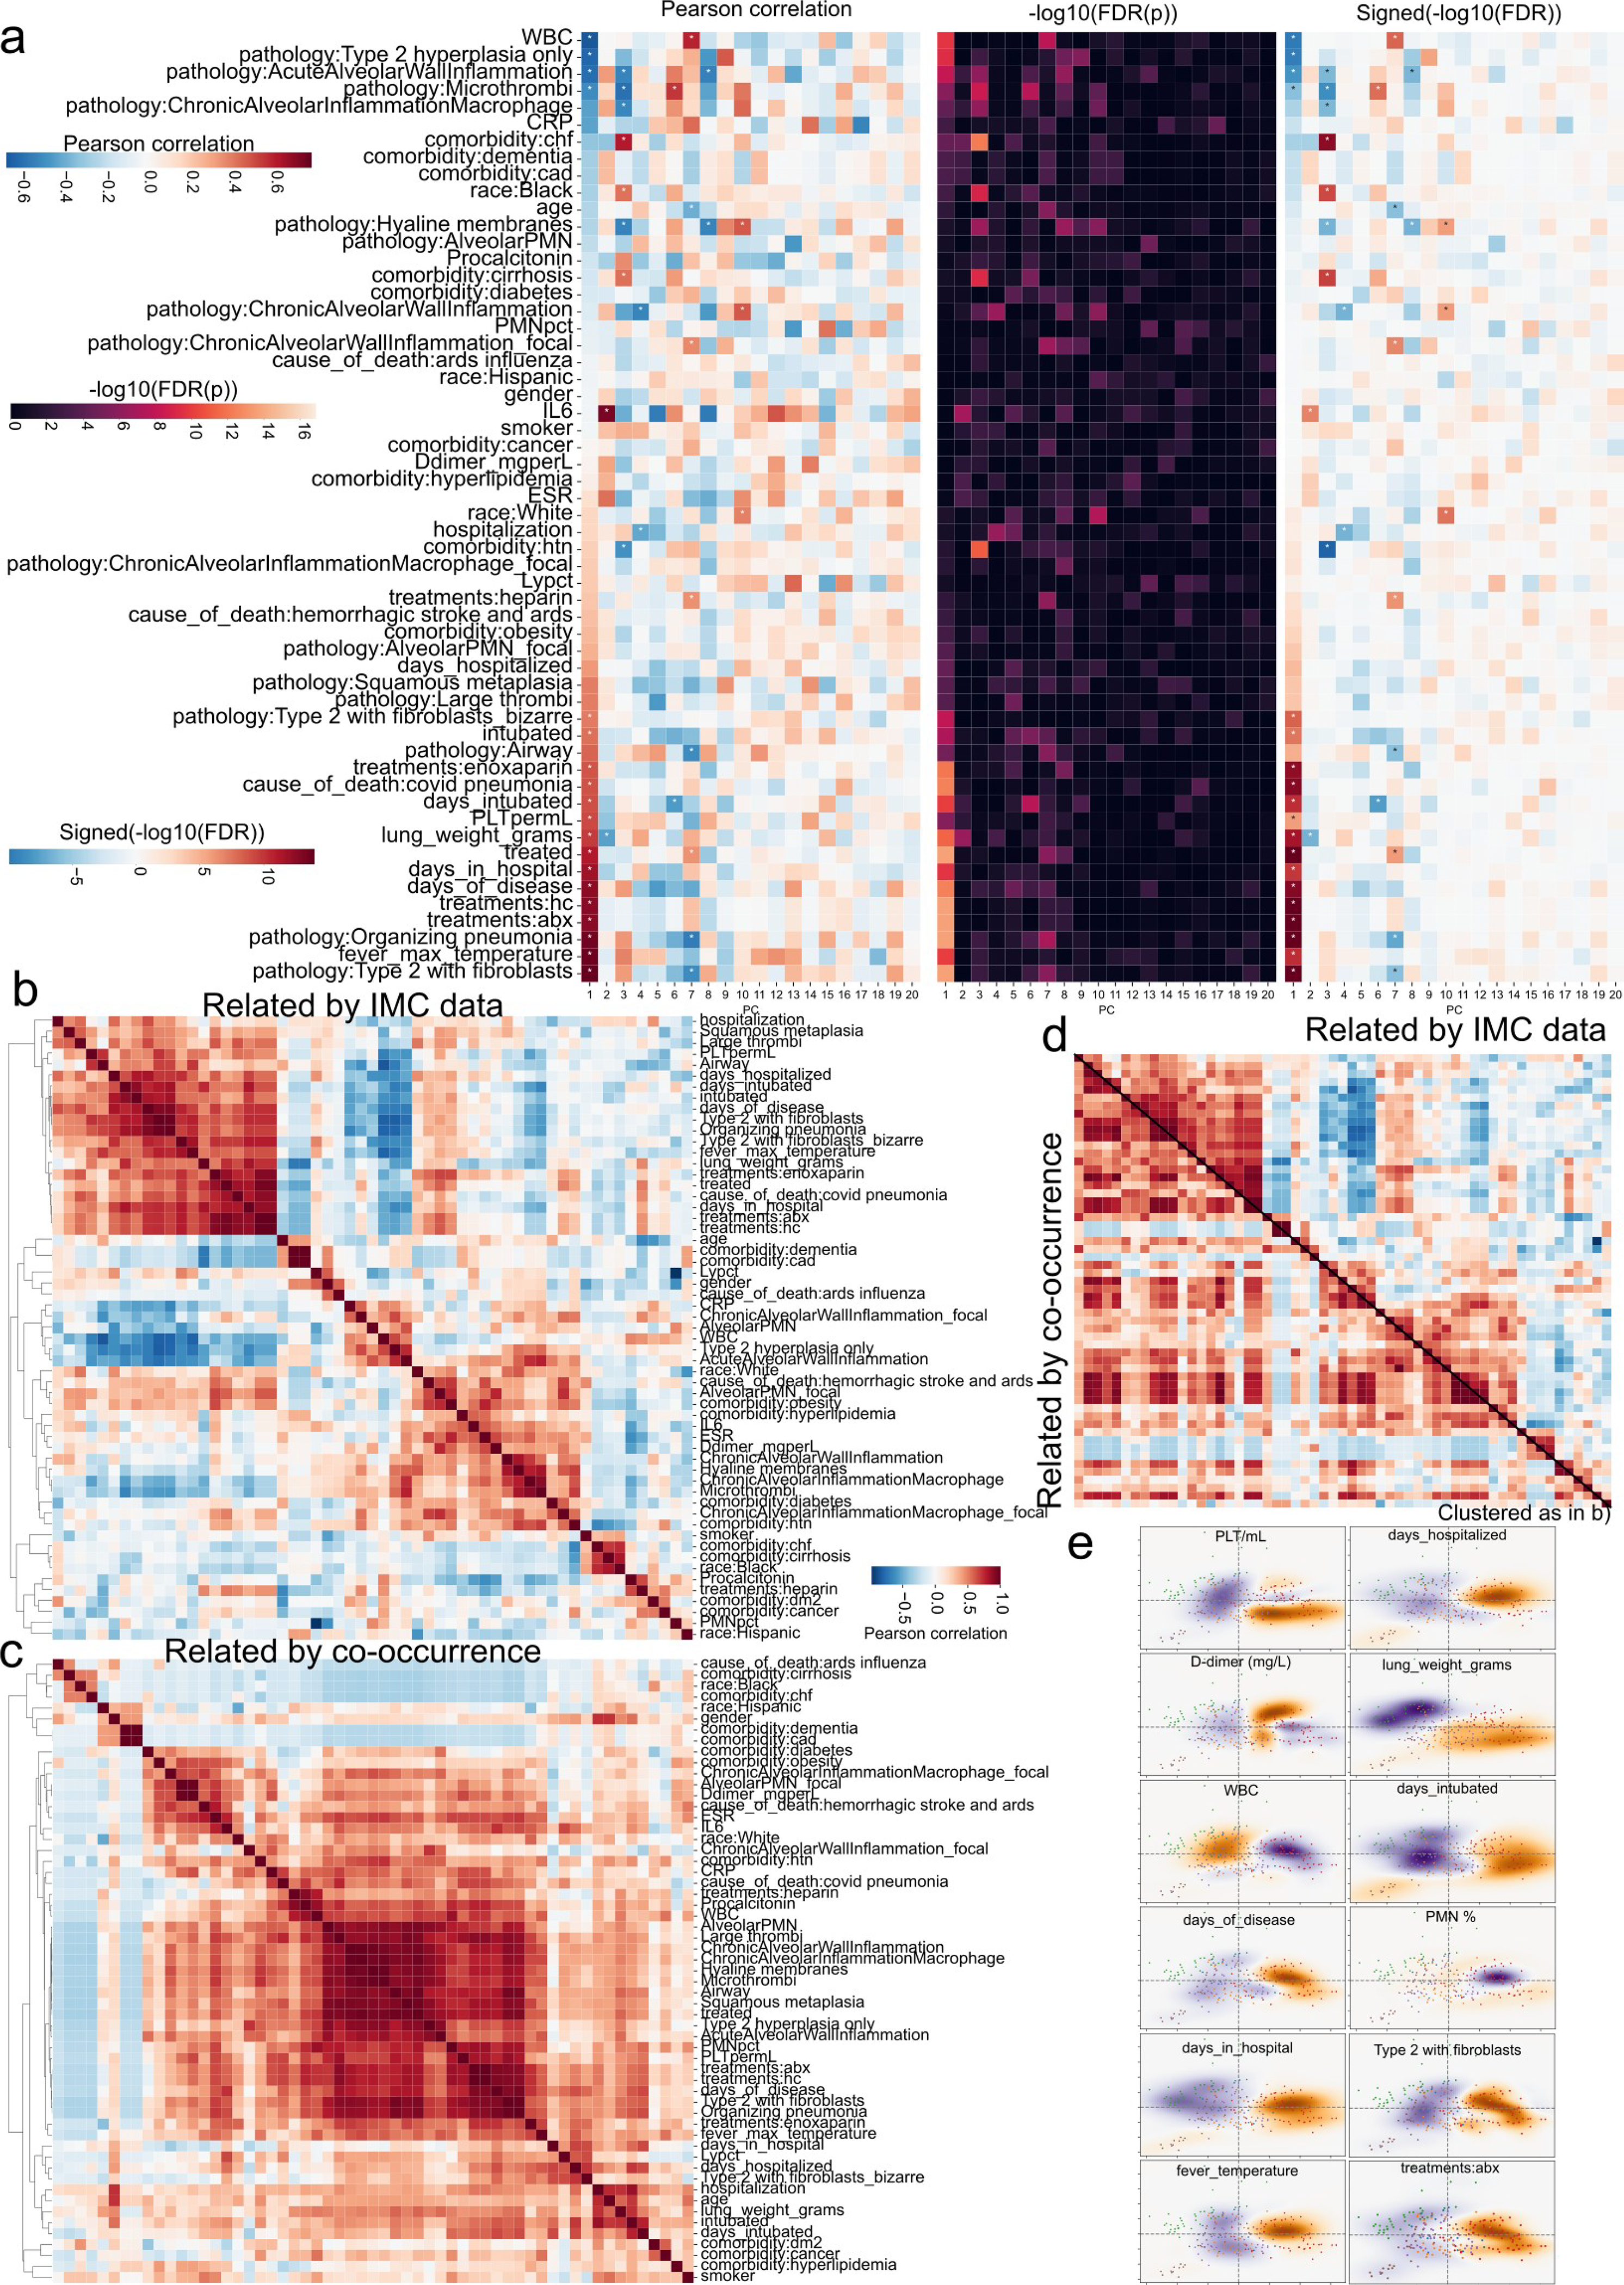
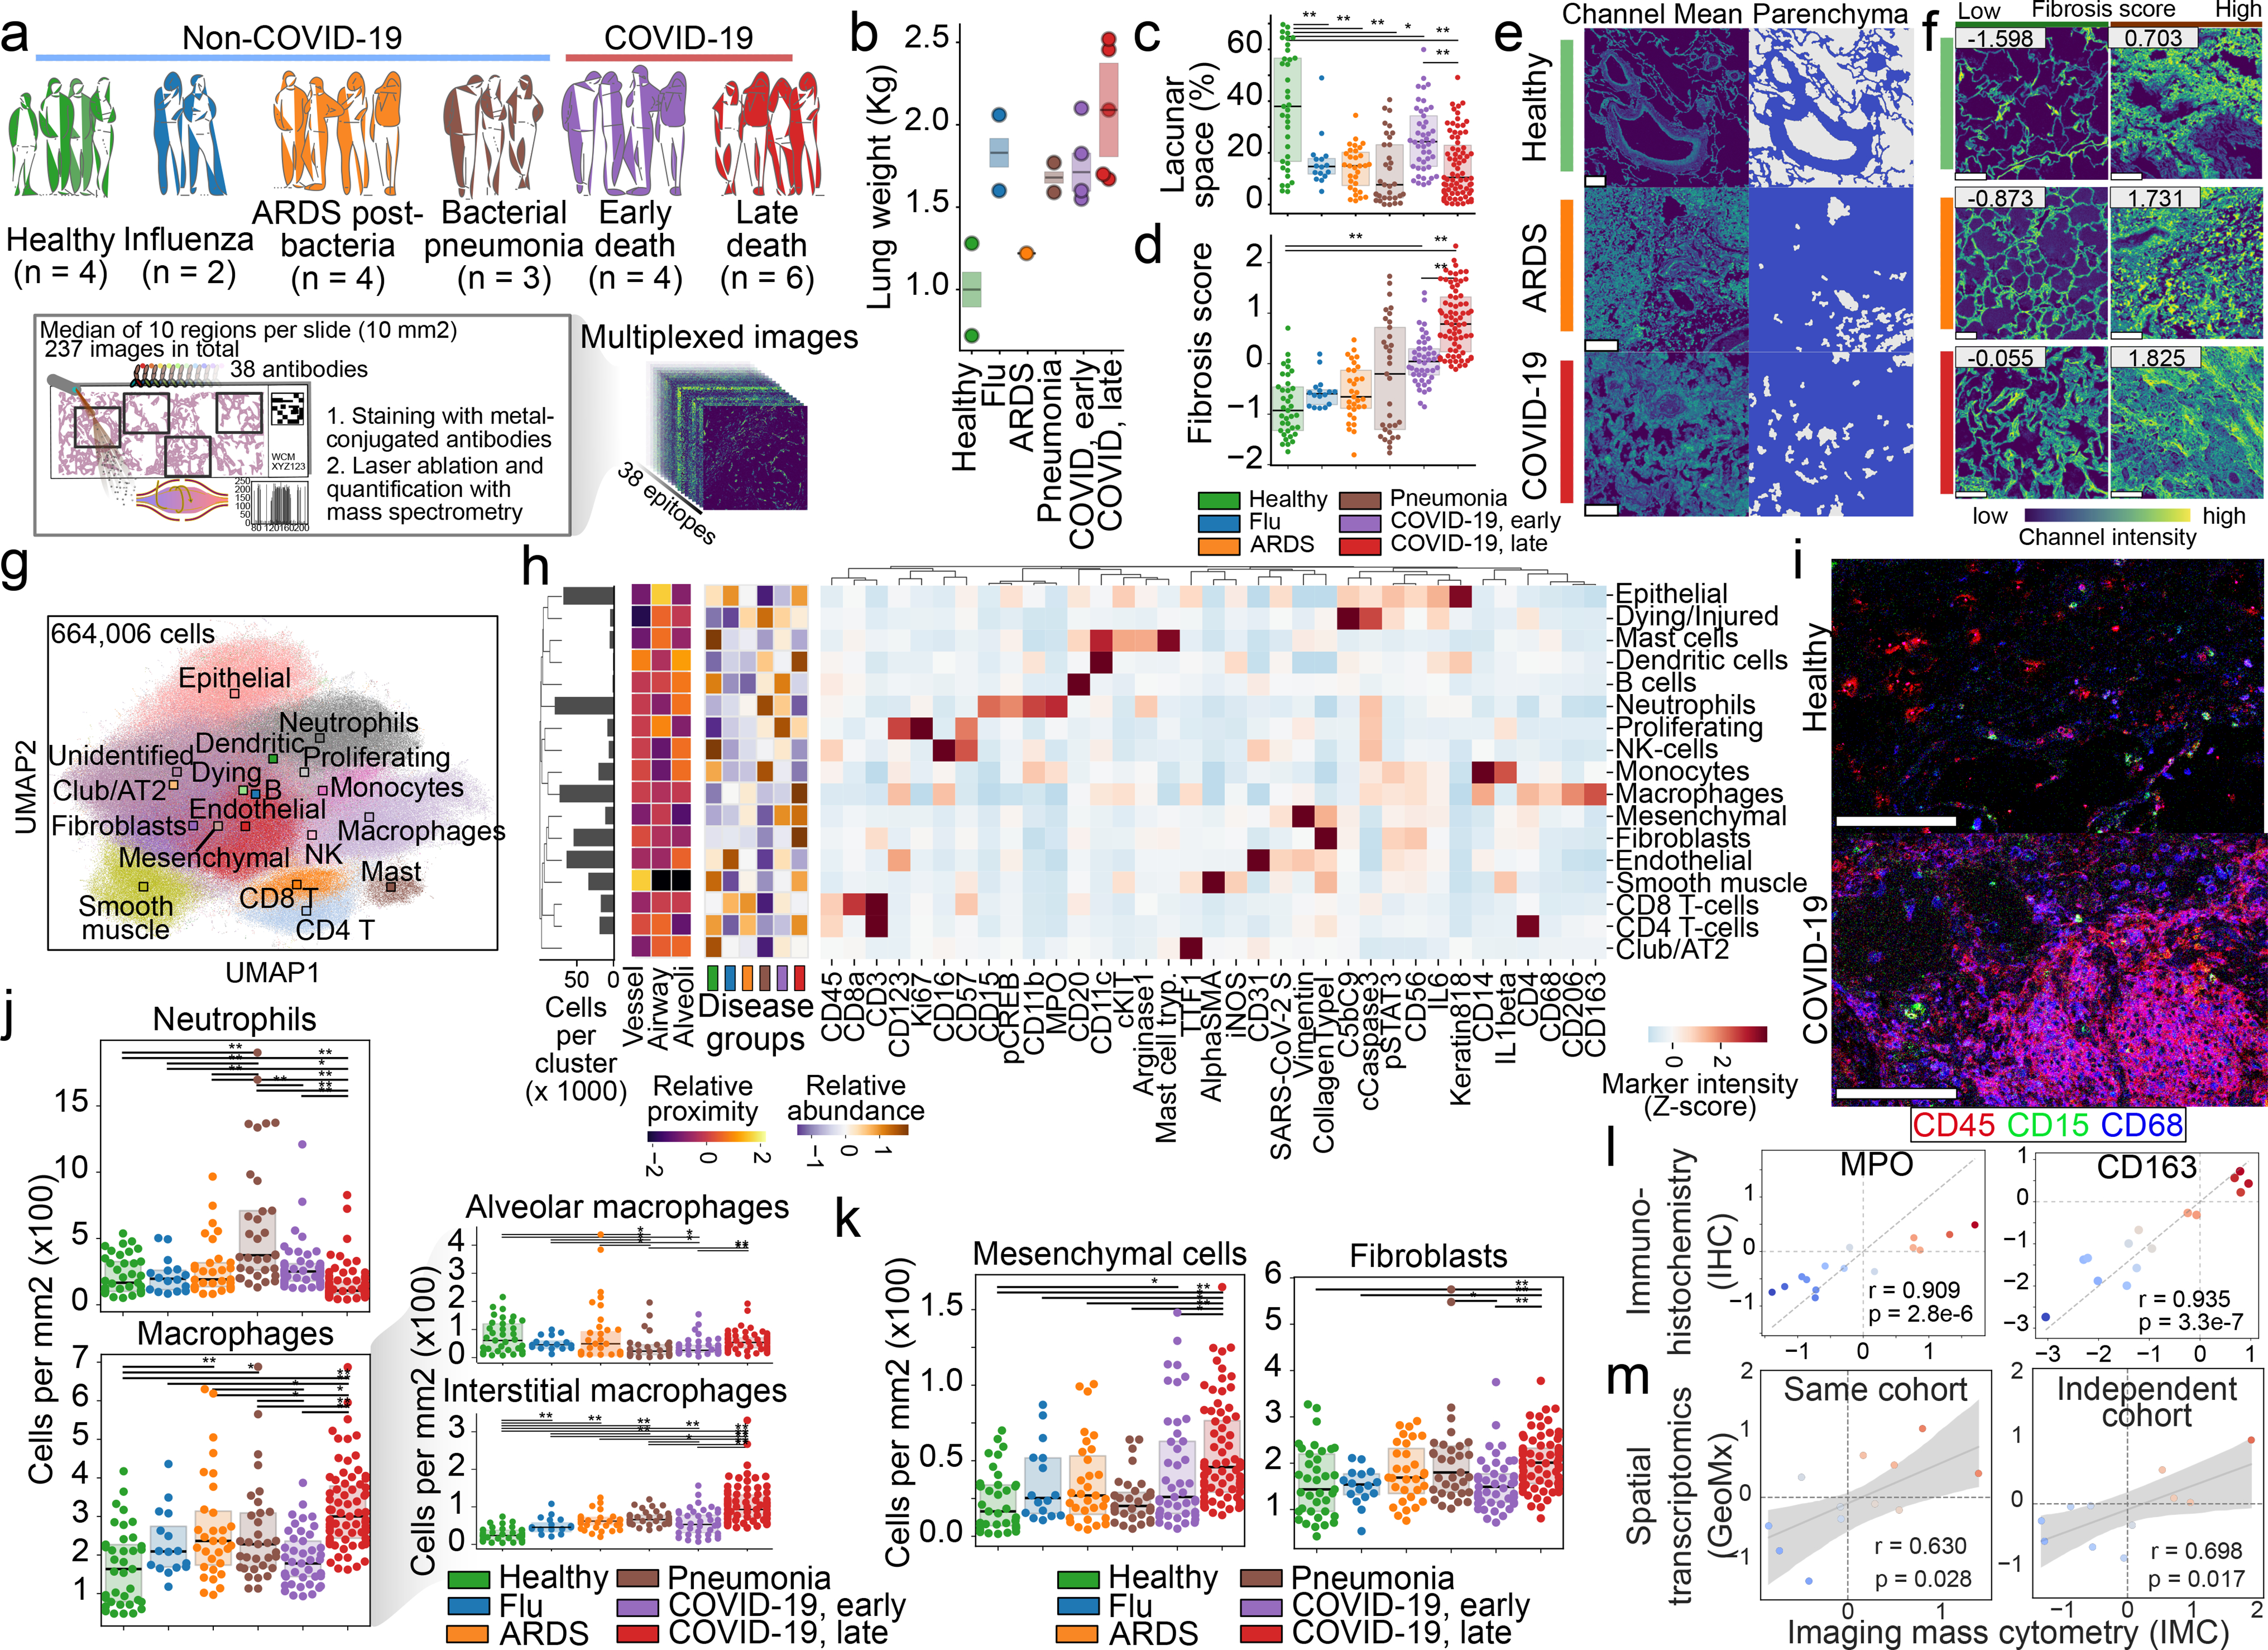
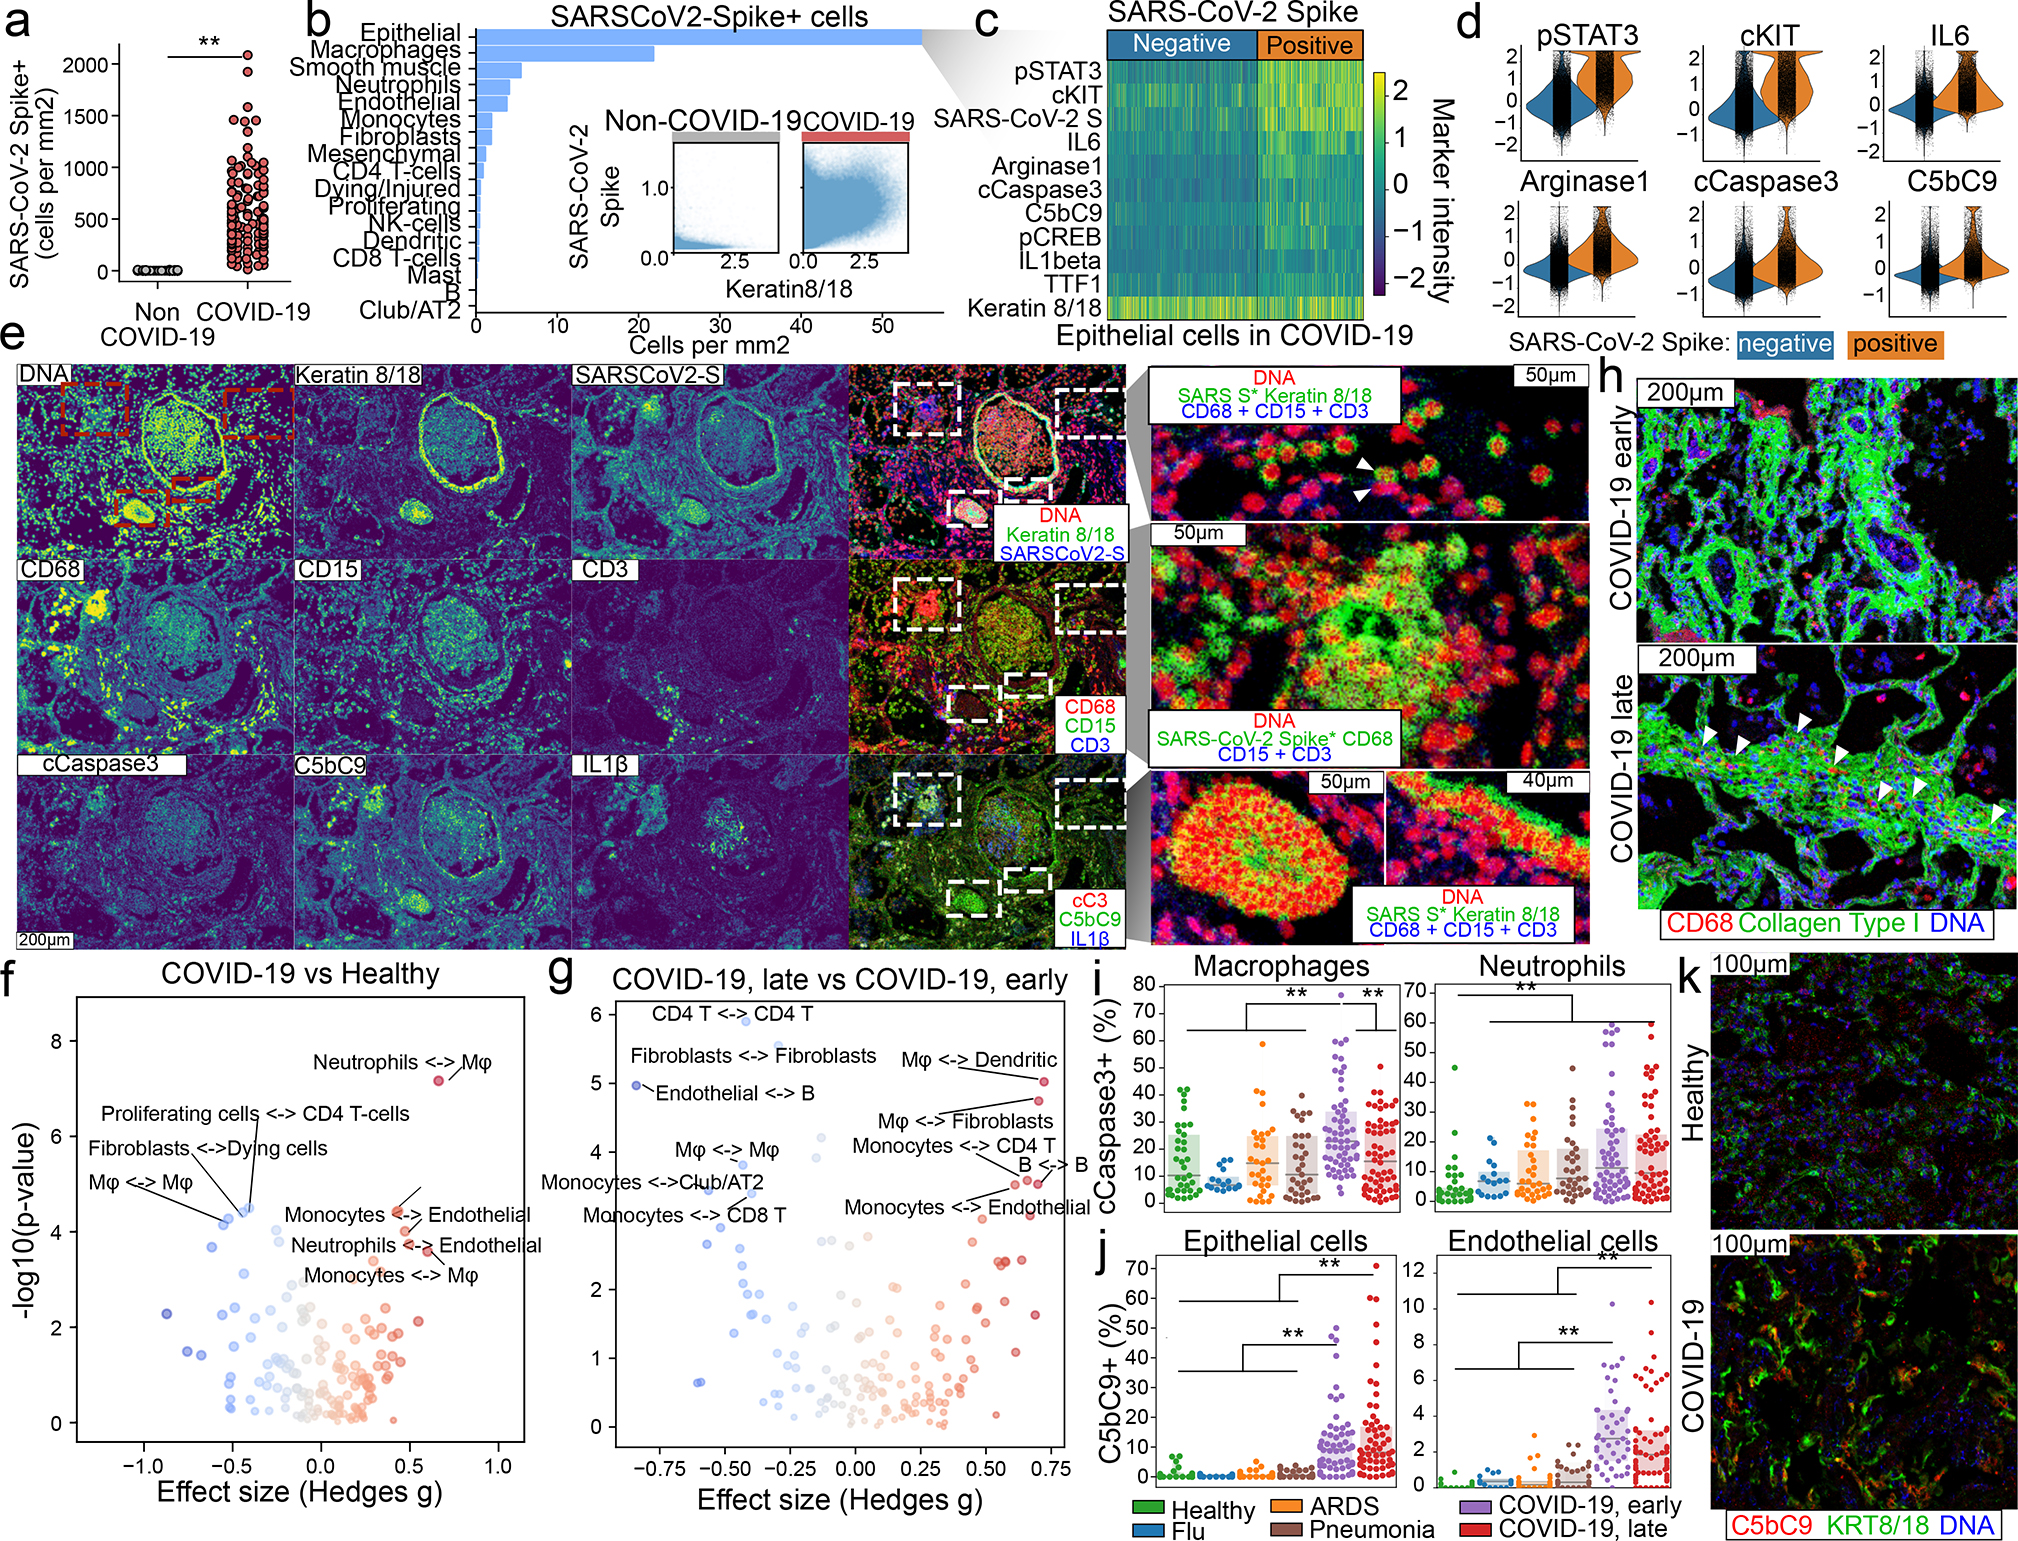
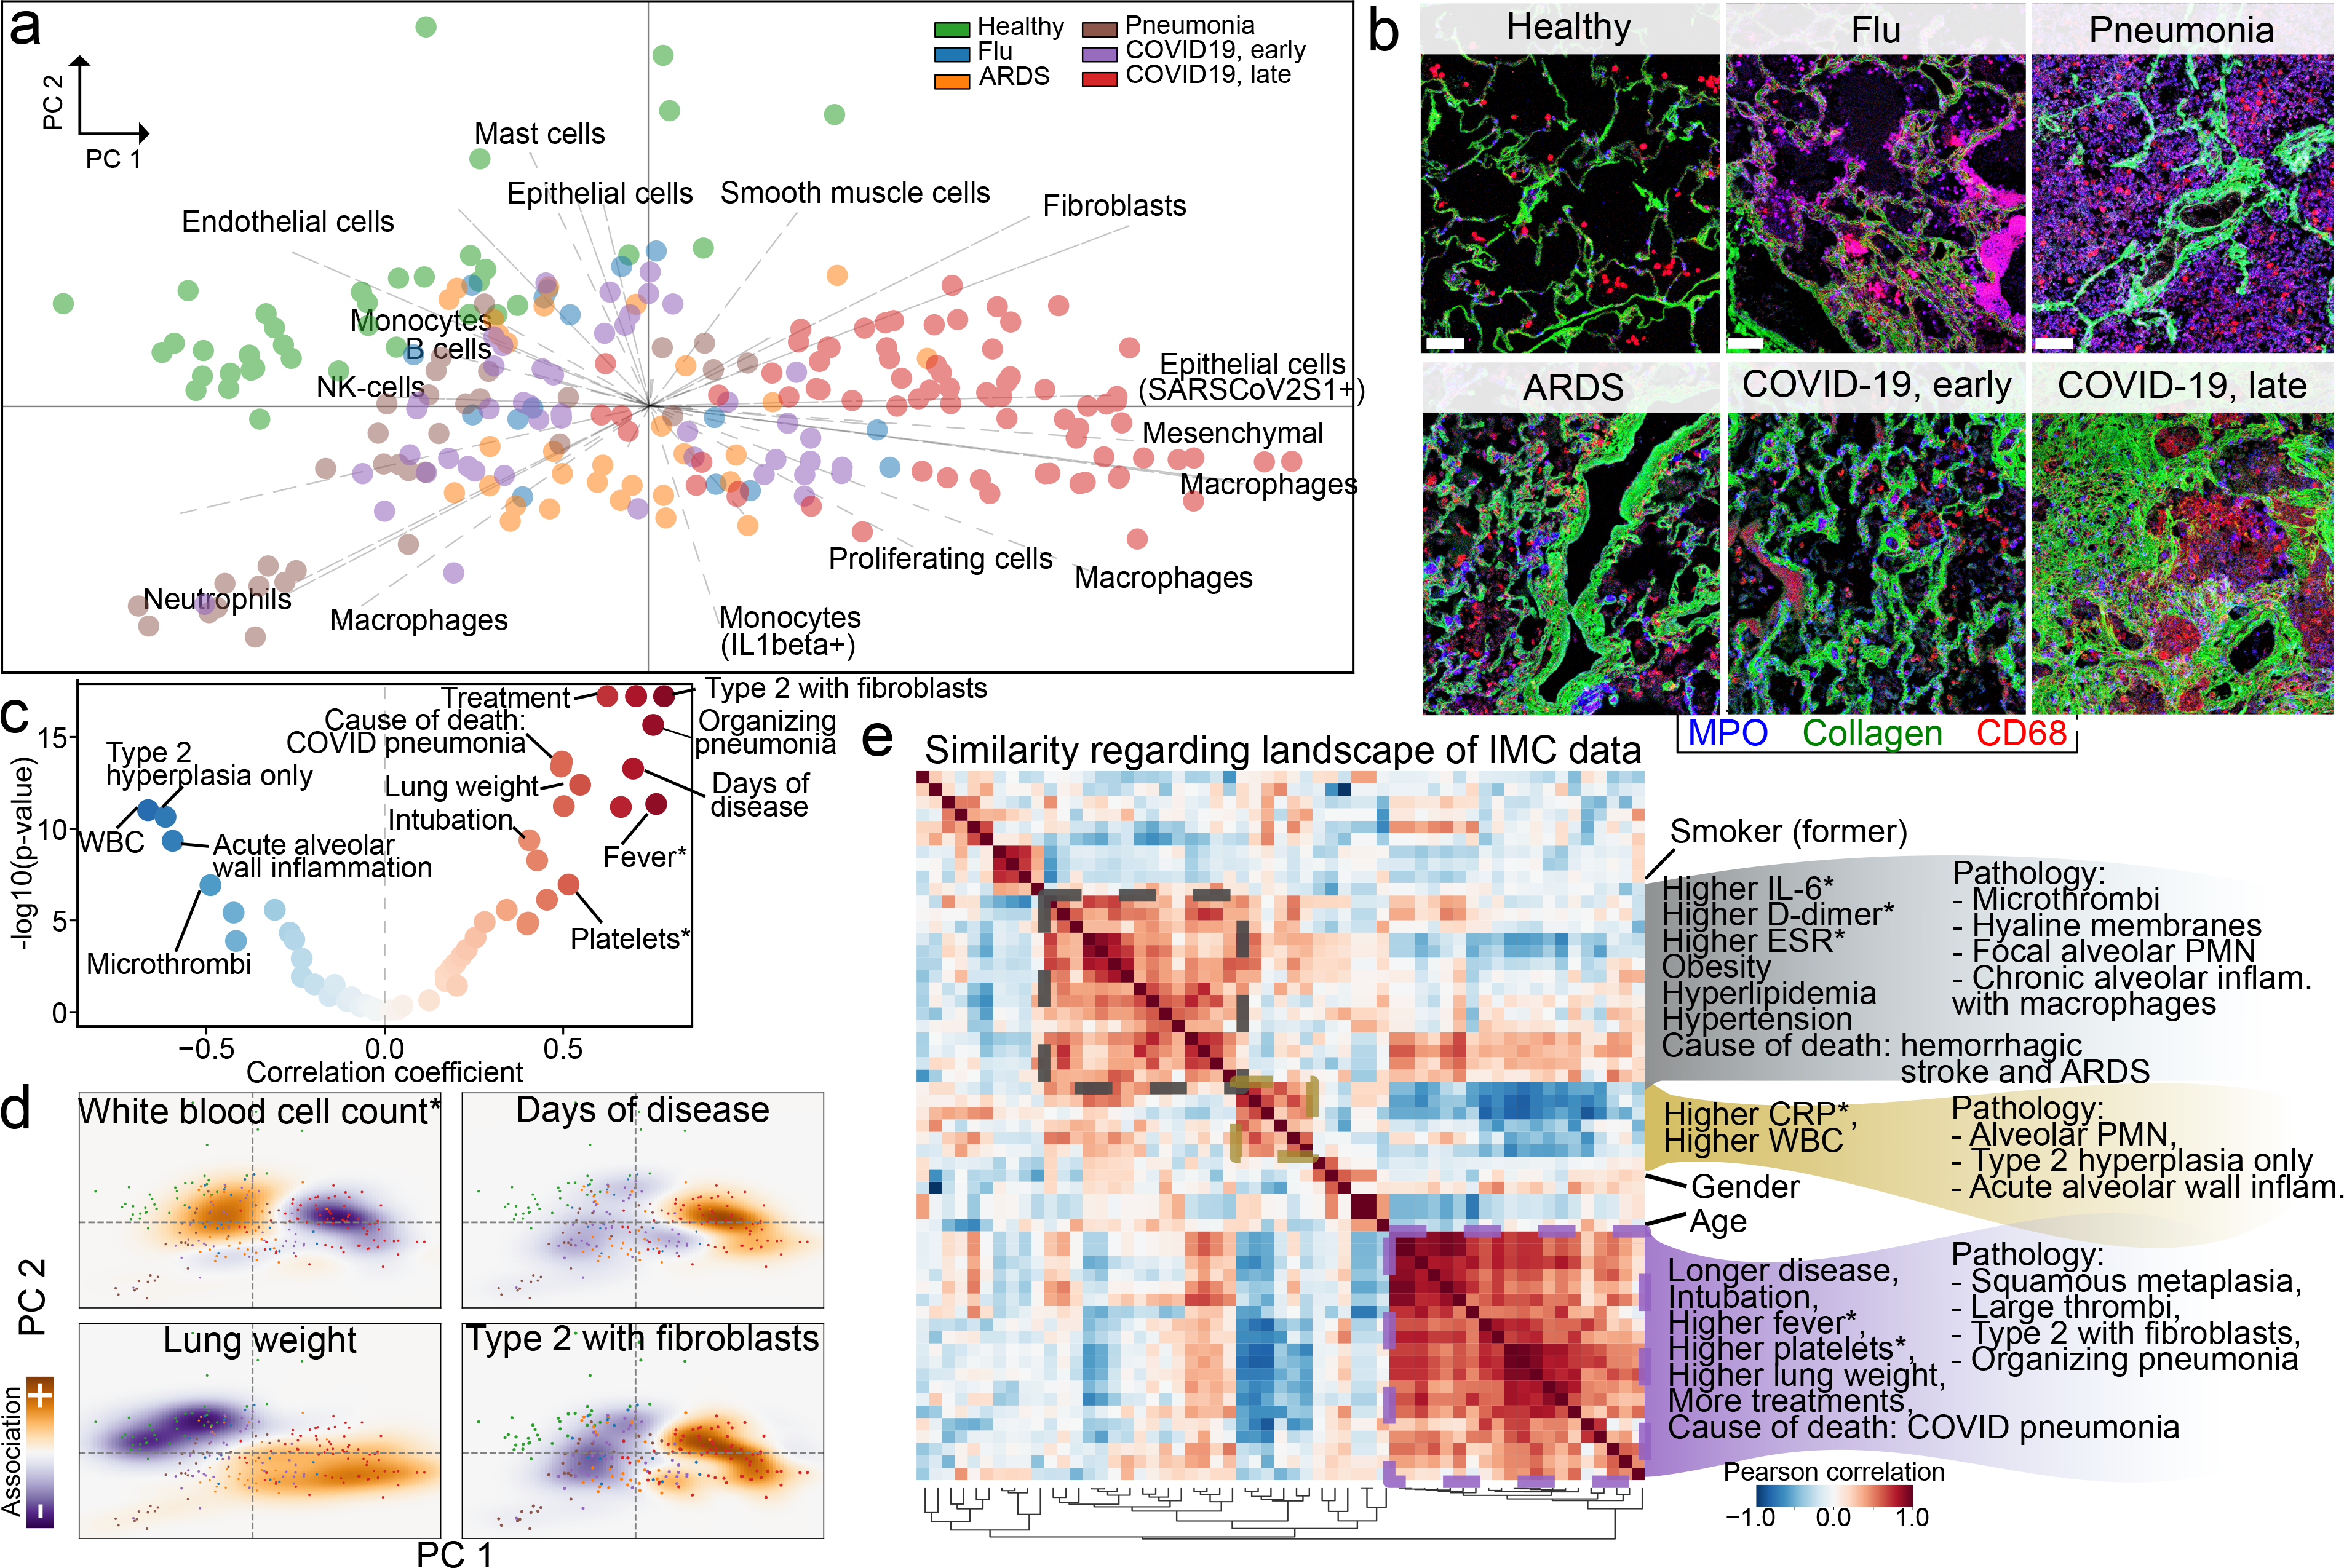
Recent studies have provided insights into the pathology of and immune response to COVID-191-8. However, a thorough investigation of the interplay between infected cells and the immune system at sites of infection has been lacking. Here we use high-parameter imaging mass cytometry9 that targets the expression of 36 proteins to investigate the cellular composition and spatial architecture of acute lung injury in humans (including injuries derived from SARS-CoV-2 infection) at single-cell resolution. These spatially resolved single-cell data unravel the disordered structure of the infected and injured lung, alongside the distribution of extensive immune infiltration. Neutrophil and macrophage infiltration are hallmarks of bacterial pneumonia and COVID-19, respectively. We provide evidence that SARS-CoV-2 infects predominantly alveolar epithelial cells and induces a localized hyperinflammatory cell state that is associated with lung damage. We leverage the temporal range of fatal outcomes of COVID-19 in relation to the onset of symptoms, which reveals increased macrophage extravasation and increased numbers of mesenchymal cells and fibroblasts concomitant with increased proximity between these cell types as the disease progresses-possibly as a result of attempts to repair the damaged lung tissue. Our data enable us to develop a biologically interpretable landscape of lung pathology from a structural, immunological and clinical standpoint. We use this landscape to characterize the pathophysiology of the human lung from its macroscopic presentation to the single-cell level, which provides an important basis for understanding COVID-19 and lung pathology in general.


Conflict of interest statement

Competing interests

O.E. is scientific advisor and equity holder in Freenome, Owkin, Volastra Therapeutics and OneThree Biotech. R.E.S. is on the scientific advisory board of Miromatrix Inc and is a consultant and speaker for Alnylam Inc. C.E.M. is a cofounder of Biotia and Onegevity Health. E.C.S. is an employee of Fluidigm. T.H., S.W., Y. K. and J.R. are employees of Nanostring Inc. The remaining authors declare no competing financial interests.

Figures

Extended Data 1:
Extended Data 1:
a) Heatmap depicting the values of each individual for all acquired clinical and demographic variables. Grey color indicates missing or non-applicable values. b) Time of death relative to start of symptoms in COVID-19 patients. c-d) Percentage of lacunar space attributed to a) vessel or b) epithelial space per image grouped by disease. e) Collagen type I in images from lungs of healthy individuals, or lung pathology patients and the associated fibrosis score. Images with lowest, median and highest fibrosis scores are depicted. f) Percentage of image covered in Collagen type I for each image grouped by disease group. g) Mean intensity of Collagen type I in lung IMC images grouped by disease group. h) UMAP projection of all single-cells where cells are colored by the intensity of each channel. For panels c), d), f), and g): ** p < 0.01; * p < 0.05, two-sided Mann-Whitney U-test, pairwise between groups, Benjamini-Hochberg FDR adjustment.
Extended Data 2:
Extended Data 2:
a) Hierarchically clustered heatmap of discovered clusters (rows) and the mean intensity of each channel (columns) for each. The histogram on the left represents the absolute abundance of each cluster across all images. The dot-plot represents the relative abundance of each cluster in each disease group. b) Classification of lung lacunae. Representative images of healthy lung images with the mean of all channels and channels important to discern between vessels, airways and alveoli. The last column represents the final classification of lacunae into each of the three classes of structures. c) Representative spatial context of three meta-clusters (rows). The column on the left displays the spatial distribution of the most predominant marker for each meta-cluster, while the column on the right represents segmented cells colored by the meta-cluster they were assigned to. d) Global abundance of structural and immune cells. Absolute (first row) and relative (second row) abundance of groups of cells dependent on disease group. ** p < 0.01; * p <0.05, two-sided Mann-Whitney U-test, pairwise between groups, Benjamini-Hochberg FDR adjustment.
Extended Data 3:
Extended Data 3:
a-b) Absolute abundance of a) meta-clusters or b) clusters per image, grouped by disease group. c-e) Diversity of myeloid cells in the lung. c) UMAP representation of myeloid cells and the prominent markers associated with them. d) Phenotypic markers, spatial context and abundance in disease groups for each of the 6 myeloid clusters. e) Abundance of each myeloid cluster in the disease groups. Each point represents the abundance of that cluster in a given region of interest. For panels a), b), and e): ** p < 0.01; * p < 0.05, two-sided Mann-Whitney U-test, pairwise between groups, Benjamini-Hochberg FDR adjustment.
Extended Data 4:
Extended Data 4:
a) Schematic experimental design of new IMC panel and its application to healthy and COVID-19 lung tissue samples. b) UMAP representation of single-cells coloured by the intensity of the marker for cell-type defining markers and functional markers. c) Expresion of markers for each single-cell grouped by the cell type. d) Differential expression of functional markers between COVID-19 and Healthy lung for each cell type. e) Expression range represented as violinplots for the selected cell types from b), between COVID-19 and healthy lung. ** p < 0.01 two-sided Wald test, Benjamini-Hochberg FDR adjustment. f) Representative images of S100A9 and CD15 marker expression in Healthy lung and COVID-19. All scale bars represent 100 microns.
Extended Data 5:
Extended Data 5:
a) Relationship between fibrosis score and fibroblast meta-cluster abundance visualized as a scatter plot. b-c) Immunohistochemistry for two markers across all disease groups. Hematoxylin-diaminobenzidine staining of b) CD163 or c) MPO in tissue from healthy and diseased lung matching the patients in the IMC cohort. d) Analysis of immunohistochemistry data. Example images demonstrating the process of color decomposition underlying the separation of the hematoxylin (nuclei) and diaminobenzidine (either CD163 or MPO) (H-DAB) in lung tissues. e) Example images demonstrating the process of nuclei segmentation employed. The left column shows the original images in RGB space, the middle the resulting segmentation where each nuclei has a random color and the background is black, and the right column which overlays the borders of segmented nuclei in red over the original image. f) Example image section demonstrating the process of quantification of diaminobenzidine stain. The first panel shows the original image in RGB space, the second the nuclei segmentation, the thid the numeric value of the DAB stain for each nuclei, and the fourth a histogram of nuclei intensity in DAB stain modeled as a Gaussian mixture with two components used to discretize nuclei into negative or positive for DAB based on a threshold which best separates the two mixtures. g) Percentage of cells within an image which is positive for the respective DAB stain in IHC (left columns) or positive for the respective marker in IMC data (right column). h) Comparison of the estimated effect sizes of change between disease groups estimated from IMC data (x-axis) or IHC (y-axis) for the two stains. The Pearson correlation coefficient and its significance are indicated. i) Analysis of image lacunarity with IHC data. Representative images of lacunarity for healthy and late COVID-19 immunohistochemistry data. For each image the original image and the segmented background space is shown along with the lacunarity value for the image which is the fraction of the image without cells which represents the alveolar/capillary space. j) Quantification of lacunarity across MPO images in IHC. ** p < 0.01; * p < 0.05, two-sided Mann-Whitney U-test, pairwise between groups, Benjamini-Hochberg FDR adjustment. k) Comparison of the estimated effect sizes of change in lacunarity between disease groups estimated from IMC data (x-axis) or IHC (y-axis). For panels a), h), and k): r = Pearson coeffcient; p = its two-tailed p-value.
Extended Data 6:
Extended Data 6:
Profiling of lung tissue with targeted spatial transcriptomics (GeoMx). a) Experimental design of GeoMx dataset. b) Representation of the procedure to choose regions of interest within the lung tissue to capture with GeoMx. c) Enrichment of cell type-specific gene set signatures for various cell types matching IMC across disease groups. d) Comparison of the estimated changes in cell type abundance with IMC (x-axis) and gene set signatures in GeoMx (y-axis). e) Viral load dependent on the time of death since beginning of COVID-19 symptoms in an independent cohort. COVID-19 samples were categorized into “early” or “late” death depending if death occurred before or after 15 days respectively. f) Schematic representation of the cohort of patients for which GeoMx data is available: in total 5 pateints and 231 ROIs. g) Estimated fractions of cell type composition by the CYBERSORT program between early and late COVID-19 death from the original publication. h) Comparison of the estimated changes in cell type abundance with IMC (x-axis) and GeoMx (y-axis) between late and early COVID-19 death. For panels d) and h): r = Pearson coefficient, p = its two tailed p-value; shaded area indicates 95th confidence interval. For panels c) and g): ** p < 0.01; * p < 0.05, two-sided Mann-Whitney U-test, pairwise between groups, Benjamini-Hochberg FDR adjustment.
Extended Data 7:
Extended Data 7:
a) Percentage of cells positive for each IMC channel as classified by univariate Gaussian mixture models per disease group. b) Percentage of channel positive cells per each meta-cluster. Values represent a column-wise Z-score. c) Absolute (top) and relative (bottom) frequency of SARS-CoV-2 Spike+ cells per disease group. d) Proportional abundance of SARS-CoV-2 Spike+, IL6+, pSTAT3+ cells across disease groups. e) Proportional amount of SARS-CoV-2 Spike+ cells grouped per meta-cluster and disease group. f) Proportional frequencies of cells positive for SARS-CoV-2 Spike+ cells per meta-cluster and disease group. g-h) Heatmap of single g) macrophage or neutrophils h) (columns) and functional markers (rows) with cells grouped by SARS-CoV-2 Spike positivity. i-j) Intensity of IMC channels per single-cell dependent on SARS-CoV-2 Spike positivity for i) macrophages and j) neutrophils. k) Mean channel intensity for all metaclusters dependent on SARS-CoV-2 Spike positivity. For panels c), d), and f): ** p < 0.01; * p < 0.05, two-sided Mann-Whitney U-test, pairwise between groups, Benjamini-Hochberg FDR adjustment.
Extended Data 8:
Extended Data 8:
a) Exemplary description of the derivation of a Region Adjacency Graph (RAG) for a given lung IMC image. The leftmost image depicts the DNA channel marking nuclei, the centermost the identified meta-clusters, and the rightmost the RAG represented as edges between adjacent cells. Scale bar represents 100 microns. b) Observed values of pairwise cluster interactions over the expected values for the same cellular interactions for the image in a). c) Pairwise interactions between meta-clusters aggregated by the mean value across images depending on the disease group. d-f) Pairwise cellular interactions between meta-clusters dependent on SARS-CoV-2 Spike positivity: d) uninfected cells; e) between SARS-CoV-2 Spike positive and negative cells; f) between infected cells. g-i) Statistical testing of differential interactions of infected cells and other cell types and uninfected cells and other cell types, dependent on the SARS-CoV-2 Spike positivity of the second cell type: g) both SARS-CoV-2 Spike- and SARS-CoV-2 Spike+ cells; h) only SARS-CoV-2 Spike+ cells; i) only SARS-CoV-2 Spike- cells. The rows display a volcano plot where the x-axis display the difference in interaction between SARS-CoV-2 Spike+ and SARS-CoV-2 Spike- cells and the y-axis the -log10 Mann-Whitney U-test FDR-adjusted p-value.
Extended Data 9:
Extended Data 9:
a) Enrichment scores for hallmark pathways in MsigDB across all ROIs in the GeoMx dataset. b-e) Enrichemnt score of selected pathways from a) across disease groups but dependent on the location within the lung from which they were obtained. ** p < 0.01; * p < 0.05, two-sided Mann-Whitney U-test, pairwise between groups, Benjamini-Hochberg FDR adjustment. f-g) Pairwise Pearson correlation of cell type abundances between f) IMC samples g) disease groups. h-j) h) UMAP, i) Diffusion map or j) PCA projection of IMC images colored by disease group, subgroup or sample ID.
Extended Data 10:
Extended Data 10:
a) Correlation coefficients (left) or FDR-adjusted p-values (center) and signed p-values (right) demonstrating the association between demographic, pathologic, and clinical factors, and principal components. b) Pairwise correlation of demographic, pathologic, and clinical factors across all principal components. Matrix was clustered using average linking and pearson correlation as distance metric. Values used were signed FDR-adjusted p-values. c) Pairwise correlation of demographic, pathologic, and clinical factors across samples (co-occurrence). Matrix was clustered using average linking and pearson correlation as distance metric. d) Same as b) and c) where the top triangular matrix is from b) and the lower from c). The order of the rows and columns is the same as b). e) Projection of clinical factors onto pathology landscape. Kernel density estimation for various clinical and demographic factors weighted by the factor values, unweighted, or their difference.
Figure 1:
Figure 1:
Structural and immunological disorder of lung infection. a, Composition of lung-infection cohort, and schematic procedure to acquire highly multiplexed spatially resolved data with IMC from post-mortem lung samples. b, Total lung weight per disease group measured at autopsy. n = 16 biologically independent samples. c, Lacunar space for each acquired IMC image as a percentage of image area. d, Fibrosis score for each acquired IMC image. e, Representative images illustrating the lacunar and parenchymal structure of healthy lungs, and lungs from patients with ARDS or COVID-19. f, Collagen in images from healthy lungs and lungs from patients with ARDS or COVID-19 and the associated fibrosis score. Images with lowest and highest fibrosis scores are depicted. g, Uniform manifold approximation and projection (UMAP) of all cells, and the metacluster of each cell. Centroids are shown as squares. h, Mean intensity of each marker in each metacluster. Histogram indicates metacluster abundance. Heat maps on left indicate relative proximity to lung structures or abundance per disease group. AT2, alveolar type 2 cells; KRT8/8, KRT8 and KRT18; NK, natural killer. i, Spatial distribution of immune cells in heathy lungs and lungs from a patient with COVID-19. j, Left, abundance of neutrophils (top) and macrophages (bottom) in each disease group. Right, macrophages divided into alveolar (top) and interstitial (bottom) subsets. k, Abundance of mesenchymal cells (left) and fibroblasts (right) in each disease group. l, Amount of change (effect size) pairwise between all disease groups (n = 15) in MPO (left) and CD163 (right) markers between IMC (x axis) and immunohistochemistry (IHC) (y axis). m, Amount of change between late and early COVID-19 groups, pairwise for each cell type (n = 24), as estimated by IMC (x axis) and targeted spatial transcriptomics (y axis) for the same (left) and independent (right) cohorts. For c, d, j, l, m, n, n = 237 images from 27 biologically independent samples. **P < 0.01; *P < 0.05, two-sided Mann–Whitney U test, pairwise between groups, Benjamini–Hochberg false-discovery rate (FDR) adjustment. In o, p, r, Pearson correlation coefficient; P, two-sided P value; shade indicates 95th confidence interval. Scale bars, 100 μm (e, f, k). Box plots show interquartile range (25th to 75th percentiles) with centre line as the median (50th percentile).
Figure 2:
Figure 2:
Cellular tropism of SARS-CoV-2 infection. a, Absolute abundance of S+ cells for lungs of patients without COVID-19 (grey) or with COVID-19 (red). b, Distribution of S+ cells across metaclusters in COVID-19. Inset displays intensity of KRT8/18 and S+ for single cells from non-COVID-19 (left) and COVID-19 (right) groups. c, Phenotype of alveolar epithelial cells in COVID-19, depending on levels of S. d, Intensity of differential markers between cells dependent on S levels. e, Distribution of S signal in a spatial context. Structural, cell-type-specific and functional markers are displayed alone or in combination. For the green channel in the images in the rightmost column, the S channel was multiplied with KRT8/18 or CD68 to highlight T cells that are positive for both markers. Scale bar, 200 μm (main panels), 50 μm (magnified images on right (unless otherwise indicated)). f, g, Differential interactions in healthy lung and lungs of patients with COVID-19 (f) or between early and late COVID-19 (g). h, Fibroblasts and macrophages from early and late COVID-19. Scale bars, 200 μm. i, j, Proportion of cleaved CASP3+ macrophages (left) or neutrophils (right) (i), and C5b–C9+ epithelial (left) or endothelial (right) cells (j), for each disease group. k, Deposition of C5b–C9 in epithelial cells in healthy lung and lungs from patients with COVID-19. Scale bars, 100 μm. In a, i, j, n = 237 images from 27 biologically independent samples; **P < 0.01; *P < 0.05, two-sided Mann–Whitney U test, pairwise between groups, Benjamini–Hochberg FDR adjustment. In f, g, P values are from two-sided Mann–Whitney U test with Benjamini–Hochberg FDR adjustment. Box plots show interquartile range (25th–75th percentiles); centre line is median (50th percentile).
Figure 3:
Figure 3:
A data-driven and clinically annotated landscape of lung pathology. a, Principal component analysis (PCA) of all IMC images. Points represent images, and are coloured by disease group. Arrows are vectors for each cell cluster, and indicate the area in which each cell type is most abundant. b, Microanatomy and immune content of the disease groups. Scale bar, 100 μm. c, Volcano plot showing strength of association between clinical parameters and principal component (PC)1, and significance. WBC, white blood cell. d, Projections of white blood cell count (measured at admission) (top left), days of disease (top right), lung weight (bottom left) and alveolar type-2 cells with fibroblasts (bottom right) onto the two-dimensional PCA space. e, Similarity of landscape of IMC data. Pairwise correlation of demographic, clinical and pathological variables in the association with the principal components. Matrix rows and columns are the same. Highlighted groups of variables reflect hierarchically clustered groups of variables explaining the IMC data. In c–e, an asterisk indicates that the clinical parameter was measured at admission.

Similar articles

  • The spatio-temporal landscape of lung pathology in SARS-CoV-2 infection.
    Rendeiro AF, Ravichandran H, Bram Y, Salvatore S, Borczuk A, Elemento O, Schwartz RE. Rendeiro AF, et al. medRxiv [Preprint]. 2020 Oct 27:2020.10.26.20219584. doi: 10.1101/2020.10.26.20219584. medRxiv. 2020. PMID: 33140072 Free PMC article. Preprint.
  • A molecular single-cell lung atlas of lethal COVID-19.
    Melms JC, Biermann J, Huang H, Wang Y, Nair A, Tagore S, Katsyv I, Rendeiro AF, Amin AD, Schapiro D, Frangieh CJ, Luoma AM, Filliol A, Fang Y, Ravichandran H, Clausi MG, Alba GA, Rogava M, Chen SW, Ho P, Montoro DT, Kornberg AE, Han AS, Bakhoum MF, Anandasabapathy N, Suárez-Fariñas M, Bakhoum SF, Bram Y, Borczuk A, Guo XV, Lefkowitch JH, Marboe C, Lagana SM, Del Portillo A, Tsai EJ, Zorn E, Markowitz GS, Schwabe RF, Schwartz RE, Elemento O, Saqi A, Hibshoosh H, Que J, Izar B. Melms JC, et al. Nature. 2021 Jul;595(7865):114-119. doi: 10.1038/s41586-021-03569-1. Epub 2021 Apr 29. Nature. 2021. PMID: 33915568 Free PMC article.
  • COVID-19 tissue atlases reveal SARS-CoV-2 pathology and cellular targets.
    Delorey TM, Ziegler CGK, Heimberg G, Normand R, Yang Y, Segerstolpe Å, Abbondanza D, Fleming SJ, Subramanian A, Montoro DT, Jagadeesh KA, Dey KK, Sen P, Slyper M, Pita-Juárez YH, Phillips D, Biermann J, Bloom-Ackermann Z, Barkas N, Ganna A, Gomez J, Melms JC, Katsyv I, Normandin E, Naderi P, Popov YV, Raju SS, Niezen S, Tsai LT, Siddle KJ, Sud M, Tran VM, Vellarikkal SK, Wang Y, Amir-Zilberstein L, Atri DS, Beechem J, Brook OR, Chen J, Divakar P, Dorceus P, Engreitz JM, Essene A, Fitzgerald DM, Fropf R, Gazal S, Gould J, Grzyb J, Harvey T, Hecht J, Hether T, Jané-Valbuena J, Leney-Greene M, Ma H, McCabe C, McLoughlin DE, Miller EM, Muus C, Niemi M, Padera R, Pan L, Pant D, Pe'er C, Pfiffner-Borges J, Pinto CJ, Plaisted J, Reeves J, Ross M, Rudy M, Rueckert EH, Siciliano M, Sturm A, Todres E, Waghray A, Warren S, Zhang S, Zollinger DR, Cosimi L, Gupta RM, Hacohen N, Hibshoosh H, Hide W, Price AL, Rajagopal J, Tata PR, Riedel S, Szabo G, Tickle TL, Ellinor PT, Hung D, Sabeti PC, Novak R, Rogers R, Ingber DE, Jiang ZG, Juric D, Babadi M, Farhi SL, Izar B, Stone JR, Vlachos IS, Solomon IH, Ashenberg O, Porter CBM, Li B, Shalek AK, Villani AC, Rozenblatt-Rosen O, Regev A. Delorey TM, et al. Nature. 2021 Jul;595(7865):107-113. doi: 10.1038/s41586-021-03570-8. Epub 2021 Apr 29. Nature. 2021. PMID: 33915569 Free PMC article.
  • SARS-CoV-2 Infection and Disease Modelling Using Stem Cell Technology and Organoids.
    Trevisan M, Riccetti S, Sinigaglia A, Barzon L. Trevisan M, et al. Int J Mol Sci. 2021 Feb 26;22(5):2356. doi: 10.3390/ijms22052356. Int J Mol Sci. 2021. PMID: 33652988 Free PMC article. Review.
  • P2Y14 Receptor as a Target for Neutrophilia Attenuation in Severe COVID-19 Cases: From Hematopoietic Stem Cell Recruitment and Chemotaxis to Thrombo-inflammation.
    Lintzmaier Petiz L, Glaser T, Scharfstein J, Ratajczak MZ, Ulrich H. Lintzmaier Petiz L, et al. Stem Cell Rev Rep. 2021 Feb;17(1):241-252. doi: 10.1007/s12015-021-10129-7. Epub 2021 Feb 11. Stem Cell Rev Rep. 2021. PMID: 33575962 Free PMC article. Review.

Cited by

References

    1. Laing AG et al. A dynamic COVID-19 immune signature includes associations with poor prognosis. Nat. Med 26, 1623–1635 (2020). - PubMed
    1. Lucas C et al. Longitudinal analyses reveal immunological misfiring in severe COVID-19. Nature 584, 463–469 (2020). - PMC - PubMed
    1. Mathew D et al. Deep immune profiling of COVID-19 patients reveals distinct immunotypes with therapeutic implications. Science 369, eabc8511 (2020). - PMC - PubMed
    1. Nienhold R et al. Two distinct immunopathological profiles in autopsy lungs of COVID-19. Nat. Commun 11, 5086 (2020). - PMC - PubMed
    1. Wang W et al. High-dimensional immune profiling by mass cytometry revealed immunosuppression and dysfunction of immunity in COVID-19 patients. Cell. Mol. Immunol 17, 650–652 (2020). - PMC - PubMed

Publication types

MeSH terms