. 2021 Mar 29;22(1):220.
doi: 10.1186/s12864-021-07472-x.

In silico analysis of bacterial translation factors reveal distinct translation event specific pI values

Affiliations

In silico analysis of bacterial translation factors reveal distinct translation event specific pI values

Soma Jana et al. BMC Genomics. .

Abstract

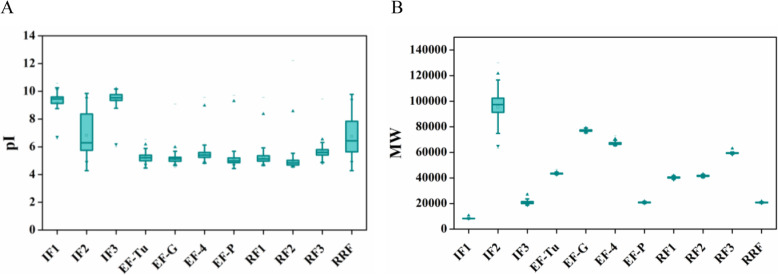
Background: Protein synthesis is a cellular process that takes place through the successive translation events within the ribosome by the event-specific protein factors, namely, initiation, elongation, release, and recycling factors. In this regard, we asked the question about how similar are those translation factors to each other from a wide variety of bacteria? Hence, we did a thorough in silico study of the translation factors from 495 bacterial sp., and 4262 amino acid sequences by theoretically measuring their pI and MW values that are two determining factors for distinguishing individual proteins in 2D gel electrophoresis in experimental procedures. Then we analyzed the output from various angles.

Results: Our study revealed the fact that it's not all same, or all random, but there are distinct orders and the pI values of translation factors are translation event specific. We found that the translation initiation factors are mainly basic, whereas, elongation and release factors that interact with the inter-subunit space of the intact 70S ribosome during translation are strictly acidic across bacterial sp. These acidic elongation factors and release factors contain higher frequencies of glutamic acids. However, among all the translation factors, the translation initiation factor 2 (IF2) and ribosome recycling factor (RRF) showed variable pI values that are linked to the order of phylogeny.

Conclusions: From the results of our study, we conclude that among all the bacterial translation factors, elongation and release factors are more conserved in terms of their pI values in comparison to initiation and recycling factors. Acidic properties of these factors are independent of habitat, nature, and phylogeny of the bacterial species. Furthermore, irrespective of the different shapes, sizes, and functions of the elongation and release factors, possession of the strictly acidic pI values of these translation factors all over the domain Bacteria indicates that the acidic nature of these factors is a necessary criterion, perhaps to interact into the partially enclosed rRNA rich inter-subunit space of the translating 70S ribosome.

Keywords: Isoelectric point; Molecular weight; Phylogeny; Ribosome; Translation; Translation factors.


Conflict of interest statement

The authors declare that they have no competing interests.

Figures

Fig. 1
Fig. 1
Box plot diagram of pI values and MW values of the translation factors. a pI value distribution of translation factors. b MW value distribution of translation factors. In both the cases, a and b, of the box plot diagrams, the lower hinge showed the first quartile (25%), whereas the upper hinge represented the third quartile (75%). The sign (−) above and below the box diagrams represented the maximum and minimum values respectively. The upper and lower solid triangles represented 99 and 1% values of the data set respectively. The horizontal line and the box inside the box plot represented the median and mean values of samples respectively
Fig. 2
Fig. 2
Amino acid frequency distribution of elongation and release factors. In each case of the elongation (EF-F, EF-G, EF-4, and EF-P) and release factors (RF1, RF2, and RF3), we selected 60 amino acid sequences that correspond to 60 bacterial species to study the amino acid frequency distribution. Each colour represented each randomly selected bacterial species
Fig. 3
Fig. 3
Surface charge distribution of the elongation and release factors. On the left of every panel, the 70S ribosome (grey ribbons) bound translation factor (inset, red ribbon) had been used as a thumbnail to reveal the corresponding orientation of translation factors shown next to it on the middle. The surface charges of the translation factors are shown in the middle. At the right of every panel surface charges of the translation factors had been displayed in 180 degree rotated state along the horizontal plane: The red dotted box (inset) indicated the location of the translation factors bound with 70S ribosome; EF-Tu – 70S ribosome (PDB ID: 5AFI) [47], EF-G – 70S ribosome (PDB ID: 3JA1) [48], EF-4 – 70S ribosome (PDB ID: 5J8B) [49], EF-P – 70S ribosome (PDB ID: 6ENJ) [50], RF1 – 70S ribosome (PDB ID: 6DNC) [51], RF2 – 70S ribosome (PDB ID: 5MDV) [52], and RF3 – 70S ribosome (PDB ID: 6GXM) [53]. The gray dotted boxes showed the surface charge distribution of the elongation and release factors [–19]. All the domains of these factors were marked on the right side and the left side of their structures. The calculated electrostatic net charge of EF-Tu (PDB ID: 2FX3) was − 1.40e +01e, EF-G (PDB ID: 3J0E) was − 1.50e +01e, EF-4 (PDB ID: 3DEG) was − 2.00e +01e, EF-P (PDB ID: 3OYY) was − 8.00e +00e, RF1 (PDB ID: 4V7P) was − 1.40e +01e, RF2 (PDB ID: 5MGP) was − 2.60e +01e, RF3 (PDB ID: 4 V85) was − 7.00e +00e. Red and blue colour indicated negative charge and positive charge respectively whereas white colour indicates neutral charge
Fig. 4
Fig. 4
Phylogenetic tree constructed using primary amino acid sequences of IF2 and RRF proteins. a Phylogenetic analysis of IF2 protein. b Phylogenetic analysis of RRF protein. In both cases, a and b, we analyzed the evolutionary history using the Maximum Likelihood method based on the JTT matrix-based model. We took 500 bootstrap replicates to build the phylogenetic tree. Numbers near the branches refer to the bootstrap percentages (greater than 50% bootstrap replicates only shown here). The tree had been drawn to scale after eliminating all positions containing gaps and missing data. The branch lengths were measured by the number of substitutions per site. Blue triangles and red circles refer to the basic and acidic pI values respectively
Fig. 5
Fig. 5
Summary of the study as a schematic representation. This figure showed translating intact 70S ribosome, initiation, elongation, release, and recycling factors along with the mean pI values and standard deviation values. Red and blue colour referred to the acidic and basic mean pI values, respectively. The dark grey colour of IF2 and RRF represented the mean pI values close to neutral with high standard deviation values

References

    1. Wilson DN, Nierhaus KH. The weird and wonderful world of bacterial ribosome regulation. Crit Rev Biochem Mol Biol. 2007;42:187–219. doi: 10.1080/10409230701360843. - DOI - PubMed
    1. Ramakrishnan V. Ribosome structure and the mechanism of translation. Cell. 2002;108:557–572. doi: 10.1016/S0092-8674(02)00619-0. - DOI - PubMed
    1. Noller HF, Lancaster L, Mohan S, Zhou J. Ribosome structural dynamics in translocation: yet another functional role for ribosomal RNA. Q Rev Biophys. 2017;50:e12. doi: 10.1017/S0033583517000117. - DOI - PubMed
    1. Noeske J, Cate JH. Structural basis for protein synthesis: snapshots of the ribosome in motion. Curr Opin Struct Biol. 2012;22:743–749. doi: 10.1016/j.sbi.2012.07.011. - DOI - PMC - PubMed
    1. O’Farrell PH. High resolution two-dimensional electrophoresis of proteins. J Biol Chem. 1975;250:4007–4021. doi: 10.1016/S0021-9258(19)41496-8. - DOI - PMC - PubMed