. 2021 Mar 30;17(1):32.
doi: 10.1186/s13007-021-00731-8.

Isotope ratio-based quantification of carbon assimilation highlights the role of plastidial isoprenoid precursor availability in photosynthesis

Affiliations

Isotope ratio-based quantification of carbon assimilation highlights the role of plastidial isoprenoid precursor availability in photosynthesis

Matthew E Bergman et al. Plant Methods. .

Abstract

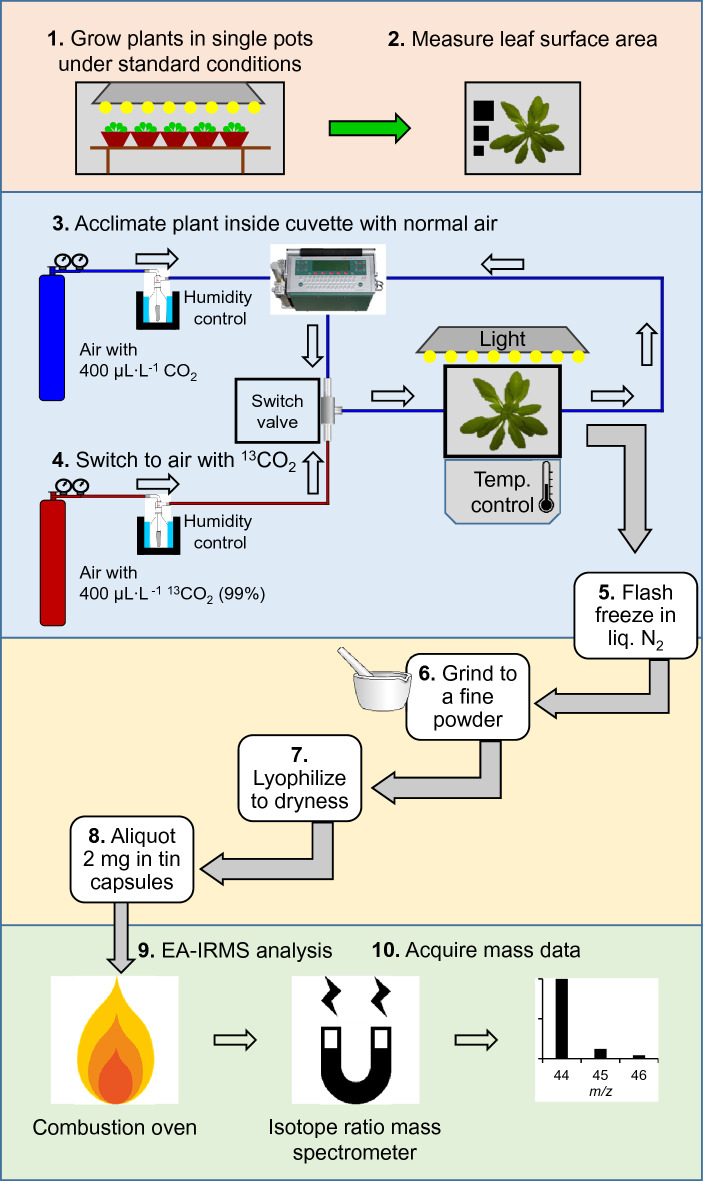
Background: We report a method to estimate carbon assimilation based on isotope ratio-mass spectrometry (IRMS) of 13CO2 labeled plant tissue. Photosynthetic carbon assimilation is the principal experimental observable which integrates important aspects of primary plant metabolism. It is traditionally measured through gas exchange. Despite its centrality in plant research, gas exchange performs poorly with rosette growth habits typical of Arabidopsis thaliana, mutant lines with limited biomass, and accounts poorly for leaf shading.

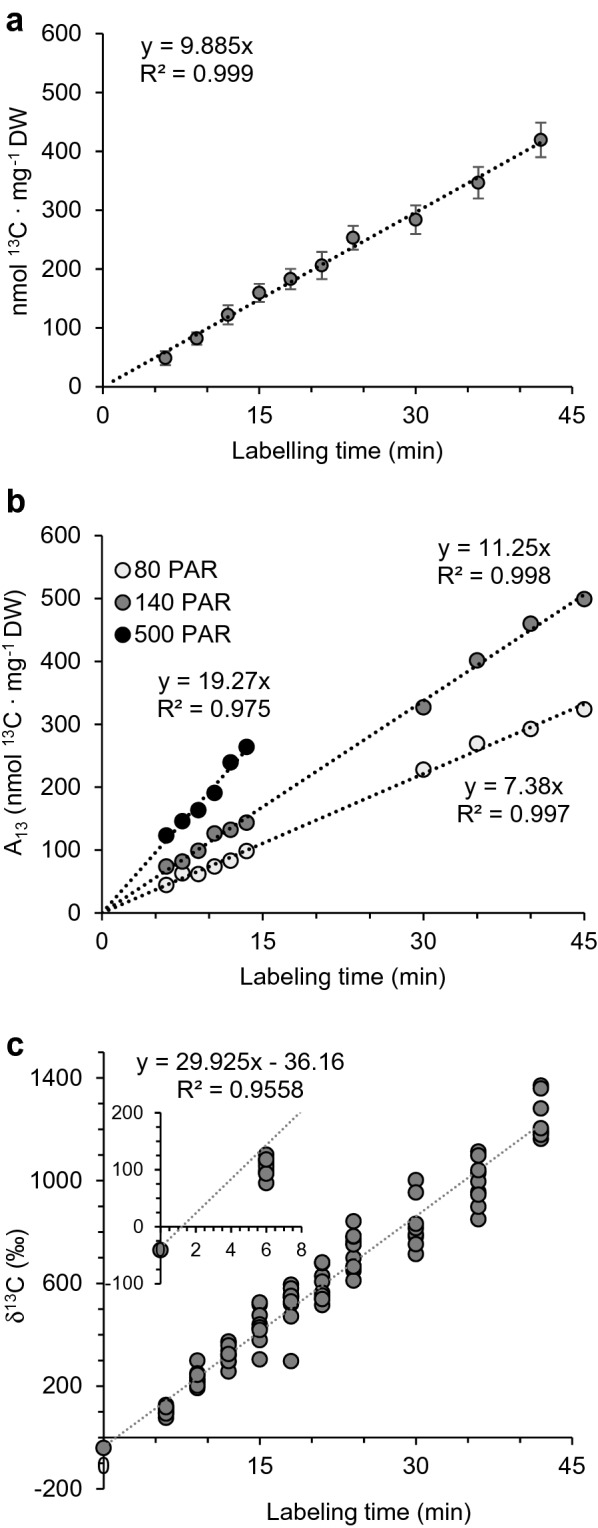
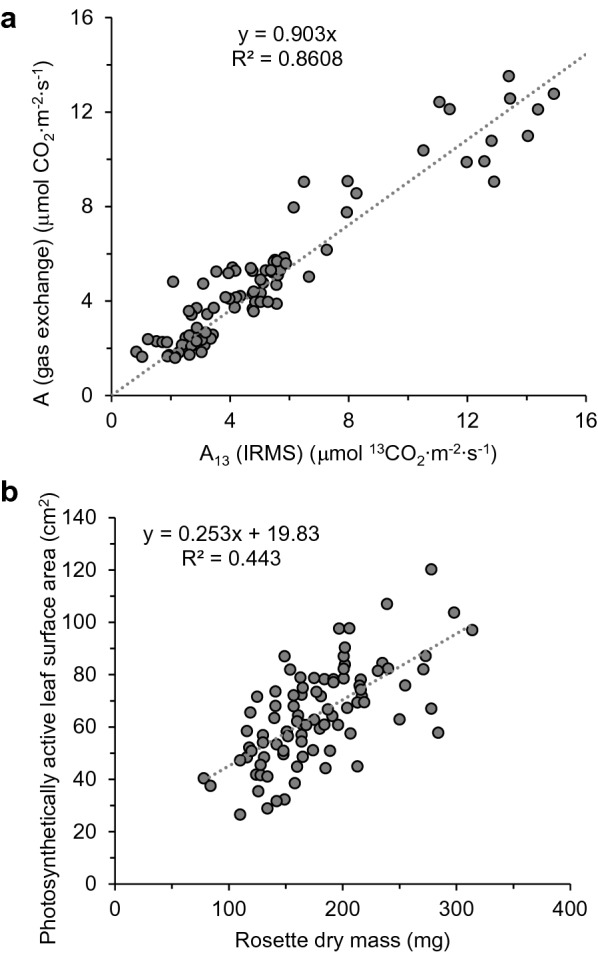
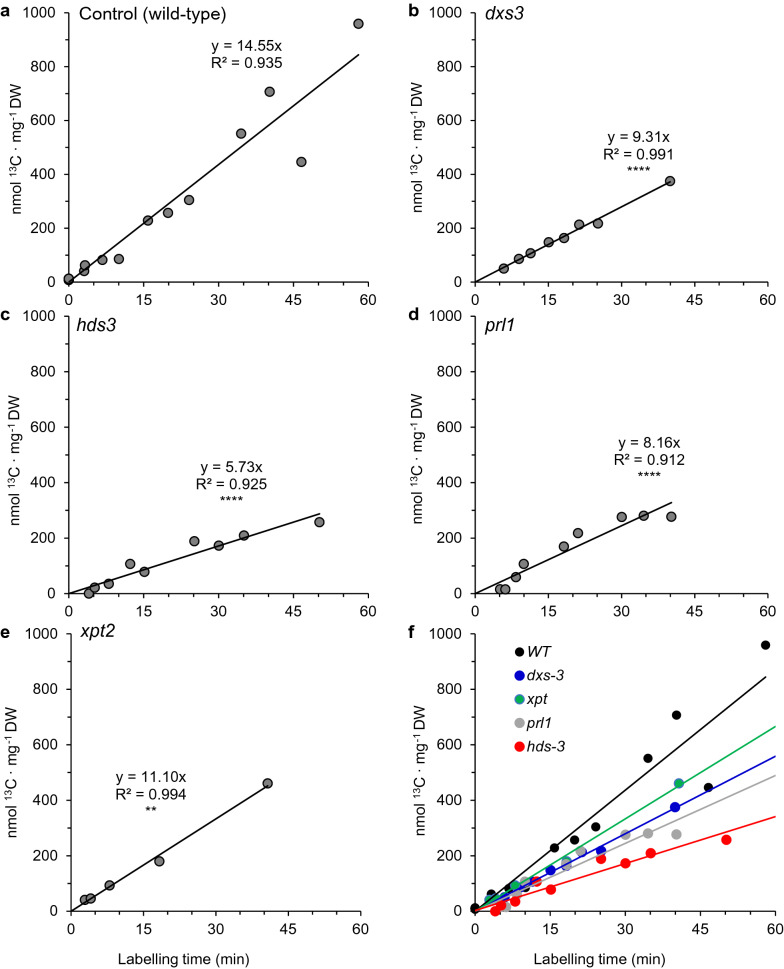
Results: IRMS-based carbon assimilation values from plants labeled at different light intensities were compared to those obtained by gas exchange, and the two methods yielded similar values. Using this method, we observed a strong correlation between 13C content and labeling time (R2 = 0.999) for 158 wild-type plants labeled for 6 to 42 min. Plants cultivated under different light regimes showed a linear response with respect to carbon assimilation, varying from 7.38 nmol 13C mg-1 leaf tissue min-1 at 80 PAR to 19.27 nmol 13C mg-1 leaf tissue min-1 at 500 PAR. We applied this method to examine the link between inhibition of the 2C-methyl-D-erythritol-4-phosphate (MEP) pathway and suppression of photosynthesis. A significant decrease in carbon assimilation was observed when metabolic activity in the MEP pathway was compromised by mutation or herbicides targeting the MEP pathway. Mutants affected in MEP pathway genes 1-DEOXY-D-XYLULOSE 5-PHOSPHATE SYNTHASE (DXS) or 1-HYDROXY-2-METHYL-2-(E)-BUTENYL 4-DIPHOSPHATE SYNTHASE (HDS) showed assimilation rates 36% and 61% lower than wild type. Similarly, wild type plants treated with the MEP pathway inhibitors clomazone or fosmidomycin showed reductions of 52% and 43%, respectively, while inhibition of the analogous mevalonic acid pathway, which supplies the same isoprenoid intermediates in the cytosol, did not, suggesting inhibition of photosynthesis was specific to disruption of the MEP pathway.

Conclusions: This method provides an alternative to gas exchange that offers several advantages: resilience to differences in leaf overlap, measurements based on tissue mass rather than leaf surface area, and compatibility with mutant Arabidopsis lines which are not amenable to gas exchange measurements due to low biomass and limited leaf surface area. It is suitable for screening large numbers of replicates simultaneously as well as post-hoc analysis of previously labeled plant tissue and is complementary to downstream detection of isotopic label in targeted metabolite pools.

Keywords: 2C-methyl-D-erythritol 4-phosphate pathway; Arabidopsis thaliana; Clomazone; Fosmidomycin; Isoprenoid metabolism; Isotope ratio mass spectrometry; Photosynthetic carbon assimilation; Stable isotope labeling.


Conflict of interest statement

The authors declare that they have no competing interests.

Figures

Fig. 1
Fig. 1
Involvement of the 2C-methyl-d-erythritol-4-phosphate (MEP) pathway in the biosynthesis of photosynthetic co-factors. The MEP pathway produces isopentenyl and dimethylallyl diphosphate (IDP and DMADP, boxed) in the plastid, which supplies PQ (plastoquinone), Chl (chlorophyll a and b), and PhyQ (phylloquinone) biosynthesis. Mutants (blue italics) and herbicides (red, bold) used in this study are shown next to the affected steps. Enzymes are shown in bold on the left. The mevalonate pathway, which yields IDP and DMADP in the cytosol, is enclosed in the solid box. The MEP pathway is directly linked to the formation of photosynthetic machinery by providing IDP and DMADP which are condensed into geranylgeranyl diphosphate (GGDP) by the prenyl transferase GGDP synthase (GGDS). GGDP undergoes three subsequent reductions to form phytyl diphosphate through dihydrogeranylgeranyl diphosphate and tetrahydrogeranylgeranyl diphosphate. Phytyl diphosphate provides the phytyl tail for phylloquinone and chlorophyll. The MEP pathway further supports photosynthesis through 8 total step-wise condensations of IDP with DMADP to form SDP, which becomes the hydrocarbon tail for plastoquinone. Herbicide abbreviations are as follows: CLZ, clomazone; FSM, fosmidomycin; NFZ, norflurazon; MEV, mevinolin. Biosynthetic intermediates are as follows: GAP, d-glyceraldehyde-3-phosphate; DXP, 1-deoxy-d-xylulose 5-phosphate; MEP, 2C-methyl-d-erythritol 4-phosphate; CDP-ME, 4-(cytidine 5′-diphospho)-2-C-methyl-d-erythritol; CDP-MEP, 4-(cytidine 5′-diphospho)-2-C-methyl-d-erythritol-2-phosphate; MEcDP, 2C-methyl-d-erythritol-2,4-cyclodiphosphate; HMBDP, 1-hydroxy-2-methyl-2-(E)-butenyl-4-diphosphate; SDP, solanesyl diphosphate; GGDP, geranylgeranyl diphosphate; AcCoA, acetyl-CoA; HMG-CoA, hydroxymethylglutaryl-CoA; FDP, farnesyl diphosphate. Enzymes abbreviations are as follows: DXS, 1-deoxy-d-xylulose 5-phosphate synthase; DXR, 1-deoxy-d-xylulose 5-phosphate reductoisomerase; MCT, 2C-methyl-d-erythritol 4-phosphate cytidyltransferase; CMK, 4-(cytidine 5′-diphospho)-2C-methyl-d-erythritol kinase; MDS, 2C-methyl-d-erythritol-2,4- cyclodiphosphate synthase; HDS, 4-hydroxy-3-methylbut-2-enyl diphosphate synthase; HDR, 4-hydroxy-3-methylbut-2-enyl diphosphate reductase; PSY, phytoene synthase; PDS, 15-cis-phytoene desaturase. Dotted arrows represent multiple steps
Fig. 2
Fig. 2
Workflow for whole plant isotopic labeling and quantification of 13C label by EA-IRMS. Solid arrows signify the order of steps. Hollow arrows represent gas flow. Both air sources (normal and labeled air) were supplied by compressed air tanks containing 400 μL L−1 CO2 or 13CO2 (99% enrichment) in a mixture of nitrogen:oxygen (80:20). Air was (de)humidified by passing through a chilled wash bottle containing water. CO2 and H2O vapor were quantified before entering the cuvette (reference) and in the cuvette exhaust (sample). After processing labeled plant tissue, 2 mg aliquots were analyzed by EA-IRMS, which consisted of combustion of the sample to carbon dioxide, separation in a magnetic sector mass analyzer, and data acquisition
Fig. 3
Fig. 3
Assimilation of 13C during time course labeling assays of wild-type Arabidopsis as determined by elemental analysis-isotope ratio mass spectrometry (EA-IRMS). a plants were equilibrated in a dynamic flow cuvette under standard conditions (see “Methods and materials” for details) in a natural atmosphere until a photosynthetic steady state was attained, then labeled with 400 μL L−1 13CO2 before flash freezing in liquid nitrogen. Aliquots of ground, lyophilized tissue were analyzed by EA-IRMS. Naturally occurring isotope abundance was subtracted using the y-intercept of the raw data, which was identical to the natural abundance detected in unlabeled controls. Data points indicate net 13C isotope assimilated (A13) by individual plants during the labeling experiment. Between 14 and 19 plants were used for each time point as follow: 6 min, n = 15; 9 min, n = 16; 12 min, n = 15; 15 min, n = 15; 18 min, n = 16; 21 min, n = 16; 24 min, n = 19; 30 min, n = 16; 36 min, n = 16; 42 min, n = 14. Error bars show standard deviation. b Light intensity was varied to assess the ability of this method to quantitatively describe carbon assimilation under different environmental conditions. Each point represents an individual plant. Time course labeling series were performed on plants cultivated and labeled under low (80 PAR, n = 10), medium (140 PAR, n = 10), or high light conditions (500 PAR, n = 6). Standard conditions were maintained for all other variables. c Alternative representation of data in a as 13C/12C isotope ratios where δ13C = (Rsample/RPDB − 1) × 1000, Rsample is the 13C/12C ratio of the sample, and RPDB is the same ratio of the PeeDee Belemnite reference material (0.0112372). The y-intercept value (− 36.16 ‰, see inset) can be used to infer the 13C discrimination in Arabidopsis and closely matches values obtained for unlabeled control plants, which is within the normal range for a C3 plant
Fig. 4
Fig. 4
Net carbon assimilation values (A) obtained from isotope ratio mass spectrometry (IRMS) of 13C labeled plant tissue are quantitatively similar to those obtained by gas exchange measurements. a Two methods to calculate A in time course labeled Arabidopsis plants adapted to different light intensities (80–500 PAR, n = 107 plants). Gas exchange measurements of cuvette enclosed plants were taken continuously during the 30–45 min pre-labeling adaptation phase, and reported values represent the average A in normal air for the 3 min prior to introducing the 13CO2-containing atmosphere. For each plant, the analogous IRMS-based carbon assimilation estimate was calculated from the raw IRMS data (μg 13C mg−1 D.W.) and converted to μmol 13CO2 m−2 s−1 based on their individual leaf surface areas, rosette dry weights, and labeling times. Outliers were identified by the interquartile range rule. b The correlation between surface area and dry mass of Arabidopsis rosettes is weak and insufficient to establish a general rule used in gas exchange and 13C labeling experiments. Surface area was estimated by comparison to a calibrated size standard as described in methods. Mass was determined following lyophilization of the intact rosette. Each point represents a single rosette stage Arabidopsis plant 50–70 days old. Outliers were removed according to the interquartile range rule
Fig. 5
Fig. 5
Assimilation of 13C by Arabidopsis MEP pathway mutants as determined by IRMS of 13CO2 time-course labeled whole plants (400 μL L−1). Each point represents a single intact plant (sample sizes shown in parenthesis) a wild-type (n = 10) and b dxs-3 (n = 8), c hds-3 (n = 9), d prl1 (n = 9), and e xpt2 (n = 5) mutant lines, combined in f. P-values are based on a Student’s t-test of the slopes compared to the control: **P < 0.01 and ****P < 0.0001
Fig. 6
Fig. 6
Assimilation of 13C by herbicide treated Arabidopsis wild-type as determined by IRMS of 13CO2 time-course labeled whole plants (400 μL L−1). Twenty-four hours prior to labeling, plants were treated with either a CAM (n = 9), b CLZ (n = 7), c FSM (n = 11), d MEV (n = 10), e NFZ (n = 6), combined in f. For controls, see Fig. 5a. Each point represents a single, intact plant. P-values are based on t-test of regression slopes compared to the control: ns, P ≥ 0.05; *P < 0.05; **P < 0.01; ***P < 0.001; ****P < 0.0001
Fig. 7
Fig. 7
Labeling of DMADP pool in Arabidopsis plants treated with MEP-pathway directed herbicides. Clomazone (CLZ) and fosmidomycin (FSM), which target the MEP pathway, cause significant reductions in flux into DMADP in plants incubated in an atmosphere containing 400 μL L−1 13CO2 90 min following treatment. In contrast, norflurazon (NFZ), which targets the downstream carotenoid biosynthetic enzyme phytoene desaturase, did not show decreases in 13C incorporation compared to controls. N = 3 for each group. P-values are based on Student’s two-tailed t-test: ns, P ≥ 0.05 and *P < 0.05

References

    1. Affek HP, Yakir D. Natural abundance carbon isotope composition of isoprene reflects incomplete coupling between isoprene synthesis and photosynthetic carbon flow. Plant Physiol. 2003;131(4):1727–1736. doi: 10.1104/pp.102.012294. - DOI - PMC - PubMed
    1. Allen DJ, Ort DR. Impacts of chilling temperatures on photosynthesis in warm-climate plants. Trends Plant Sci. 2001;6(1):36–42. doi: 10.1016/S1360-1385(00)01808-2. - DOI - PubMed
    1. Araki N, Kusumi K, Masamoto K, Niwa Y, Iba K. Temperature-sensitive Arabidopsis mutant defective in 1-deoxy-d-xylulose 5-phosphate synthase within the plastid non-mevalonate pathway of isoprenoid biosynthesis. Physiol Plant. 2000;108(1):19–24.
    1. Badger MR, Sharkey TD, von Caemmerer S. The relationship between steady-state gas exchange of bean leaves and the levels of carbon-reduction-cycle intermediates. Planta. 1984;160(4):305–313. doi: 10.1007/BF00393411. - DOI - PubMed
    1. Bagnall D, King R, Farquhar G. Temperature-dependent feedback inhibition of photosynthesis in peanut. Planta. 1988;175(3):348–354. doi: 10.1007/BF00396340. - DOI - PubMed

LinkOut - more resources