Multicenter Study
. 2021 Jul 15;89(8):e0010521.
doi: 10.1128/IAI.00105-21. Epub 2021 Jul 15.

Pharyngeal Microbial Signatures Are Predictive of the Risk of Fungal Pneumonia in Hematologic Patients

Affiliations
Multicenter Study

Pharyngeal Microbial Signatures Are Predictive of the Risk of Fungal Pneumonia in Hematologic Patients

Claudio Costantini et al. Infect Immun. .

Abstract

The ability to predict invasive fungal infections (IFI) in patients with hematological malignancies is fundamental for successful therapy. Although gut dysbiosis is known to occur in hematological patients, whether airway dysbiosis also contributes to the risk of IFI has not been investigated. Nasal and oropharyngeal swabs were collected for functional microbiota characterization in 173 patients with hematological malignancies recruited in a multicenter, prospective, observational study and stratified according to the risk of developing IFI. A lower microbial richness and evenness were found in the pharyngeal microbiota of high-risk patients that were associated with a distinct taxonomic and metabolic profile. A murine model of IFI provided biologic plausibility for the finding that loss of protective anaerobes, such as Clostridiales and Bacteroidetes, along with an apparent restricted availability of tryptophan, is causally linked to the risk of IFI in hematologic patients and indicates avenues for antimicrobial stewardship and metabolic reequilibrium in IFI.

Keywords: airway microbiome; antibiotics; hematological malignancies; indole-3-aldehyde; invasive fungal infection; metabolomics; tryptophan.


Figures
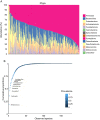
FIG 1
FIG 1
Oropharyngeal microbiome of hematologic patients is dominated by bacteria commonly associated with the oropharynx. (A) Bar plot showing bacterial composition (abundance percentage) of each sample at the phylum level. Taxa are differentiated by colors. Samples are ranked based on the abundance of Firmicutes. (B) Behavior of the cumulative proportions of taxa at genus level in the complete cohort versus number of observed taxa. The color of each taxon represents the prevalence of the taxon within the community. Taxa are ordered by increasing percentage value, and the first 10 most abundant genera are explicitly indicated by labels. These 10 taxa present a prevalence >50%.
FIG 2
FIG 2
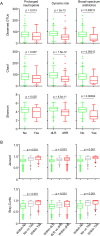
Microbiome composition differs between LR and HR oropharyngeal samples. (A) Boxplots of observed OTUs, Chao1, and Shannon alpha diversity indexes grouped by risk of IFI according to three distinct criteria (presence or not of prolonged neutropenia, dynamic LR, or HR according to SEIFEM algorithm, and use or not of broad-spectrum antibiotics). Significance was evaluated by applying a Kruskal-Wallis test (the P value is indicated). (B) Boxplots of Jaccard and Bray-Curtis beta diversity indexes evaluating distances within (LR, green; HR, red) or between (gray) LR and HR samples according to the three distinct criteria described for panel A. Significance was evaluated by applying a Kruskal-Wallis test (the P value is indicated).
FIG 3
FIG 3
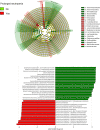
Oropharyngeal microbiomes have a different genus composition in function of prolonged neutropenia. Taxonomic visualization of statistically and biologically consistent differences between samples collected during the presence or absence of prolonged neutropenia. The cladogram simultaneously highlights high-level taxa and specific genera. Taxa (circles) are colored red when significantly (LEfSe, P < 0.05) associated with the presence of prolonged neutropenia, green when significantly associated with the absence of prolonged neutropenia, and yellow when not significantly associated with either group. The size of each circle is proportional to the abundance of the corresponding taxon in all samples. The histograms of the linear discriminant analysis (LDA) scores are computed for genera significantly associated with either the presence (red) or the absence (green) of prolonged neutropenia. LEfSe has been applied with default alpha values for the analysis of variance (ANOVA) and Wilcoxon tests (0.05), and the LDA effect size has been evaluated by setting the absolute value of the logarithmic LDA threshold equal to 3.5. Other LEfSe parameters have been set to the default.
FIG 4
FIG 4
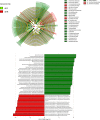
Oropharyngeal microbiomes have a different genera composition in function of dynamic risk stratification. Taxonomic visualization of statistically and biologically consistent differences between samples allocated to low risk (dLR) or high risk (dHR) for IFI by dynamic risk stratification. The cladogram simultaneously highlights high-level taxa and specific genera. Taxa (circles) are colored red when significantly (LEfSe, P < 0.05) associated with dHR, green when significantly associated with dLR, and yellow when not significantly associated with either group. The size of each circle is proportional to the abundance of the corresponding taxon in all samples. The histograms of the LDA scores are computed for genera significantly associated with either dHR (red) or dLR (green) groups. LEfSe has been applied with default alpha values for the ANOVA and Wilcoxon test (0.05) and the LDA effect size has been evaluated by setting the absolute value of the logarithmic LDA threshold equal to 3.5. Other LEfSe parameters have been set to the default.
FIG 5
FIG 5
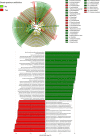
Oropharyngeal microbiomes have a different genera composition in function of broad-spectrum antibiotics use. Taxonomic visualization of statistically and biologically consistent differences between samples collected or not during treatments with broad-spectrum antibiotics. The cladogram simultaneously highlights high-level taxa and specific genera. Taxa (circles) are colored red when significantly (LEfSe, P < 0.05) associated with the use of broad-spectrum antibiotics, green when significantly associated with the absence of broad-spectrum antibiotics use, and yellow when not significantly associated with either group. The size of each circle is proportional to the abundance of the corresponding taxon in all samples. The histograms of the LDA scores are computed for genera significantly associated with either the use (red) or lack of use (green) of broad-spectrum antibiotics. LEfSe has been applied with default alpha values for the ANOVA and Wilcoxon test (0.05), and the LDA effect size has been evaluated by setting the absolute value of the logarithmic LDA threshold equal to 3.5. Other LEfSe parameters have been set to the default.
FIG 6
FIG 6
LR and HR oropharyngeal samples differ in tryptophan metabolism. (A and B) Box plots of trp biosynthesis pathway (A) and module (B) inferred by PICRUSt2 analysis according to MetaCyc and KEGG databases, respectively. These predicted metagenome functions were indicated by LEfSe as significantly differentially represented in the high- and low-risk groups. (C) Tryptophan (trp), kynurenines (kyn), and indole-3-aldehyde (3-IAld) levels (nmol/liter) were measured in oropharyngeal samples (n = 63; LR, 27; HR, 36) and expressed as means ± standard deviations (SD). *, P < 0.05 LR versus HR, unpaired t test.
FIG 7
FIG 7
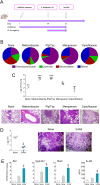
Murine model of aspergillosis validate the human findings. (A) Schematic representation of the protocol with antibiotics and A. fumigatus infection. i.n., intranasal. (B and C) Microbial composition (by qPCR) (B) and fungal growth (means ± SD) and histology (periodic acid-Schiff staining) (C) of lung from C57BL/6 mice intranasally infected with viable resting A. fumigatus conidia and treated with antibiotics 2 weeks before and continuing for a week after the infection. Pip/Taz, piperacillin-tazobactam. (D and E) Fungal growth, histology (D), and transcription factor gene expression (RT-PCR) and cytokine production (ELISA) (E) in infected C57BL/6 mice treated with an oral formulation of indole-3-aldehyde (3-IAld) 4 times the week before the infection. Assays were done at the end of treatments. **, P < 0.01; ***, P < 0.001, treated versus untreated (none) mice. Naïve, uninfected mice.

Comment in

  • Infect Immun. 89.

References

    1. Ananda-Rajah MR, Cheng A, Morrissey CO, Spelman T, Dooley M, Neville AM, Slavin M. 2011. Attributable hospital cost and antifungal treatment of invasive fungal diseases in high-risk hematology patients: an economic modeling approach. Antimicrob Agents Chemother 55:1953–1960. 10.1128/AAC.01423-10. - DOI - PMC - PubMed
    1. Brown GD, Denning DW, Gow NA, Levitz SM, Netea MG, White TC. 2012. Hidden killers: human fungal infections. Sci Transl Med 4:165rv13. 10.1126/scitranslmed.3004404. - DOI - PubMed
    1. Pagano L, Busca A, Candoni A, Cattaneo C, Cesaro S, Fanci R, Nadali G, Potenza L, Russo D, Tumbarello M, Nosari A, Aversa F, et al. 2017. Risk stratification for invasive fungal infections in patients with hematological malignancies: SEIFEM recommendations. Blood Rev 31:17–29. 10.1016/j.blre.2016.09.002. - DOI - PubMed
    1. Oliveira-Coelho A, Rodrigues F, Campos A, Jr, Lacerda JF, Carvalho A, Cunha C. 2015. Paving the way for predictive diagnostics and personalized treatment of invasive aspergillosis. Front Microbiol 6:411. 10.3389/fmicb.2015.00411. - DOI - PMC - PubMed
    1. Stanzani M, Lewis RE, Fiacchini M, Ricci P, Tumietto F, Viale P, Ambretti S, Baccarani M, Cavo M, Vianelli N. 2013. A risk prediction score for invasive mold disease in patients with hematological malignancies. PLoS One 8:e75531. 10.1371/journal.pone.0075531. - DOI - PMC - PubMed

Publication types

MeSH terms

Substances

LinkOut - more resources