. 2021 May 3;32(5):1210-1226.
doi: 10.1681/ASN.2020081142. Epub 2021 Mar 29.

Comparing Approaches to Normalize, Quantify, and Characterize Urinary Extracellular Vesicles

Affiliations

Comparing Approaches to Normalize, Quantify, and Characterize Urinary Extracellular Vesicles

Charles J Blijdorp et al. J Am Soc Nephrol. .

Abstract

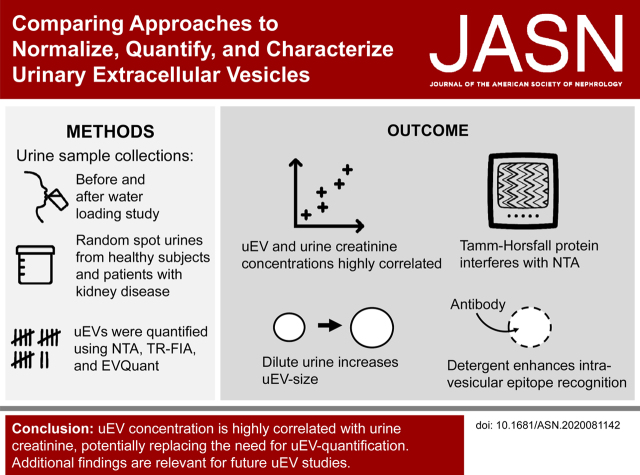
Background: Urinary extracellular vesicles (uEVs) are a promising source for biomarker discovery, but optimal approaches for normalization, quantification, and characterization in spot urines are unclear.

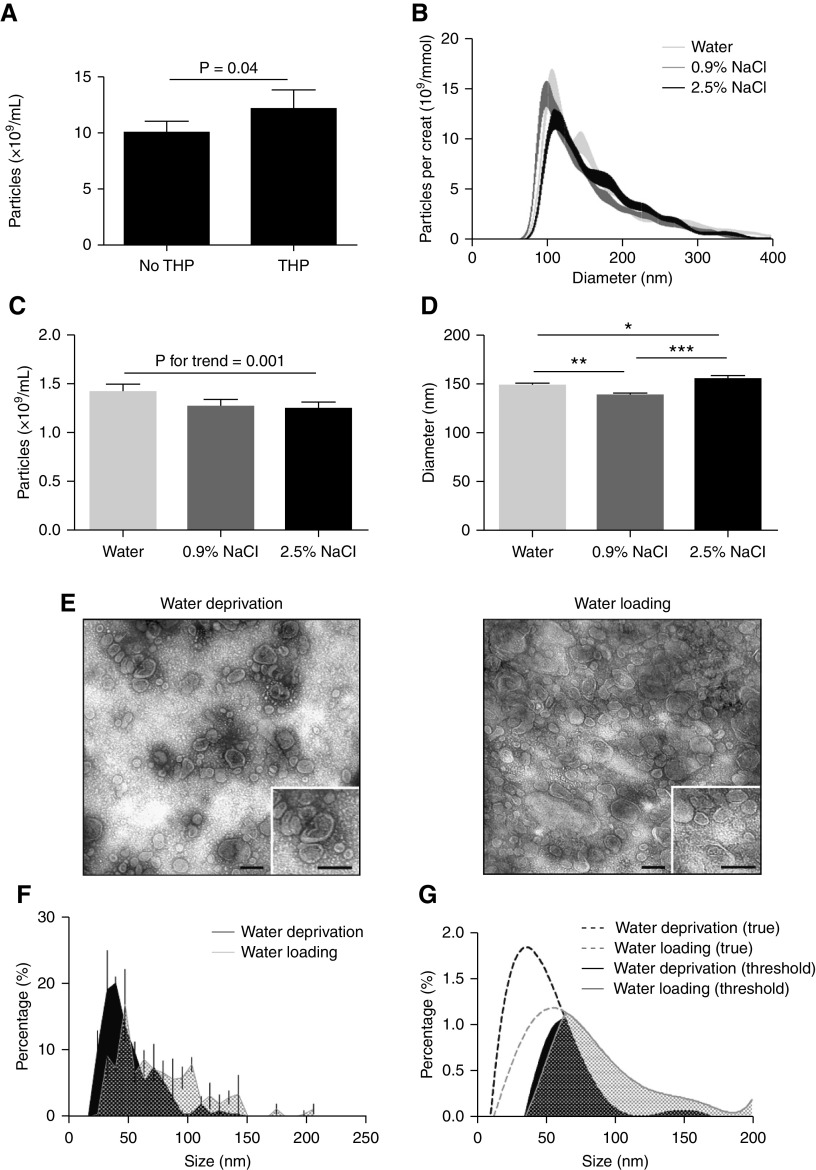
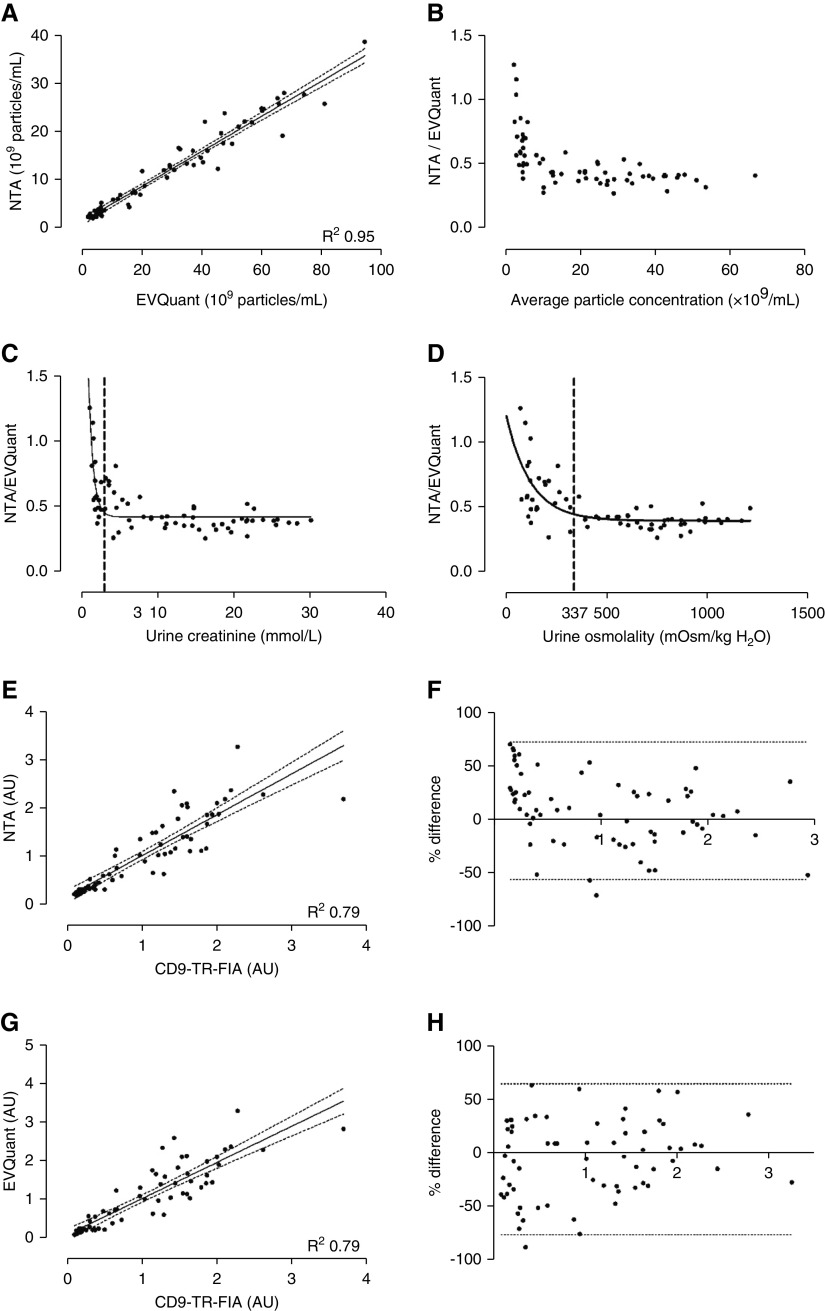
Methods: Urine samples were analyzed in a water-loading study, from healthy subjects and patients with kidney disease. Urine particles were quantified in whole urine using nanoparticle tracking analysis (NTA), time-resolved fluorescence immunoassay (TR-FIA), and EVQuant, a novel method quantifying particles via gel immobilization.

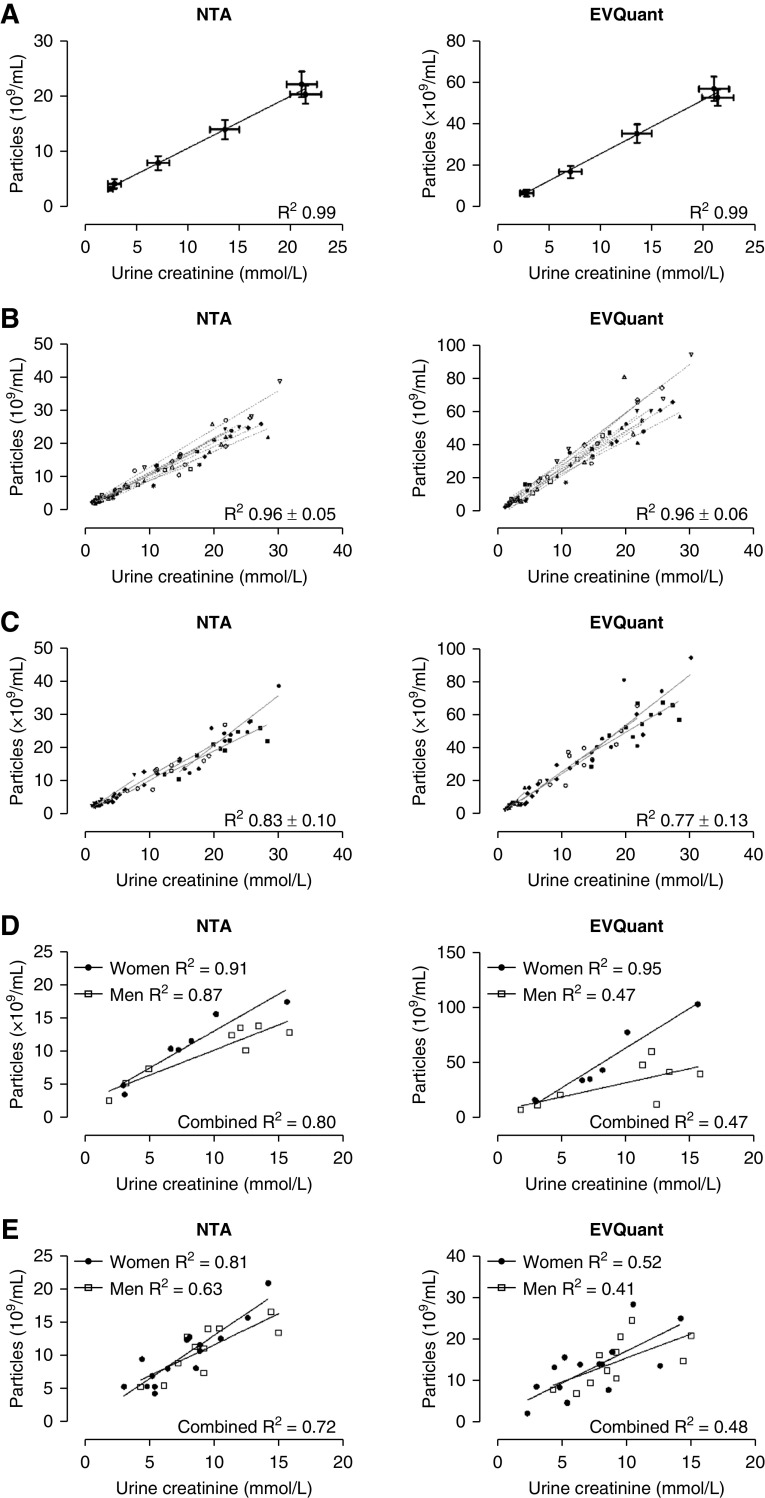
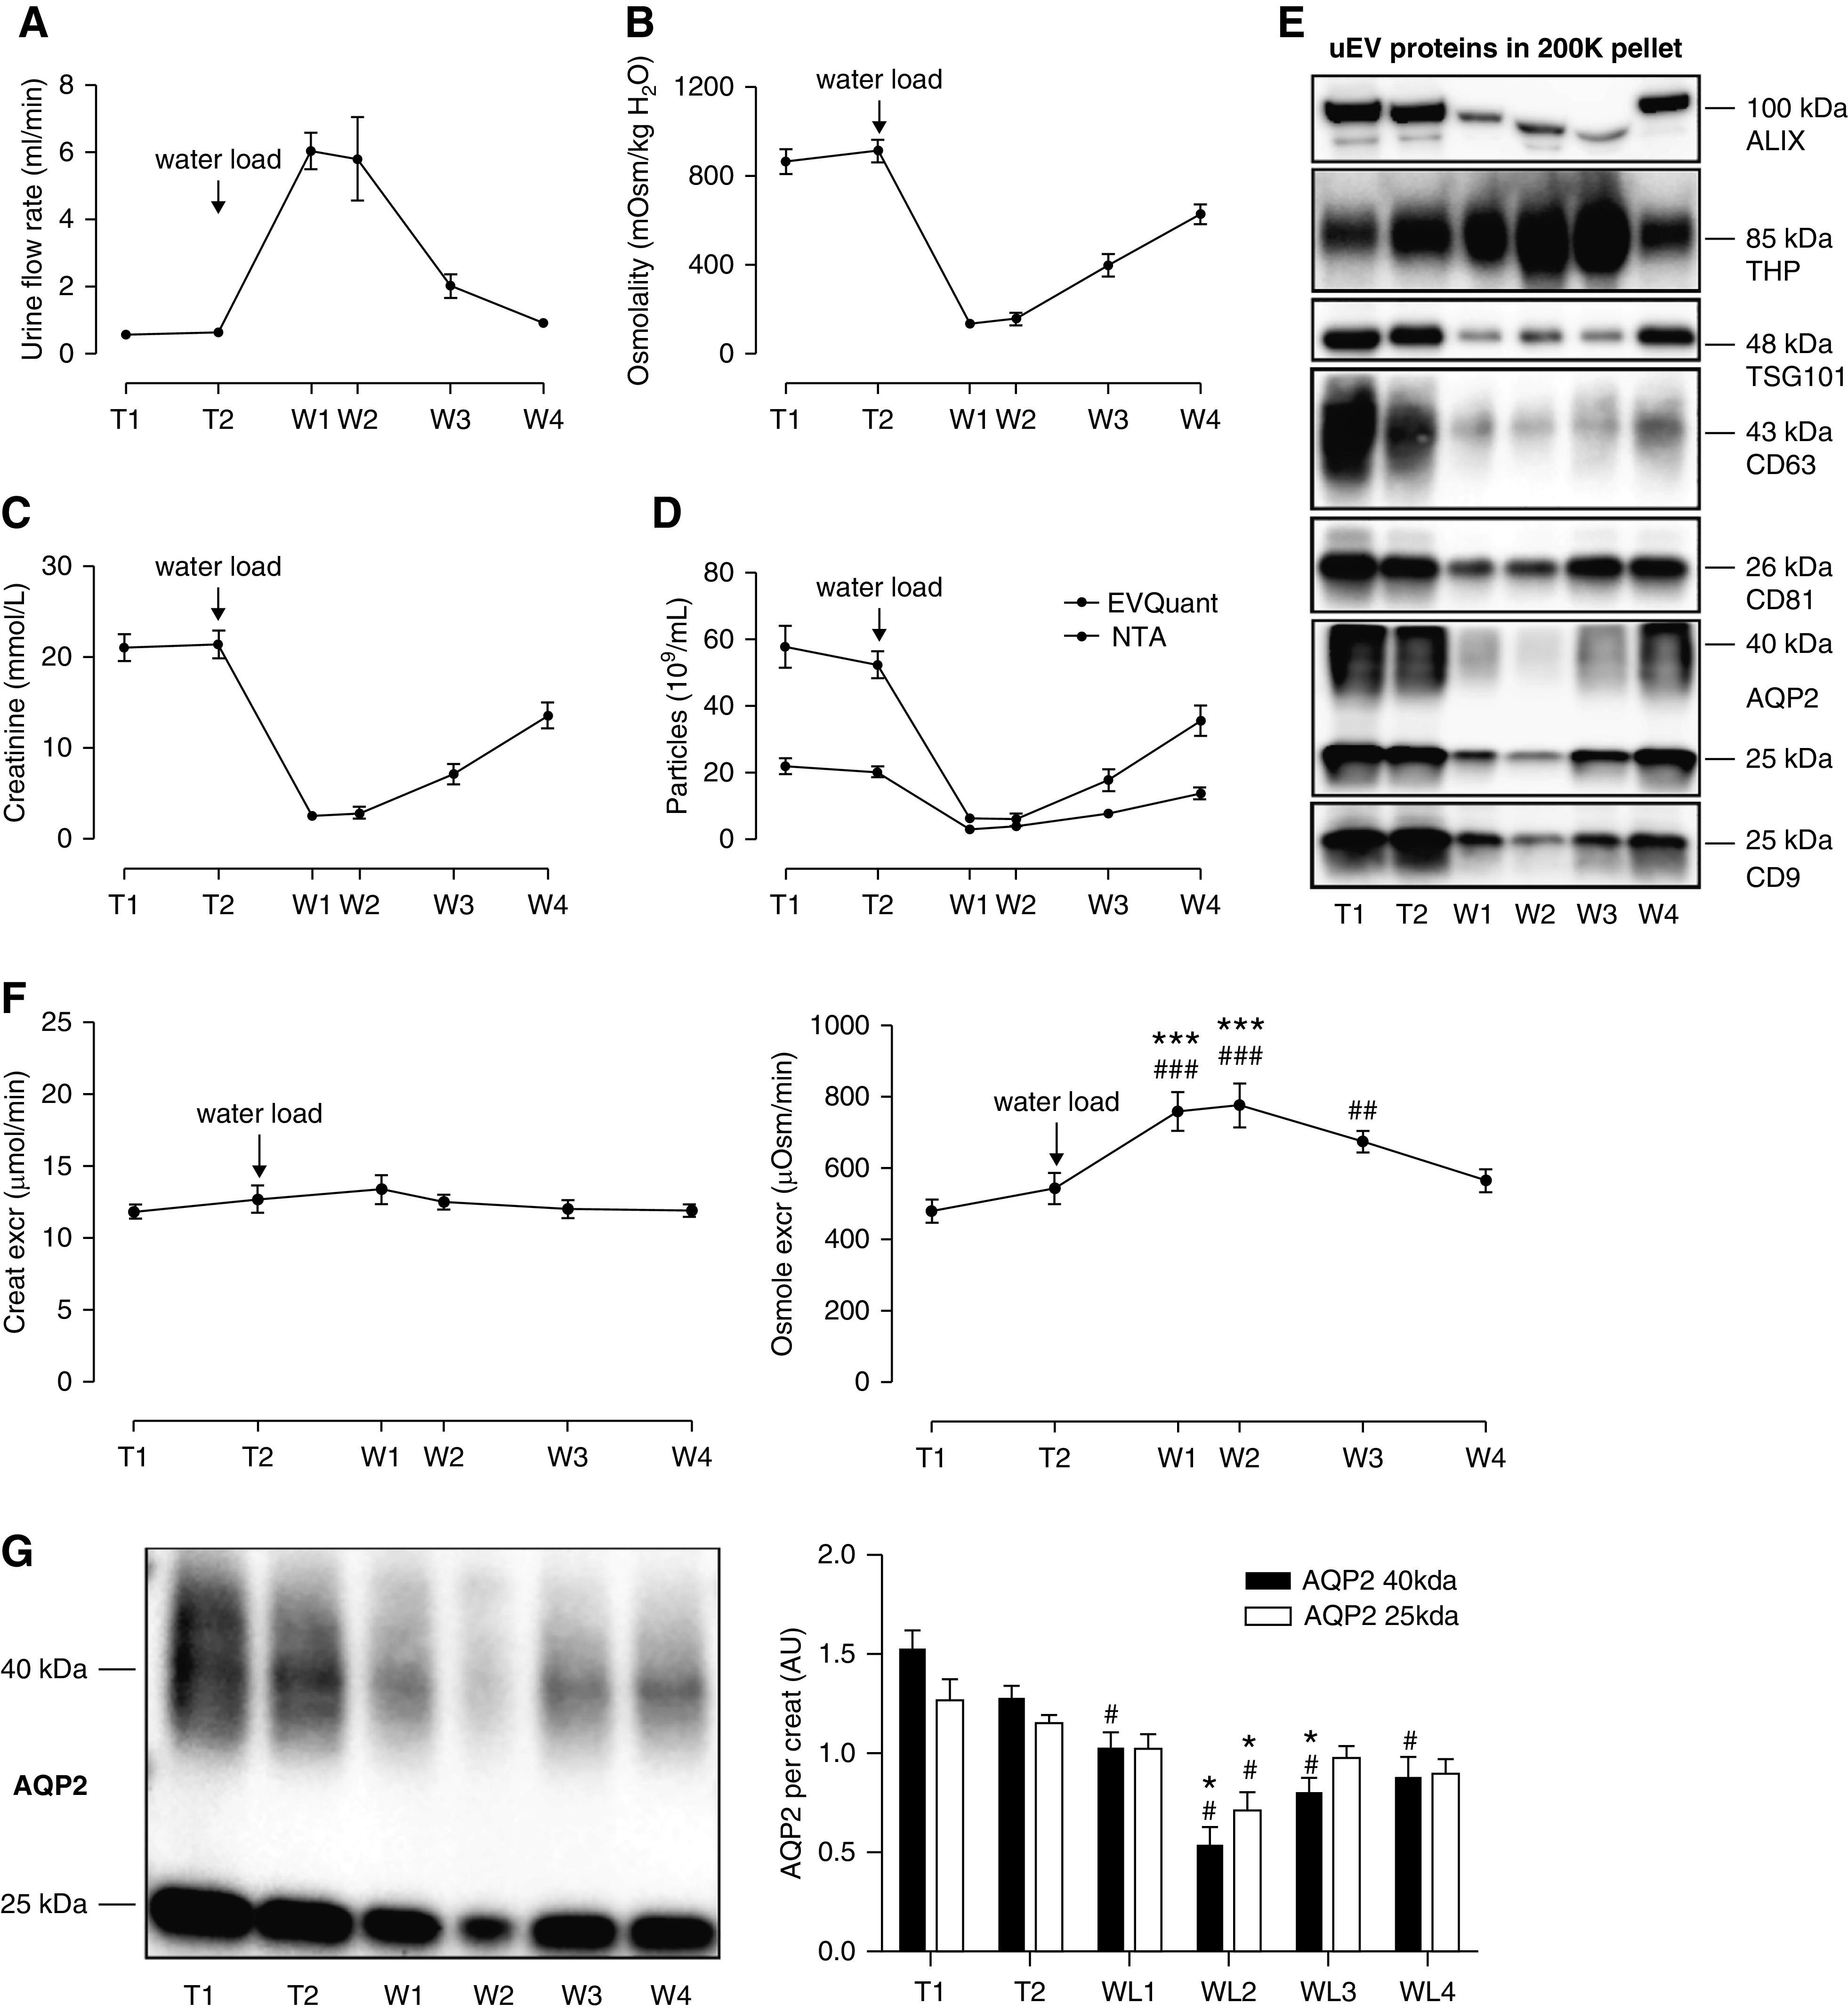
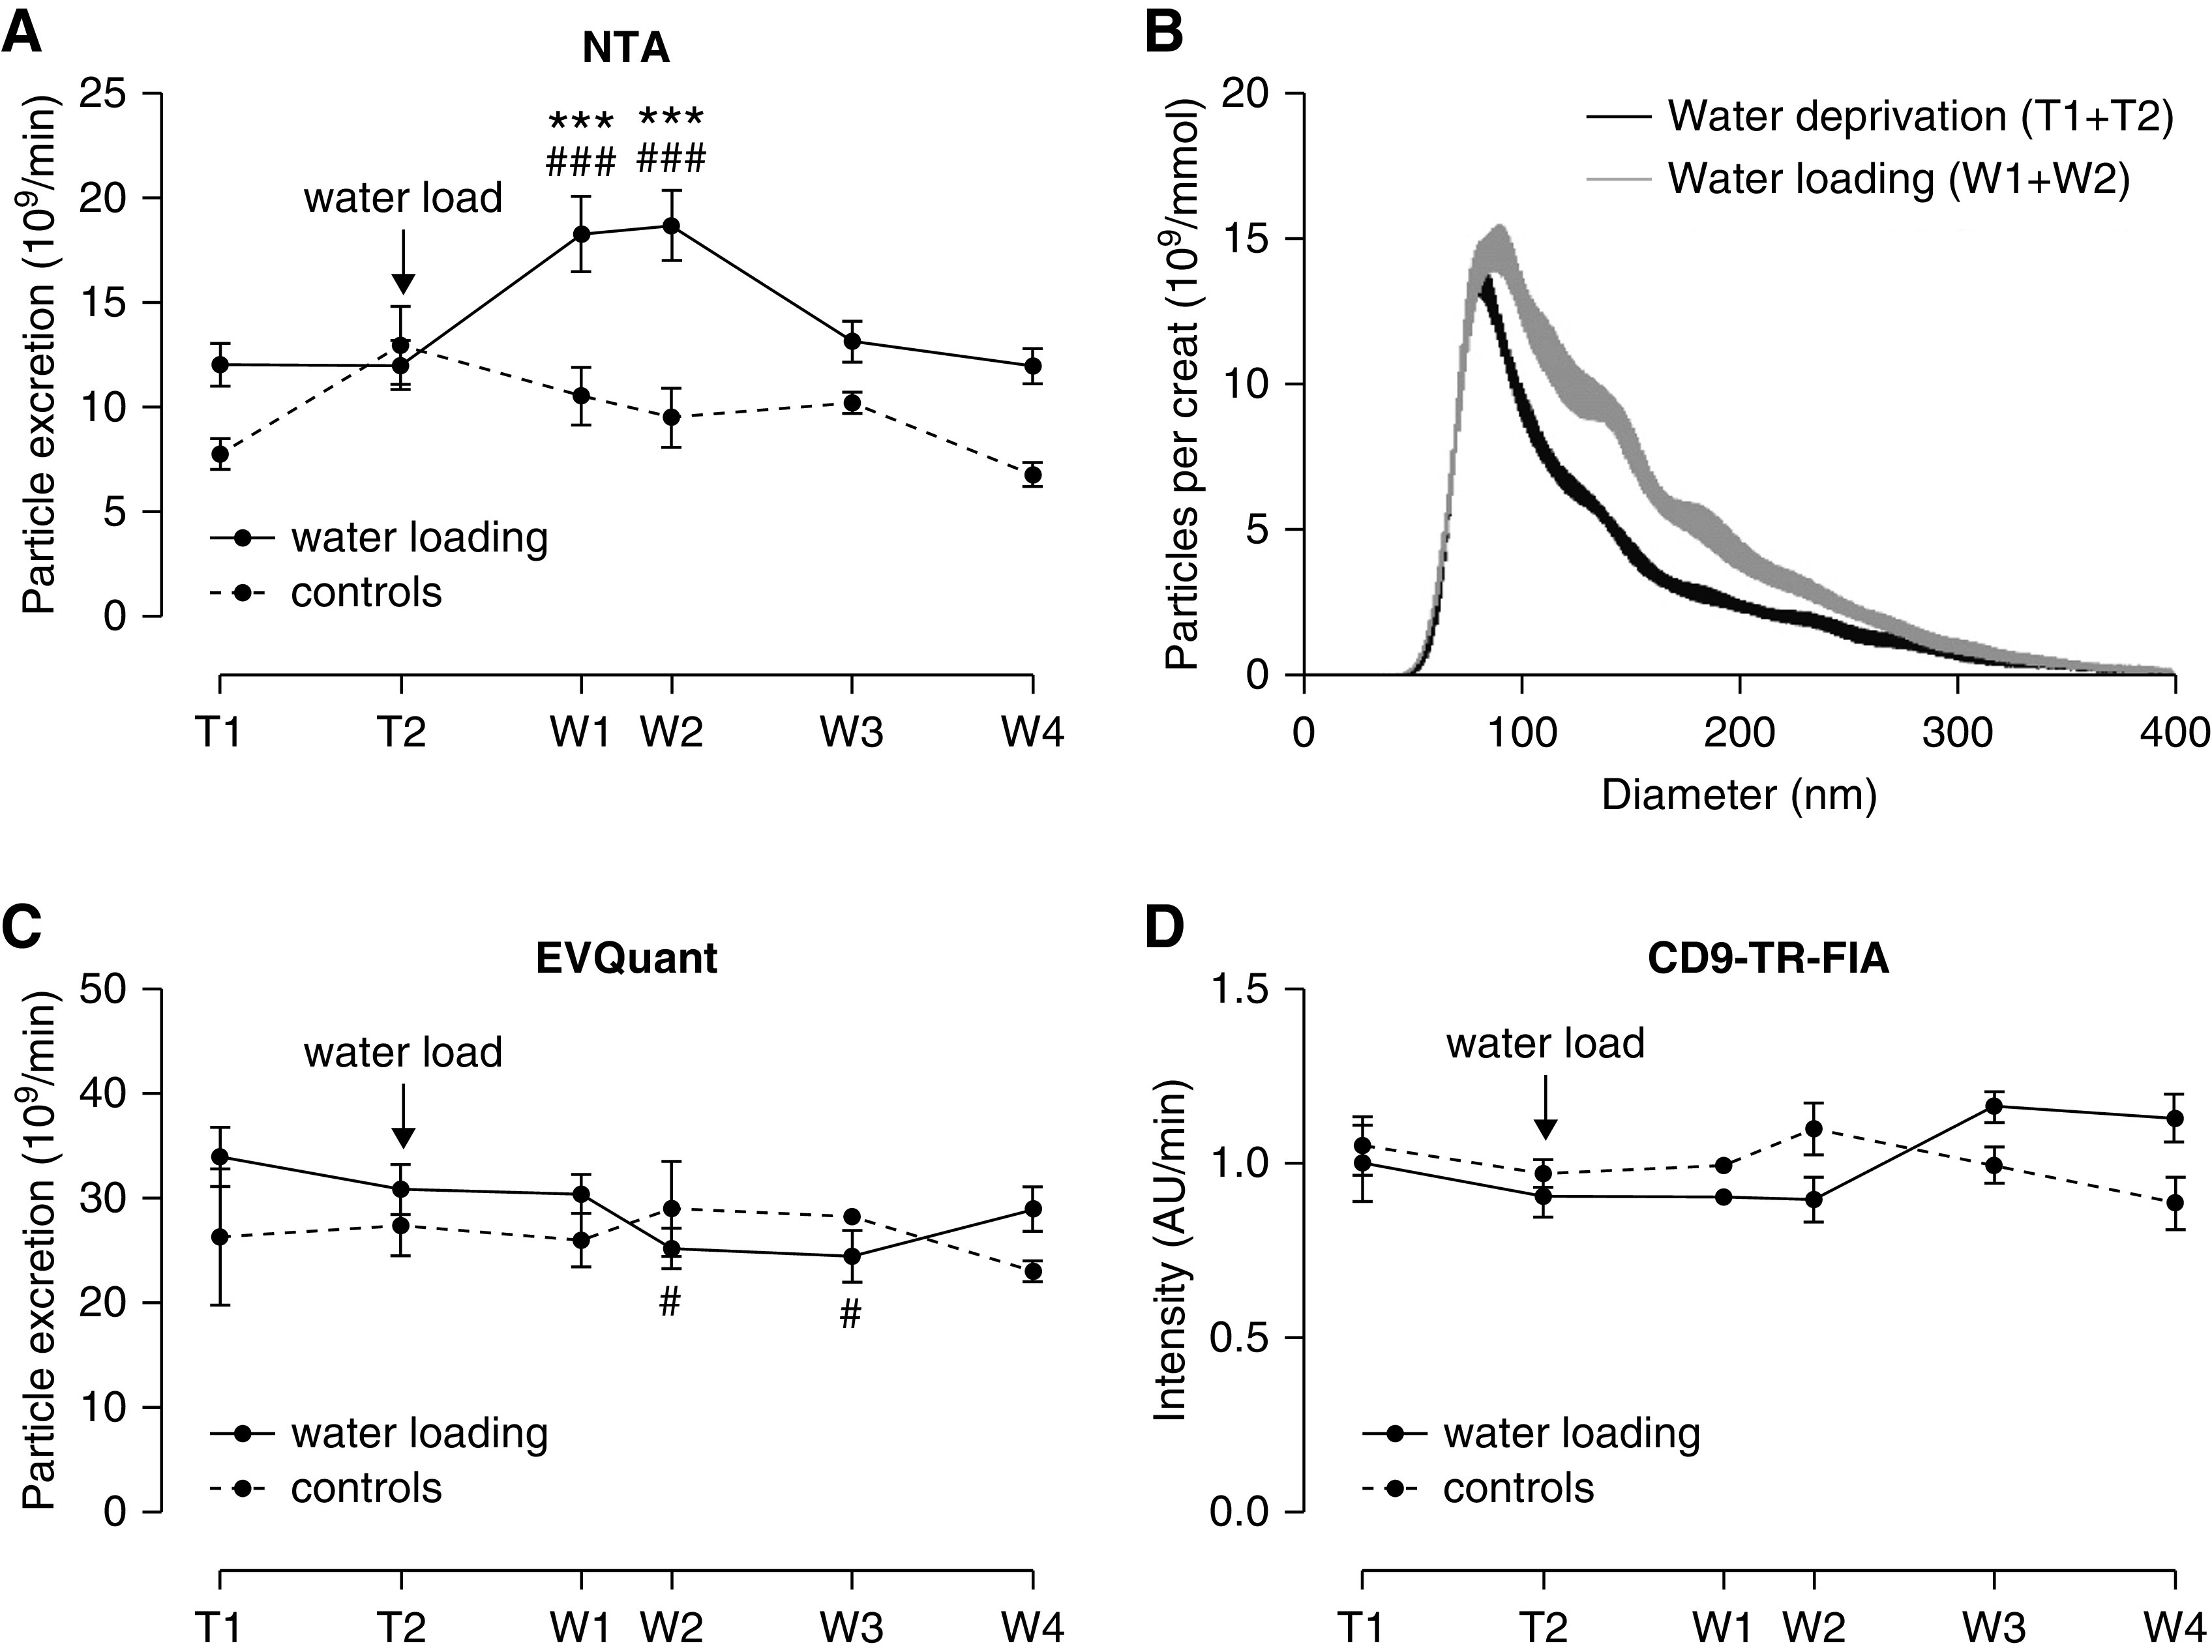
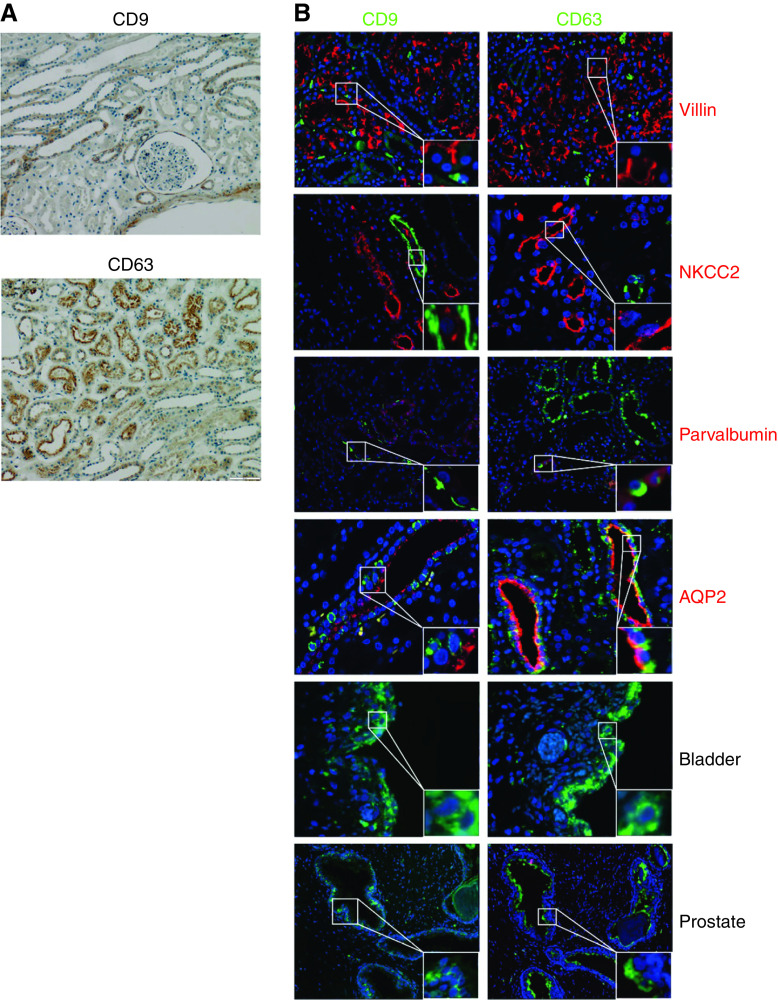
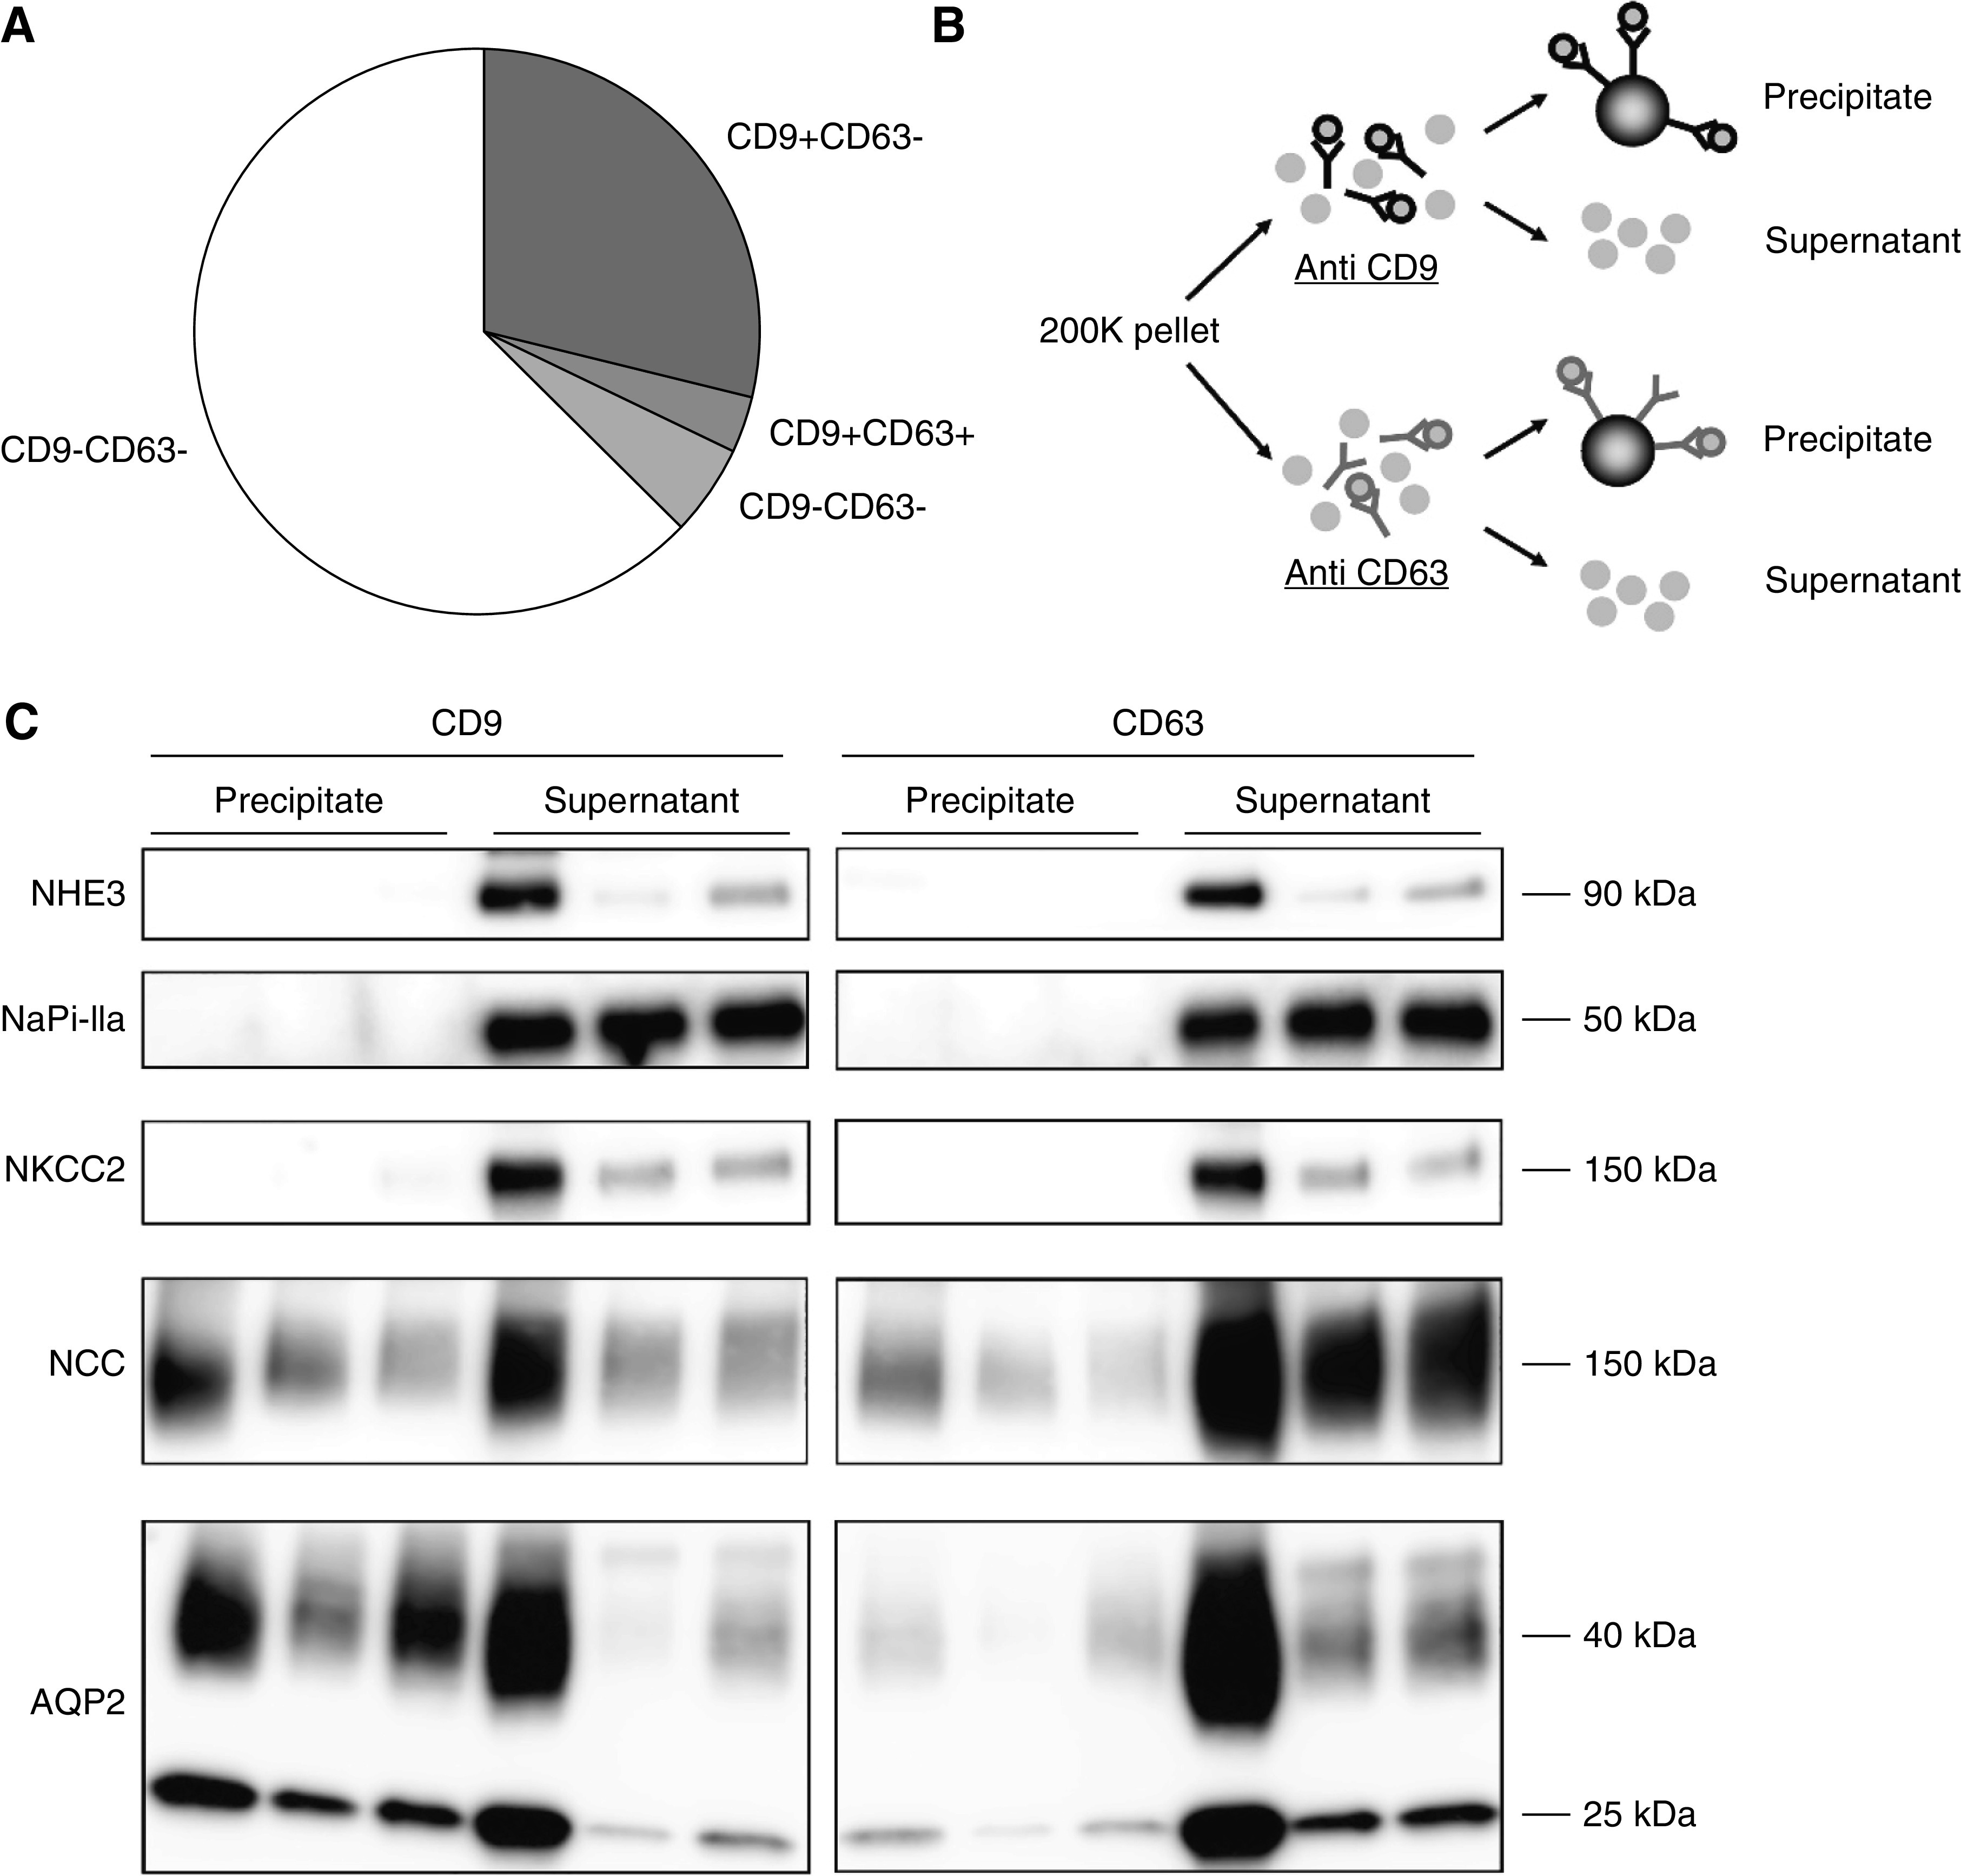
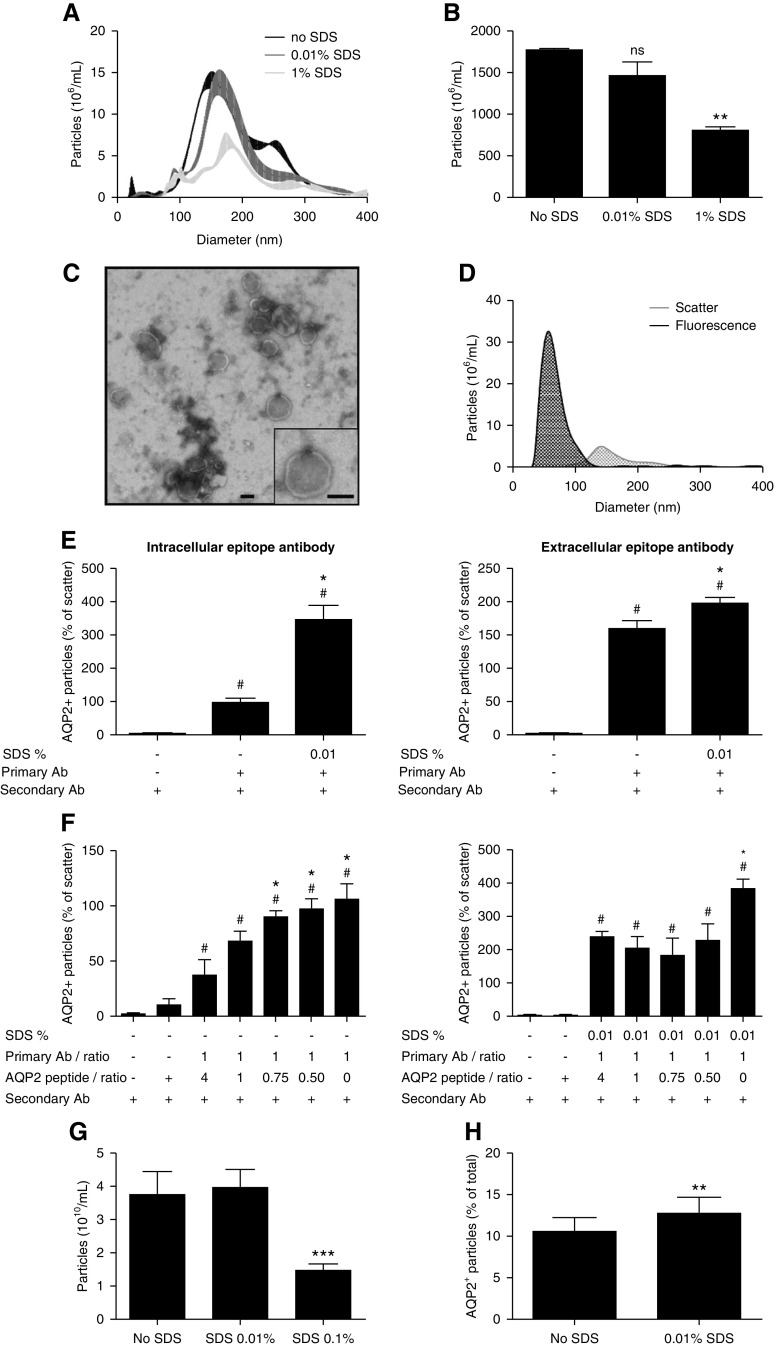
Results: Urine particle and creatinine concentrations were highly correlated in the water-loading study (R2 0.96) and in random spot urines from healthy subjects (R2 0.47-0.95) and patients (R2 0.41-0.81). Water loading reduced aquaporin-2 but increased Tamm-Horsfall protein (THP) and particle detection by NTA. This finding was attributed to hypotonicity increasing uEV size (more EVs reach the NTA size detection limit) and reducing THP polymerization. Adding THP to urine also significantly increased particle count by NTA. In both fluorescence NTA and EVQuant, adding 0.01% SDS maintained uEV integrity and increased aquaporin-2 detection. Comparison of intracellular- and extracellular-epitope antibodies suggested the presence of reverse topology uEVs. The exosome markers CD9 and CD63 colocalized and immunoprecipitated selectively with distal nephron markers. Conclusions uEV concentration is highly correlated with urine creatinine, potentially replacing the need for uEV quantification to normalize spot urines. Additional findings relevant for future uEV studies in whole urine include the interference of THP with NTA, excretion of larger uEVs in dilute urine, the ability to use detergent to increase intracellular-epitope recognition in uEVs, and CD9 or CD63 capture of nephron segment-specific EVs.

Keywords: aquaporin-2; biomarker; creatinine; exosomes; normalization; osmolality; particles; tetraspanin; urinary extracellular vesicles; uromodulin.


Figures

None
Graphical abstract
Figure 1.
Figure 1.
Correlations between urine creatinine and particle concentrations. (A) Correlation between average urine creatinine and particle concentrations per time point of the water-loading experiment as measured by NTA and EVQuant in whole urine (n=11/time point). (B) Interindividual correlations between urine creatinine and particle concentrations as measured by NTA and EVQuant. The reported R 2 is the average of individual R 2±SD. Each symbol represents a healthy subject (six samples per subject, n=66). (C) Intraindividual correlations per time point of the water-loading experiment. Each symbol represents a time point (samples per time point, n=66). (D) Correlations between urine creatinine and particle concentrations in random spot urines from healthy male and female subjects (n=15). (E) Correlations between urine creatinine and particle concentrations in random spot urines from male and female patients with polycystic kidney disease (n=26).
Figure 2.
Figure 2.
Effects of water deprivation and water loading on urine osmolality, urine creatinine, and urinary extracellular vesicle proteins. Urine flow rate (A), urine osmolality (B), urine creatinine (C), and urine particle concentration, (D) during water deprivation (T1–2) and water loading (W1–4) in 11 healthy subjects. (E) Representative immunoblots of uEV markers ALIX, TSG101, CD63, CD81, and CD9, and of THP and AQP2 loaded relative to original urine volume (50 ml of urine subjected to ultracentrifugation, pellet suspended in 180 µl, 15 µl loaded in each lane). Densitometry for all immunoblots (n=11) showed ANOVA P<0.001 with P<0.001 for post-hoc testing of W1 versus T2. (F) Urinary excretion rates of creatinine and osmoles (urine volume was recorded for n=8; formula: concentration × volume, expressed per minute). ### and ***P<0.001 versus T1 and T2, respectively; ## P<0.01 versus T1. (G) Representative immunoblot of AQP2 loaded by urine creatinine level and densitometry of the two AQP2 bands per creatinine in the 11 participants, with the average normalized to one. Repeated measures ANOVA was performed on the average of the two bands (25 and 40 kDa, # P<0.05 versus T1, *P<0.05 versus T2 in post-hoc tests).
Figure 3.
Figure 3.
Particle excretion rate and size during water deprivation (T1–2) and after water loading (W1–4). (A) uEV excretion rate by NTA in subjects undergoing the water loading protocol (urine volume was recorded for n=8) and controls (n=3). ### and *** P<0.001 versus T1 and T2 in post-hoc tests. (B) NTA-based size distribution of particles/mmol creatinine at every time point of the water loading in whole urine (per 1 nm size bin±SEM, n=8, see also Supplemental Figure 5). (C and D) Particle excretion rate as measured by EVQuant and CD9–TR-FIA in subjects undergoing the water-loading protocol (n=8) and controls (n=3). # P<0.05 versus T1 in post-hoc test.
Figure 4.
Figure 4.
Effect of THP and urinary concentration on particle count and size. (A) The addition of THP (40 µg/ml) significantly increased particle count by NTA (n=12/treatment). (B) NTA size-distribution graph with different solutions added to whole urine (n=15/treatment). (C) Particle count was significantly lower when solutions with increasing tonicity were added to whole urine (n=15/treatment). (D) Particle size was significantly higher when adding hypotonic or hypertonic solution to whole urine (n=15/treatment; *P<0.05, **P<0.01, ***P<0.001). (E) Representative image of negative staining transmission electron microscopy (TEM) of 200 K pellets from urine sample during water deprivation (T1, left panel) and directly after water loading (W1, right panel). The black bar represents 100 nm. (F) TEM size distribution of double membrane vesicles of water deprivation and water loading samples (n=4 per time-point, per 8 nm size bin±SEM). Analysis was performed by mixed linear model. (G) Polynomial model on the basis of TEM size distribution, with an arbitrary linear threshold between 35 and 65 nm representing the possible threshold of NTA. Areas under the curves were used to determine the percentage of uEVs that are missed with this threshold (per 1 nm size bin).
Figure 5.
Figure 5.
Comparison of three whole urine uEV quantification techniques. NTA, EVQuant, and CD9–TR-FIA were compared using the urine samples from the water-loading study (n=66). Correlation (A) and Bland-Altman plot (B) of particle concentrations measured by EVQuant versus NTA. Limits of agreements are not shown because of the severe skewing (P<0.001) at low concentrations. (C) Ratio of particles as measured by NTA versus EVQuant in relation to urinary creatinine and (D) osmolality, with representation of the deflection points, to determine at which urine creatinine concentration or urine osmolality skewing starts (dashed lines). (E) Correlation and (F) Bland-Altman plot of urinary particle concentrations measured by NTA versus TR-FIA. Correlation (G) and Bland-Altman plot (H) of EVQuant versus CD9–TR-FIA. In the Bland-Altman plots, limits of agreements are shown by the dotted lines. AU, arbitrary units.
Figure 6.
Figure 6.
Immunohistochemistry and immunolocalization of CD9 and CD63 in healthy human kidney, bladder, and prostate tissue. (A) Immunohistochemistry of CD9 and CD63 (both brown). (B) Immunofluorescence of normal human kidney, prostate and bladder tissue, to determine colocalization of CD9 and CD63. The following markers were used for nephron segments, including villin for proximal tubule, NKCC2 for the thick ascending limb, parvalbumin for the distal convoluted tubule, and AQP2 for the collecting duct. Blue: nuclear staining with DAPI.
Figure 7.
Figure 7.
Characterization of CD9+ and CD63+ particles. (A) Pie chart showing CD9+ and CD63+ distribution of particles as measured by EVQuant in second void morning spot urines (n=6). (B) The 200 K pellet was divided and subjected to either anti-CD9 or anti-CD63 antibodies. The magnetic beads were added to separate antibody-bound (precipitate) from nonbound particles (supernatant). (C) Immunoblots of NHE3 and NaPi-IIa (proximal tubule marker), NKCC2 (thick ascending limb marker), NCC (distal convoluted tubule marker), and AQP2 (collecting duct marker) in particles precipitated from 200 K pellets (n=3 subjects) by either CD9- or CD63-antibody coated magnetic beads. See also Supplemental Figure 8 for the three additional subjects.
Figure 8.
Figure 8.
Use of detergent to enhance intracellular epitope recognition. (A) NTA size distribution graph of whole urine samples without SDS and treated by 0.01% v/v or 1% v/v SDS (n=3/treatment). (B) NTA particle counts without SDS, with 0.01% v/v or 1% v/v SDS (n=3/treatment, **P<0.01 versus no SDS). (C) Representative TEM image of 0.01% v/v SDS-treated 200 K pellets. The bar represents 100 nm. (D) Fluorescence NTA-based representative size distribution of uEVs treated with 0.01% v/v SDS versus controls using a NanoSight NS300 in fluorescence mode (AQP2–488) and in scatter mode. (E) Use of intracellular-epitope and extracellular-epitope AQP2 antibodies to determine the percentage of AQP2+ particles (relative to particle count in scatter mode) without SDS and with 0.01% v/v SDS (n=3–7/treatment). See Supplemental Figure 11 for characteristics of the extracellular-epitope AQP2 antibody. To determine the background noise, urine samples were also treated with only secondary antibody (n=3–6). # P<0.05 versus secondary antibody only, *P<0.05 versus primary and secondary antibody without SDS. (F) AQP2 antibody and anti-AQP2 peptide inhibition experiment in the absence of SDS (left panel: intracellular-epitope antibody, right panel: extracellular-epitope antibody, n=3–4/treatment, * and # P<0.05 versus 1:4 ratio and anti-AQP2 peptide + secondary antibody, respectively). (H) extracellular-epitope AQP2 antibody and anti-AQP2 peptide inhibition experiment in the presence of 0.01% v/v SDS (n=3–4/treatment, * and # P<0.05 versus 1:4 ratio and anti-AQP2 peptide + secondary antibody, respectively). (G) Particle counts by EVQuant of urine samples without SDS, with 0.01% SDS or 0.1% SDS (n=15/treatment, ***P<0.001 versus no SDS). (H) Percentage of EVQuant-detected particles that colocalized with AQP2-Alexa488 nm in urine samples without SDS versus 0.01% SDS (n=15/treatment, **P<0.01).

Comment in

References

    1. Salih M, Zietse R, Hoorn EJ: Urinary extracellular vesicles and the kidney: Biomarkers and beyond. Am J Physiol Renal Physiol 306: F1251–F1259, 2014. - PubMed
    1. Pisitkun T, Shen RF, Knepper MA: Identification and proteomic profiling of exosomes in human urine. Proc Natl Acad Sci U S A 101: 13368–13373, 2004. - PMC - PubMed
    1. Zhou H, Pisitkun T, Aponte A, Yuen PS, Hoffert JD, Yasuda H, et al. .: Exosomal fetuin-A identified by proteomics: A novel urinary biomarker for detecting acute kidney injury. Kidney Int 70: 1847–1857, 2006. - PMC - PubMed
    1. Panich T, Chancharoenthana W, Somparn P, Issara-Amphorn J, Hirankarn N, Leelahavanichkul A: Urinary exosomal activating transcriptional factor 3 as the early diagnostic biomarker for sepsis-induced acute kidney injury. BMC Nephrol 18: 10, 2017. - PMC - PubMed
    1. Salih M, Demmers JA, Bezstarosti K, Leonhard WN, Losekoot M, van Kooten C, et al. .; DIPAK Consortium: Proteomics of urinary vesicles links plakins and complement to polycystic kidney disease. J Am Soc Nephrol 27: 3079–3092, 2016. - PMC - PubMed

Publication types