. 2021 Mar 29;12(1):1936.
doi: 10.1038/s41467-021-21953-3.

The SARS-CoV-2 nucleocapsid protein is dynamic, disordered, and phase separates with RNA

Affiliations

The SARS-CoV-2 nucleocapsid protein is dynamic, disordered, and phase separates with RNA

Jasmine Cubuk et al. Nat Commun. .

Abstract

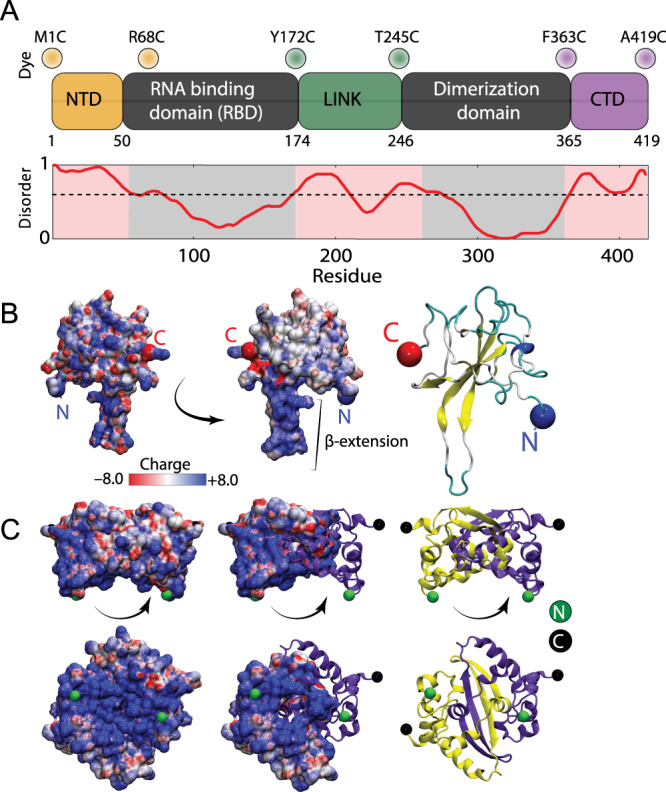
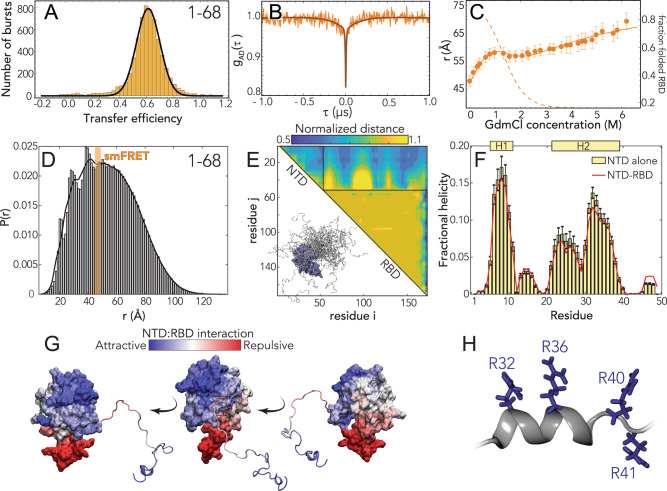
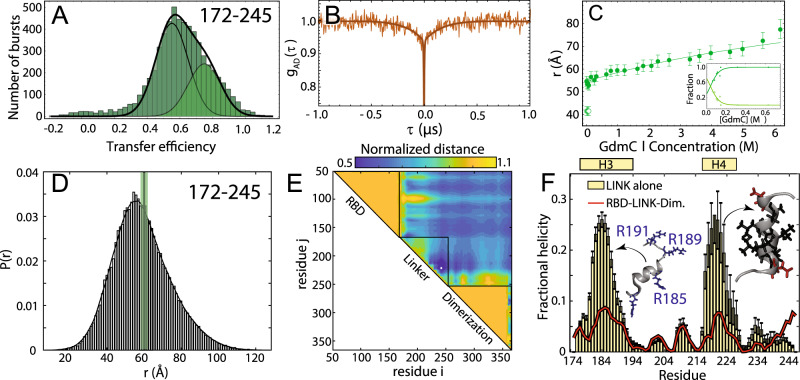
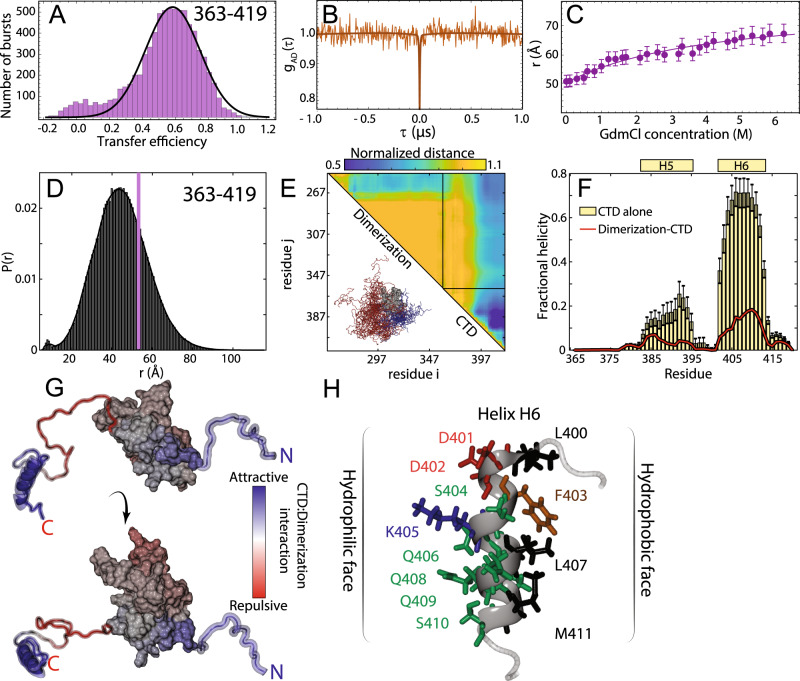
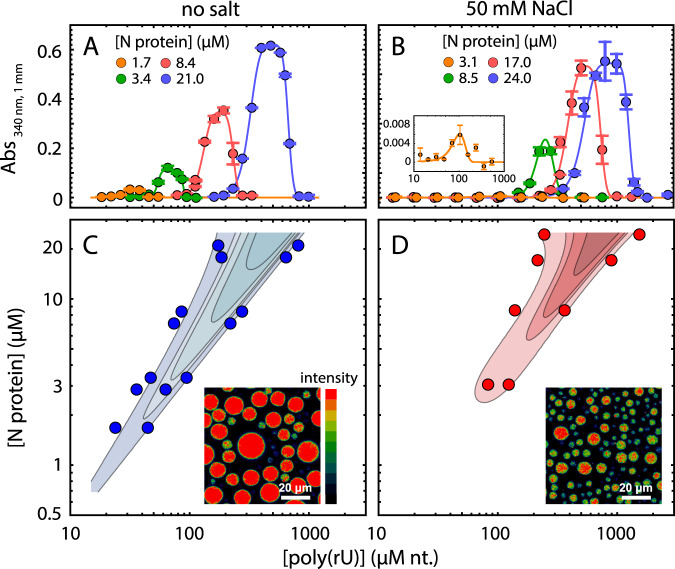
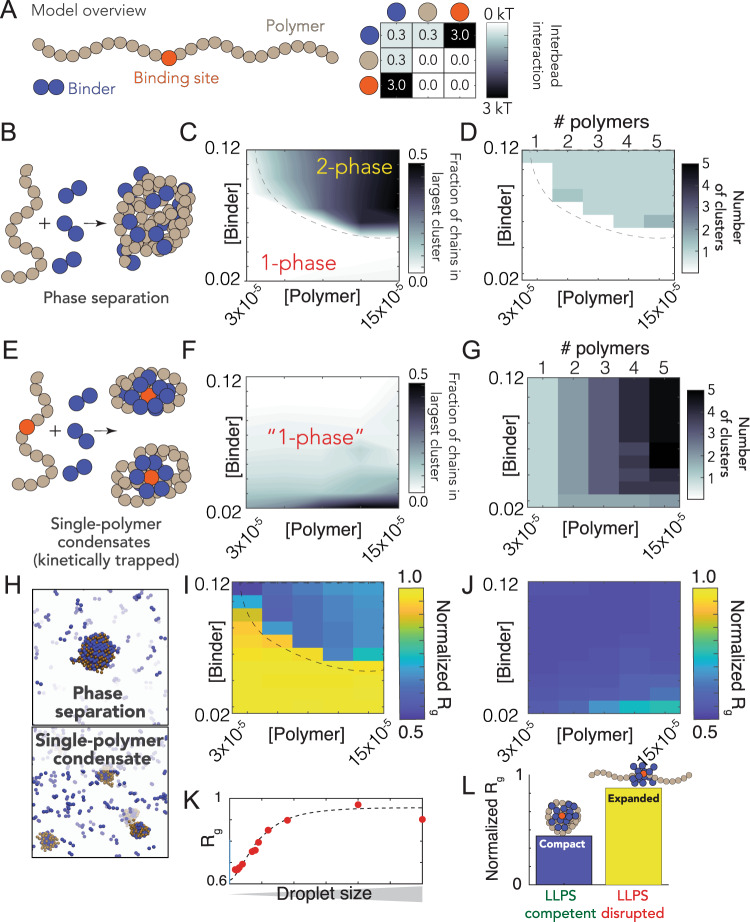
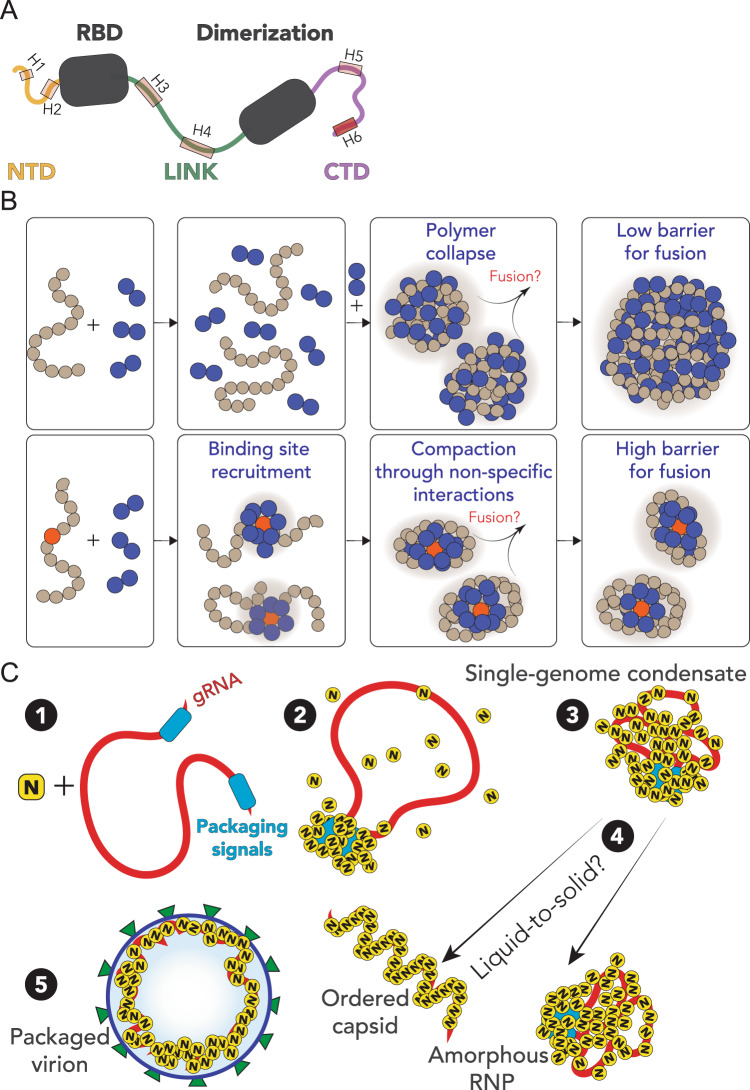
The SARS-CoV-2 nucleocapsid (N) protein is an abundant RNA-binding protein critical for viral genome packaging, yet the molecular details that underlie this process are poorly understood. Here we combine single-molecule spectroscopy with all-atom simulations to uncover the molecular details that contribute to N protein function. N protein contains three dynamic disordered regions that house putative transiently-helical binding motifs. The two folded domains interact minimally such that full-length N protein is a flexible and multivalent RNA-binding protein. N protein also undergoes liquid-liquid phase separation when mixed with RNA, and polymer theory predicts that the same multivalent interactions that drive phase separation also engender RNA compaction. We offer a simple symmetry-breaking model that provides a plausible route through which single-genome condensation preferentially occurs over phase separation, suggesting that phase separation offers a convenient macroscopic readout of a key nanoscopic interaction.


Conflict of interest statement

A.S.H. is a scientific consultant with Dewpoint Therapeutics. This affiliation in no way influenced the content of this study. All other authors declare no competing interests.

Figures

Fig. 1
Fig. 1. Sequence and structural summary of N protein.
A Domain architecture of the SARS-CoV-2 N protein with disorder prediction performed using IUPred2A. Dye positions used in this study are annotated across the top, disorder prediction calculated across the bottom. The specific positions were selected such that fluorophores are sufficiently close to be in the dynamic range of FRET measurements. Labeling was achieved using cysteine mutations and thiol-maleimide chemistry. B Structure of the SARS-CoV-2 RNA-binding domain (RBD) (PDB: 6yi3). Center and left: colored based on surface potential calculated with the Adaptive Poisson Boltzmann Method, revealing the highly basic surface of the RBD. Right: ribbon structure with N- and C-termini highlighted. C Dimer structure of the SARS-CoV-2 dimerization domain (PDB: 6yun). Center and left: colored based on surface potential, revealing the highly basic surface. Right: ribbon structure with N- and C-termini highlighted.
Fig. 2
Fig. 2. The N-terminal domain (NTD-FL) is disordered with residual helical motifs.
A Histogram of the transfer efficiency distribution measured across the labeling positions 1 and 68 in the context of the full-length protein, under aqueous buffer conditions (50 mM Tris buffer). B Donor–acceptor cross-correlation measured by ns-FCS (see SI). The observed anticorrelated rise is the characteristic signature of FRET dynamics and the timescale associated is directly related to the reconfiguration time of the probed segment. C Root-mean-square interdye distance as extracted from single-molecule FRET experiments across different denaturant concentrations using a Gaussian chain distribution, examining residues 1–68 in the context of the full-length protein. The full line represents a fit to the model in Eq. (S7), which accounts for denaturant binding (see Table S2) and unfolding of the folded RBD. The dashed line represents the estimated fraction of folded RBD across different denaturant concentrations based on Eq. (S8). Error bars represent propagation ±0.03 systematic error in measured transfer efficiencies (see SI). D All-atom simulations of the NTD in the context of RBD reveal good agreement with smFRET-derived average distances. The peaks on the left shoulder of the histogram are due to persistent NTD–RBD interactions in a small subset of simulations. E Normalized distance maps (scaling maps) quantify heterogeneous interaction between every pair of residues in terms of average inter-residue distance normalized by distance expected for the same system if the IDR had no attractive interactions (the excluded volume limit). Both repulsive (yellow) and attractive (blue) regions are observed for NTD–RBD interactions. F Transient helicity (residues 5–11 and 21–39) in the NTD in isolation or in the context of the RBD. Perfect profile overlap suggests interaction between the NTD and the RBD does not lead to a loss of helicity. Error bars are standard error of the mean calculated from forty independent simulations. G Projection of normalized distances onto the folded domain reveals repulsion is through electrostatic interaction (positively charged NTD is repelled by the positive face of the RBD, which is proposed to engage in RNA binding) while attractive interactions are between positive, aromatic, and polar residues in the NTD and a slightly negative and hydrophobic surface on the RBD (see Fig. 1B, center). H The C-terminal half of the transient helix H2 encodes an arginine-rich surface.
Fig. 3
Fig. 3. The RNA-binding domain (RBD) and dimerization domains are interconnected by a flexible disordered linker (LINK).
A Histogram of the transfer efficiency distribution measured across the labeling positions 172 and 245 in the context of the full-length protein, under aqueous buffer conditions. B Donor–acceptor cross-correlation measured by ns-FCS (see SI). The observed anticorrelated rise is the characteristic signature of FRET dynamics and the timescale associated is directly related to the reconfiguration time of the probed segment. C Interdye distance as extracted from single-molecule FRET experiments across different denaturant concentrations. The full line represents a fit to the model in Eq. (S6), which accounts for denaturant binding. The inset provides an estimate of the fraction of each population in the low GdmCl concentration regime. Error bars are the propagation of ±0.03 systematic error in measured transfer efficiencies (see SI). D Inter-residue distance distributions calculated from simulations (histogram) show good agreement with distances inferred from single-molecule FRET measurements (green bar). E Scaling maps reveal repulsive interactions between the N- and C-terminal regions of the LINK with the adjacent folded domains. We also observe relatively extensive intra-LINK interactions around helix H4 (see F). F Two transient helices are observed in the linker (residues 177–194 and 216–227). The N-terminal helix H3 overlaps with part of the SR region and orientates three arginine residues in the same direction, analogous to behavior observed for H2 in the NTD. The C-terminal helix H4 overlaps with a Leu/Ala-rich motif and may be a conserved nuclear export signal (see “Discussion”). Error bars are standard errors of the mean calculated from 30 independent simulations.
Fig. 4
Fig. 4. The C-terminal domain (CTD) is disordered, engages in transient interaction with the dimerization domain, and contains a putative helical-binding motif.
A Histogram of the transfer efficiency distribution measured across the labeling positions 363 and 419 in the context of the full-length protein, under aqueous buffer conditions. B Donor–acceptor cross-correlation measured by ns-FCS (see SI). The flat correlation indicates a lack of dynamics in the studied timescale or the coexistence of two populations in equilibrium whose correlations (one correlated and the other anticorrelated) compensate each other. C Interdye distance as extracted from single-molecule FRET experiments across different denaturant concentrations. The full line represents a fit to the model in Eq. (S6), which accounts for denaturant binding. Error bars are the propagation of ±0.03 systematic error in measured transfer efficiencies (see SI). D Inter-residue distance distributions calculated from simulations (histogram) show good agreement with distances inferred from single-molecule FRET measurements (purple bar). E Scaling maps describe the average inter-residue distance between each pair of residues, normalized by the distance expected if the CTD behaved as a self-avoiding random coil. H6 engages in extensive intra-CTD interactions and also interacts with the dimerization domain. We observe repulsion between the dimerization domain and the N-terminal region of the CTD. F Two transient helices (H5 and H6) are observed in the CTD (residues 383–396 and 402–415). Both show a reduction in population in the presence of the dimerization domain at least in part because the same sets of residues engage in transient interactions with the dimerization domain. Error bars are standard error of the mean calculated from forty independent simulations. G The normalized distances are projected onto the surface to map CTD-dimerization interaction. The helical region drives intramolecular interaction, predominantly with the N-terminal side of the dimerization domain. H Helix H6 is an amphipathic helix with a polar/charged surface (left) and a hydrophobic surface (right).
Fig. 5
Fig. 5. Nucleocapsid protein undergoes phase separation with RNA.
A, B Appearance of solution turbidity upon mixing was monitored to determine the concentration regime in which N protein and poly(rU) undergo phase separation. Representative turbidity titrations with poly(rU) in 50 mM Tris, pH 7.5 (HCl) at room temperature, in the absence of added salt (A) and in the presence of 50 mM NaCl (B), at the indicated concentrations of N protein. Points and error bars represent the mean and standard deviation of 2 (absorbance < 0.005) and 4 (absorbance ⩾ 0.005) consecutive measurements from the same sample. Solid lines are simulations of an empirical equation fitted individually to each titration curve (see SI). An inset is provided for the titration at 3.1 μM N protein in 50 mM NaCl to show the small yet detectable change in turbidity on a different scale. C, D Projection of phase boundaries for poly(rU) and N protein mixtures highlights a re-entrant behavior, as expected for phase separations induced by heterotypic interactions. Turbidity contour lines are computed from a global fit of all titration curves (see SI). Insets: confocal fluorescence images of droplets doped with fluorescently labeled N protein. Total concentrations are 22 μM N protein, 0.5 nM labeled N protein, and 0.54 mM nt. poly(rU). At a higher salt concentration, a lower concentration of protein in the droplet is detected.
Fig. 6
Fig. 6. A simple polymer suggests symmetry breaking can promote single-polymer condensates over multi-polymer assemblies.
A Summary of our model setup, which involves long polymers (61 beads per molecules) or short binders (2 beads per molecules). Each bead is multivalent and can interact with every adjacent lattice site. The interaction matrix to the right defines the pairwise interaction energies associated with each of the bead types. B Concentration-dependent assembly behavior for polymers lacking a high-affinity binding site. Schematic showing polymer architecture (brown) with binder (blue). C Phase diagram showing the concentration-dependent phase regime—dashed line represents the binodal (phase boundary) and is provided to guide the eye. D Analysis in the same 2D space as panel C, assessing the number of droplets at a given concentration. When phase separation occurs, a single droplet appears in almost all cases. E Concentration-dependent assembly behavior for polymers with a high-affinity binding site (red bead). F No large droplets are formed in any of the systems, although multiple polymer:binder complexes form. G The number of clusters observed matches the number of polymers in the system—i.e., each polymer forms an individual cluster. H Simulation snapshots from equivalent simulations for polymers with (top) or without (bottom) a single high-affinity binding site. I Polymer dimensions in the dense and dilute phase (for the parameters in our model) for polymers with no high-affinity binding site. Note that compaction in the dense phase reflects finite-size effects, as addressed in panel K, and is an artifact of the relatively small droplets formed in our systems (relative to the size of the polymer). The droplets act as a bounding cage for the polymer, driving their compaction indirectly. J Polymer dimensions across the same concentration space for polymers with a single high-affinity binding site. Across all concentrations, each individual polymer is highly compact. K Compaction in the dense phase (panel I) is due to small droplets. When droplets are sufficiently large, we observe chain expansion, as expected from standard theoretical descriptions. L Simulations performed under conditions in which nonspecific interactions between binder and polymer are reduced (interaction strength = 0 kT). Under these conditions phase separation is suppressed. Equivalent simulations for polymers with a high-affinity site reveal these chains are no longer compact. As such, phase separation offers a readout that—in our model—maps to single-polymer compaction.
Fig. 7
Fig. 7. Summary and proposed model.
A Summary of results from single-molecule spectroscopy experiments and all-atom simulations. All three predicted IDRs are disordered, highly flexible, and house a number of putative helical-binding regions which overlap with subregions identified previously to drive N protein function. B Overview of general symmetry-breaking model. For homopolymers, local collapse leads to single-polymer condensates with a small barrier to fusion, rapidly assembling into large multi-polymer condensates. When one (or a small number of) high-affinity sites are present, local clustering of binders at a lower concentration organize the polymer such that single-polymer condensates are kinetically stable. C Proposed model for SARS-CoV-2 genome packaging. (1) Simplified model of SARS-CoV-2 genome with a pair of packaging region at the 5′ and 3′ end of the genome. (2) N protein preferentially binds to packaging signal regions in the genome, leading to a local cluster of N protein at the packaging signal RNA. (3) The high local concentration of N protein drives condensation of distal regions of the genome, forming a stable single-genome condensate. (4) Single-genome condensates may undergo subsequent maturation through a liquid-to-solid (crystallization) transition to form an ordered crystalline capsid, or solidify into an amorphous ribonuclear particle (RNP), or some combination of the two. While in some viruses an ordered capsid clearly forms, we favor a model in which the SARS-CoV-2 capsid is an amorphous RNP. Compact single-genome condensates ultimately interact with E, S, and M proteins at the membrane, whose concerted action leads to envelope formation around the viral RNA and final virion packaging.

Update of

References

    1. Zhu N, et al. A novel coronavirus from patients with pneumonia in China, 2019. N. Engl. J. Med. 2020;382:727–733. doi: 10.1056/NEJMoa2001017. - DOI - PMC - PubMed
    1. Corman, V. M., Muth, D., Niemeyer, D. & Drosten, C. In Advances in Virus Research (eds. Kielian, M. et al.) Ch. 8, Vol. 100 163–188 (Academic Press, 2018). - PMC - PubMed
    1. Roser, M., Ritchie, H., Ortiz-Ospina, E. & Hasell, J. Coronavirus Pandemic (COVID-19). Our World in Data (2020).
    1. Lurie N, Saville M, Hatchett R, Halton J. Developing Covid-19 vaccines at pandemic speed. N. Engl. J. Med. 2020;382:1969–1973. doi: 10.1056/NEJMp2005630. - DOI - PubMed
    1. Gordon, D. E. et al. A SARS-CoV-2 protein interaction map reveals targets for drug repurposing. Nature10.1038/s41586-020-2286-9 (2020). - PMC - PubMed

Publication types

Substances