. 2021 Mar 29;12(1):1942.
doi: 10.1038/s41467-021-22213-0.

Implications of the school-household network structure on SARS-CoV-2 transmission under school reopening strategies in England

Collaborators, Affiliations

Implications of the school-household network structure on SARS-CoV-2 transmission under school reopening strategies in England

James D Munday et al. Nat Commun. .

Abstract

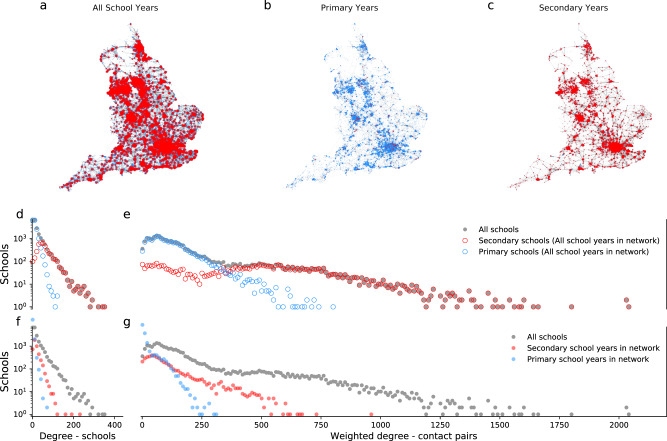
In early 2020 many countries closed schools to mitigate the spread of SARS-CoV-2. Since then, governments have sought to relax the closures, engendering a need to understand associated risks. Using address records, we construct a network of schools in England connected through pupils who share households. We evaluate the risk of transmission between schools under different reopening scenarios. We show that whilst reopening select year-groups causes low risk of large-scale transmission, reopening secondary schools could result in outbreaks affecting up to 2.5 million households if unmitigated, highlighting the importance of careful monitoring and within-school infection control to avoid further school closures or other restrictions.


Conflict of interest statement

A.E. received a research grant from Taisho Pharmaceutical Co., Ltd. All other authors declare no competing interests.

Figures

Fig. 1
Fig. 1. School contact networks.
Networks of contact through households between 21,608 state-funded schools in England plotted by location. a Network with all school years in attendance. b Network with only primary school years in attendance. c Network with only secondary school years in attendance. Nodes show schools with size determined by the weighted degree of the node (number of unique contact pairs with any other school). Edge widths that indicate the number of unique contact pairs between the schools the edge connects. Red nodes show secondary schools (mean age ≥11 years), blue nodes show primary schools (mean age <11 years). Followed by degree distributions of the networks of contact through households. d A histogram of the number of schools connected by at least one contact pair and e a histogram of the number of unique contact pairs with all other schools in the network including all school years (i.e. that shown in panel a). for all schools (grey) dots, secondary schools (mean age ≥11 years, red circles), and primary schools (mean age <11 years, blue, circles). f A histogram of the number of schools connected by at least one contact pair and g a histogram of the number of unique contact pairs with all other schools in the network including all school years (grey), the network including only secondary school years (blue) and the network including only primary school years (red).
Fig. 2
Fig. 2. Breakdown of school years in England and reopening scenarios evaluated.
Circles represent school years and each row shows a different reopening scenario. Circles are coloured green to indicate inclusion in each scenario. Circles outlined in orange represent a transition year, circles outlined in yellow represent an exam year.
Fig. 3
Fig. 3. The expected number of schools infected by each school.
Weighted degree distribution of the transmission probability network for each of the reopening scenarios considered for R values of 1.1–1.5. Panels af show reopening scenarios 1–6, respectively, and panel g shows the network with all school years in attendance. Vertical lines show the mean degree for each value of R.
Fig. 4
Fig. 4. Largest components of the binary outbreak networks.
The number of households with children attending a school in each largest connected component of the binary transmission networks (estimated potential outbreak cluster size) generated from transmission probability networks for school reopening scenarios. The points show the median and error bars show the 90% credible intervals for 1000 realisations of binary outbreak networks. The green dashed line shows the total number of households in the school system (4,927,163 households).
Fig. 5
Fig. 5. Connected component distributions.
The distribution of component sizes of the binary outbreak networks generated for school reopening scenarios and R values of 1.1–1.5 (indicated by colour). By households, i.e. the number of households in a component size in each bin, panels af show reopening scenarios 1–6, respectively, and panel g shows the network with all school years in attendance. By school, i.e. the number of schools in a component size in each bin, panels hm show reopening scenarios 1–6, respectively, and panel n shows the network with all school years in attendance. The bars show the median and error bars show 90% credible intervals for 1000 realisations of binary outbreak networks.
Fig. 6
Fig. 6. Schematic to demonstrate the principle of a network of schools linked by households.
a A network of schools constructed such that schools are connected when contact is made between pupils of different schools within a household. b The strength of contact between schools is quantified by calculating the number of unique contact pairs (one child in each school). The number of pairs per household is the product of the number of children who attend school i and the number of children who attend school j. The total number of unique pairs is the sum of unique pairs over all, N, households, k, with children attending both school i and j.
Fig. 7
Fig. 7. How contact, transmission and binary outbreak networks relate to each other.
a A schematic of a contact network, the width of the edges shows the number of unique contact pairs between schools. b A schematic of a transmission probability network calculated from the contact network; the shading of the edges shows the relative probability of transmission between schools. c A schematic of a realisation of a binary outbreak network, where edges are weighted 1 with probability given by the equivalent edge in the transmission network—indicating transmission between schools, or 0 otherwise. Blue highlighted nodes show those in the largest connected component.

References

    1. Wu JT, et al. School closure and mitigation of pandemic (H1N1) 2009, Hong Kong. Emerging Infect. Dis. 2010;16:538–541. doi: 10.3201/eid1603.091216. - DOI - PMC - PubMed
    1. Cauchemez S, Valleron A-J, Boëlle P-Y, Flahault A, Ferguson NM. Estimating the impact of school closure on influenza transmission from Sentinel data. Nature. 2008;452:750–754. doi: 10.1038/nature06732. - DOI - PubMed
    1. Brooks SK, et al. The impact of unplanned school closure on children’s social contact: rapid evidence review. Eurosurveillance. 2020;25:2000188. - PMC - PubMed
    1. Sadique MZ, Adams EJ, Edmunds WJ. Estimating the costs of school closure for mitigating an influenza pandemic. BMC Public Health. 2008;8:135. doi: 10.1186/1471-2458-8-135. - DOI - PMC - PubMed
    1. Berkman BE. Mitigating pandemic influenza: the ethics of implementing a school closure policy. J. Public Health Manag. Pract. 2008;14:372–378. doi: 10.1097/01.PHH.0000324566.72533.0b. - DOI - PubMed

Publication types