. 2021 Mar 29;11(1):7052.
doi: 10.1038/s41598-021-86002-x.

Comprehensive transcriptomic analysis of COVID-19 blood, lung, and airway

Affiliations

Comprehensive transcriptomic analysis of COVID-19 blood, lung, and airway

Andrea R Daamen et al. Sci Rep. .

Abstract

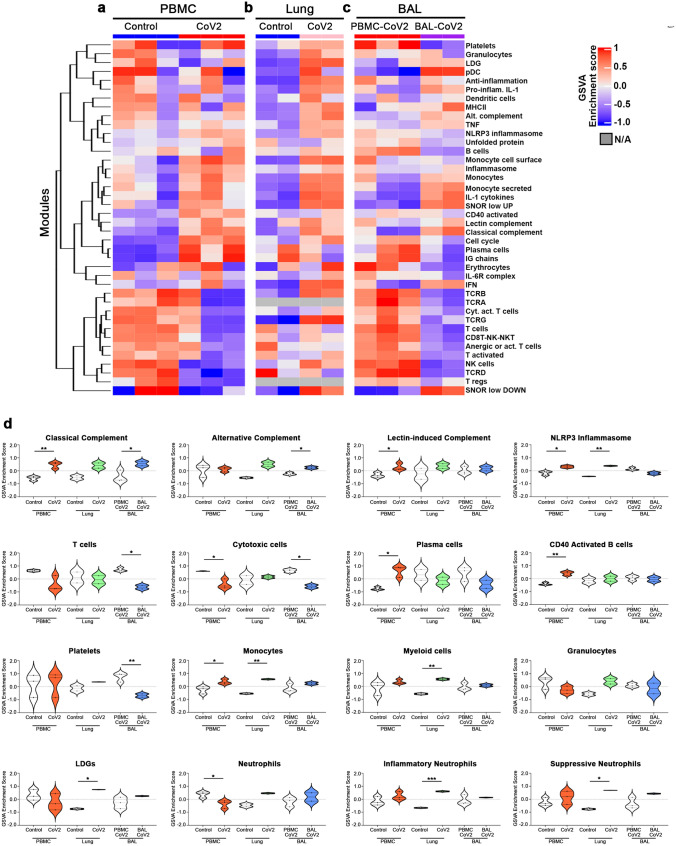
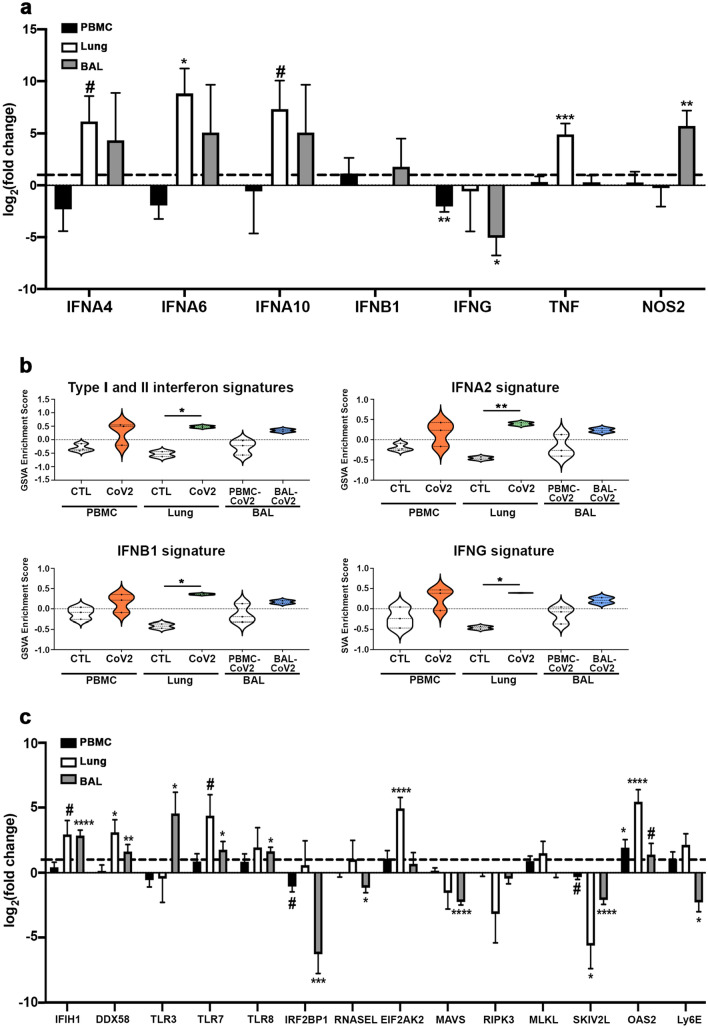
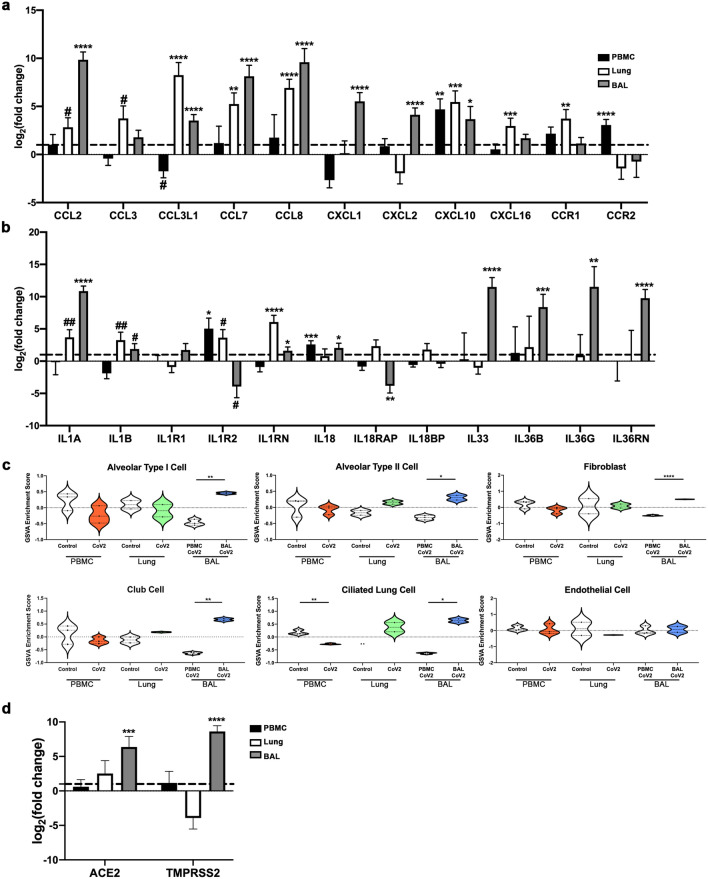
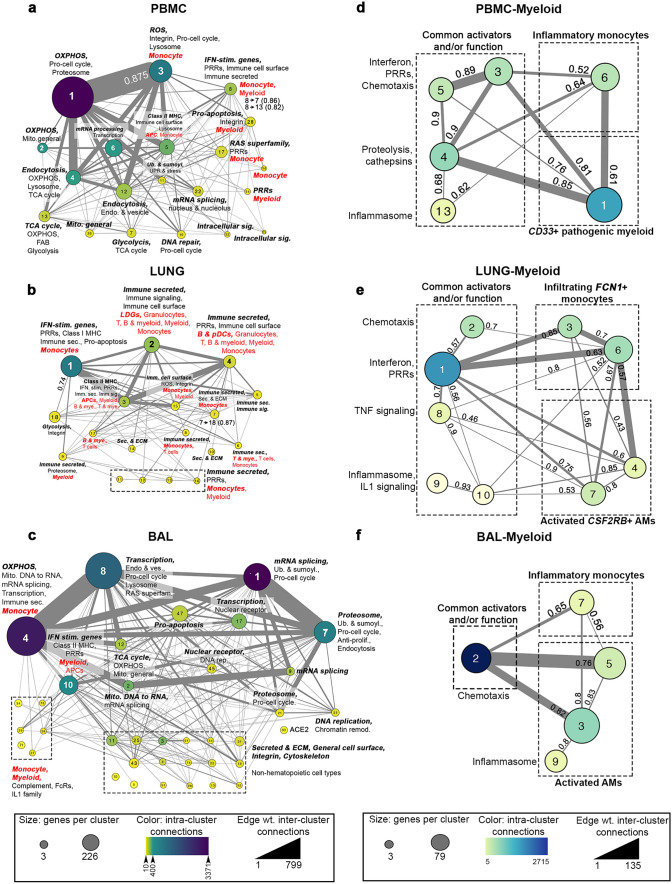
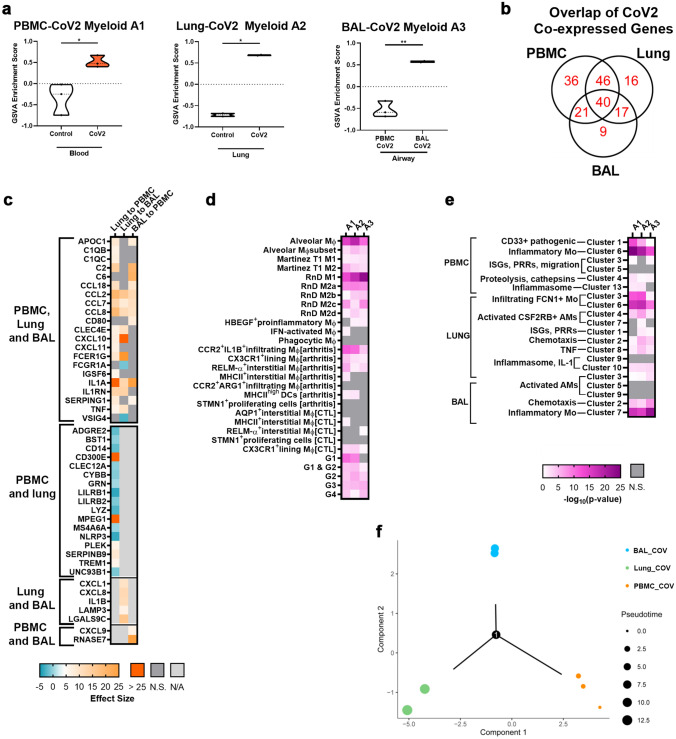
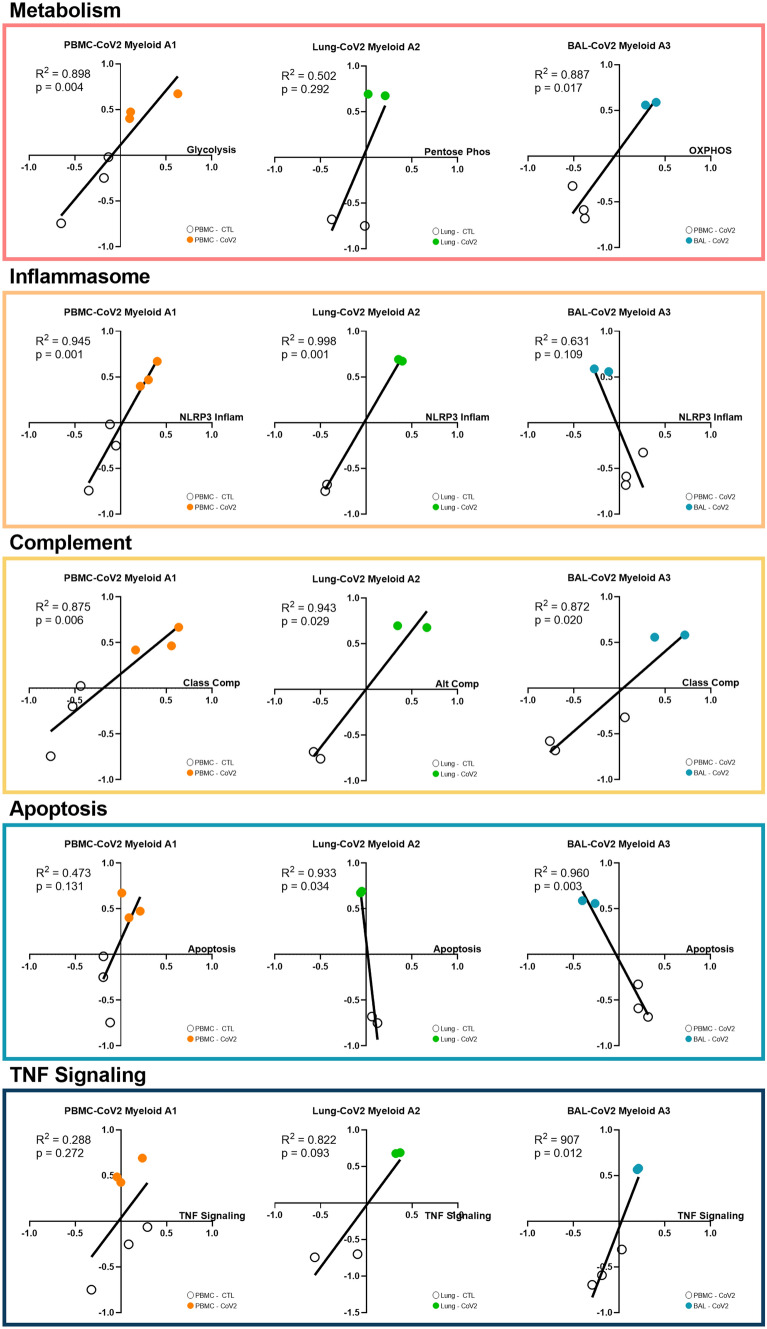
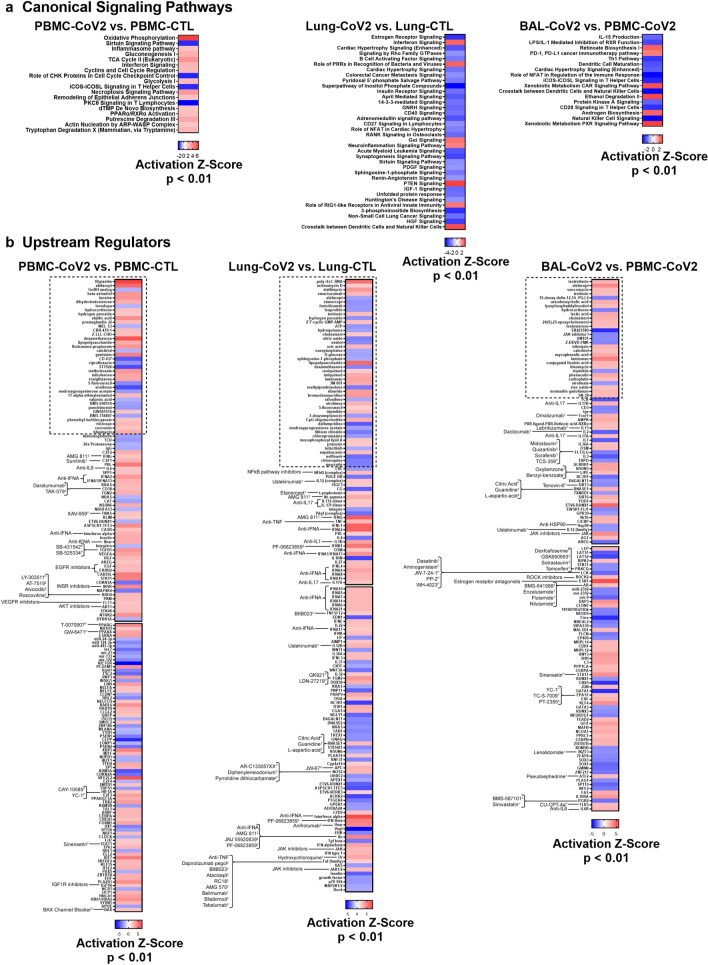
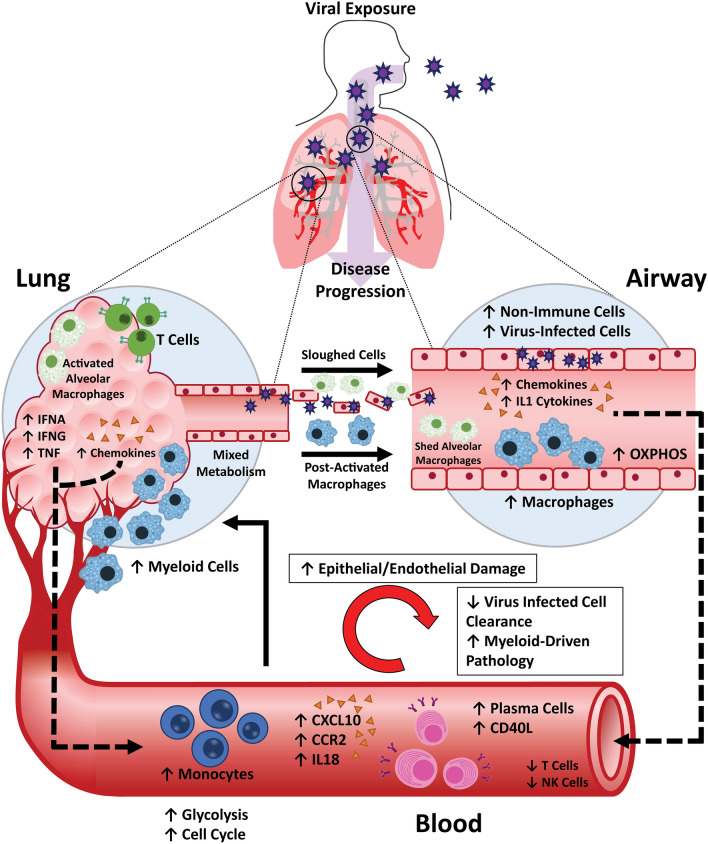
SARS-CoV2 is a previously uncharacterized coronavirus and causative agent of the COVID-19 pandemic. The host response to SARS-CoV2 has not yet been fully delineated, hampering a precise approach to therapy. To address this, we carried out a comprehensive analysis of gene expression data from the blood, lung, and airway of COVID-19 patients. Our results indicate that COVID-19 pathogenesis is driven by populations of myeloid-lineage cells with highly inflammatory but distinct transcriptional signatures in each compartment. The relative absence of cytotoxic cells in the lung suggests a model in which delayed clearance of the virus may permit exaggerated myeloid cell activation that contributes to disease pathogenesis by the production of inflammatory mediators. The gene expression profiles also identify potential therapeutic targets that could be modified with available drugs. The data suggest that transcriptomic profiling can provide an understanding of the pathogenesis of COVID-19 in individual patients.


Conflict of interest statement

The authors declare no competing interests.

Figures

Figure 1
Figure 1
Conserved and differential enrichment of immune cells and pathways in blood, lung, and airway of SARS-CoV2-infected patients. (a-d) Individual sample gene expression from the blood (a), lung (b), and airway (c) was analyzed by GSVA for enrichment of immune cell and inflammatory pathways. The corresponding heatmap was generated using the R Bioconductor package complexHeatmap (v2.5.6). Select enrichment scores are shown as violin plots in (d) generated using GraphPad Prism v8.4.2 (www.graphpad.com). *p < 0.05, **p < 0.01.
Figure 2
Figure 2
Elevated IFN expression in the lung tissue of COVID-19 patients. (a) Normalized log2 fold change RNA-seq expression values for IFN-associated genes from blood, lung, and airway of individual COVID-19 patients. The dotted line represents the expression of each gene in healthy individuals (for blood and lung) or PBMCs from COVID-19 patients (airway). (b) Individual sample gene expression from the blood, lung, and airway was analyzed by GSVA for enrichment of IFN-related gene signatures. (c) Normalized log2 fold change RNA-seq expression values for anti-viral genes as in (a). Generated using GraphPad Prism v8.4.2 (www.graphpad.com). # p < 0.2, ## p < 0.1, *p < 0.05, **p < 0.01, ***p < 0.001, ****p < 0.0001.
Figure 3
Figure 3
Viral entry gene expression correlates with enhanced expression of inflammatory mediators in SARS-CoV2-infected lungs. (a,b) Normalized log2 fold change RNA-seq expression values for chemokines and chemokine receptors (a) and IL-1 family members (b) from blood, lung, and airway of COVID-19 patients as in Fig. 2a. (c) Individual sample gene expression from the blood, lung, and airway was analyzed by GSVA for enrichment of various lung tissue cell categories. (d) Normalized log2 fold change RNA-seq expression values for viral entry genes as in (a,b). Generated using GraphPad Prism v8.4.2 (www.graphpad.com). #p < 0.2, ##p < 0.1, *p < 0.05, **p < 0.01, ***p < 0.001, ****p < 0.0001.
Figure 4
Figure 4
PPI analysis identifies different myeloid cell subsets and metabolic pathways in blood, lung, and airway of COVID-19 patients. DE upregulated genes from blood (a), lung (b) and airway (c) were used to create PPI metaclusters using Cytoscape (v3.6.1) and the clusterMaker2 (v1.2.1) plugin. Size indicates the number of genes per cluster, color indicates the number of intra-cluster connections and edge weight indicates the number of inter-cluster connections. Enrichment for biological function and immune cell type was determined by BIG-C and I-Scope, respectively. Small clusters (~ 14 genes) with similar function are grouped in dotted-line boxes. Clusters enriched in Mo/myeloid genes were combined by decreasing cluster stringency to create a new set of myeloid-derived metastructures from the blood (d), lung (e) and airway (f). Interaction scores showing the strength of interaction between clusters are indicated (0.4–0.6, medium interaction; 0.61–0.8, strong interaction; 0.81–0.99, very strong interaction).
Figure 5
Figure 5
Different co-expression-derived myeloid populations are found in blood, lung, and airway of COVID-19 patients. (a) GSVA enrichment of myeloid subpopulations increased in COVID-19 blood (A1), lung (A2), and airway (A3). (b) Venn Diagram of the gene overlap between myeloid subpopulations A1–A3. (c) Comparison of normalized log2 fold change expression values of genes defining A1–A3. Expression values for each sample in each comparison were normalized by the mean of the log2 fold change expression of FCGR1A, FCGR2A, and FCGR2C. Significant comparisons are displayed by Hedge’s G effect size. (d,e) Characterization of A1–A3 by enrichment of previously described myeloid populations (d) (Supplementary Table 3,6) and PBMC, lung, and BAL myeloid metaclusters from Fig. 4d-f (e). Fisher’s Exact Test was used to calculate overlap between transcriptomic signatures and significant overlaps (p < 0.05) are shown as the negative logarithm of the p value. (f) Trajectory analysis using expression of 621 genes (196 myeloid-specific genes used in a,b + 425 additional myeloid genes shown in Supplementary Table 5) in the blood, lung, and airway compartments. Colors represent sample identity and size represents pseudotime distance along the trajectory. Generated using GraphPad Prism v8.4.2 (www.graphpad.com) and the R package Monocle v2.14.0.
Figure 6
Figure 6
Analysis of biological activities of myeloid subpopulations. Linear regression between GSVA scores for each of the tissue-specific myeloid populations (A1–A3) and metabolism, NLRP3 Inflammasome, complement, apoptosis, and TNF signaling. Generated using GraphPad Prism v8.4.2 (www.graphpad.com).
Figure 7
Figure 7
Pathway Analysis of SARS-CoV-2 blood, lung, and airway. DEGs from each SARS-CoV-2 blood or tissue pairwise comparison were uploaded into IPA (Qiagen Inc., https://www.qiagenbioinformatics.com/products/ingenuity-pathway-analysis) and canonical signaling pathway (a) and upstream regulator (b) analyses were performed. Heatmaps represent significant results by Activation Z-Score ≥ |2| and overlap p-value < 0.01. The boxes with the dotted outline separate drugs that were predicted as upstream regulators from pathway molecules and complexes. The remaining, significant upstream regulators were matched with drugs with known antagonistic targeting mechanisms. The top 150 UPRs in the lung are shown in (b) and the remaining are in Supplementary Fig. 5. Specific drugs for particular drug families (e.g., Anti-IL17) are found in Supplementary Table 7. : FDA-approved. : Drug in development/clinical trials. P: Preclinical.
Figure 8
Figure 8
Graphical model of COVID-19 pathogenesis. Proposed model of the inflammatory response to SARS-CoV2 infection in three compartments: the blood, lung, and airway generated using Microsoft PowerPoint version 19.0 and Adobe Illustrator version 25.0.

References

    1. Greenberg SB. Update on human rhinovirus and coronavirus infections. Semin. Respir. Crit. Care Med. 2016;37:555–571. doi: 10.1055/s-0036-1584797. - DOI - PMC - PubMed
    1. Cui J, Li F, Shi ZL. Origin and evolution of pathogenic coronaviruses. Nat. Rev. Microbiol. 2019;17:181–192. doi: 10.1038/s41579-018-0118-9. - DOI - PMC - PubMed
    1. Fung, T. S. & Liu, D. X. Human Coronavirus: Host-Pathogen Interaction. 529–560 (2019). - PubMed
    1. Zhang, B. et al. Clinical characteristics of 82 death cases with COVID-19. medRxiv 2020.02.26.20028191 (2020). 10.1101/2020.02.26.20028191
    1. Chen G, et al. Clinical and immunologic features in severe and moderate coronavirus disease 2019. J. Clin. Invest. 2020 doi: 10.1172/JCI137244. - DOI - PMC - PubMed

Substances