

Analysis of temporal trends in potential COVID-19 cases reported through NHS Pathways England
- PMID: 33782427
- PMCID: PMC8007605
- DOI: 10.1038/s41598-021-86266-3
Analysis of temporal trends in potential COVID-19 cases reported through NHS Pathways England
Abstract
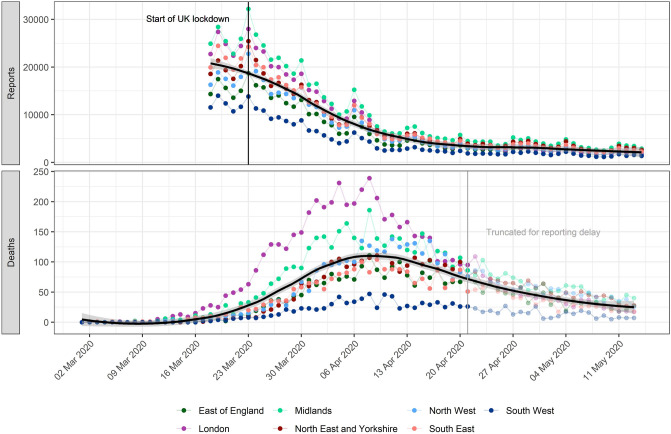
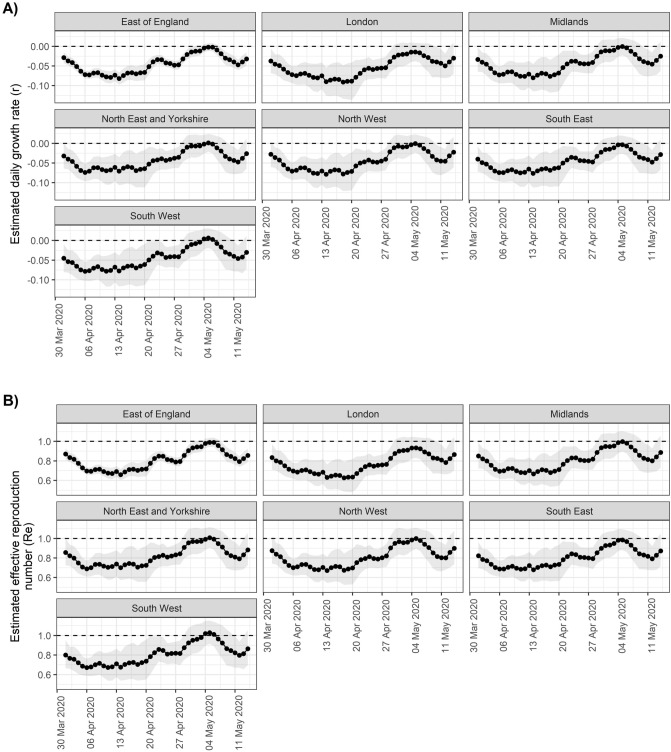
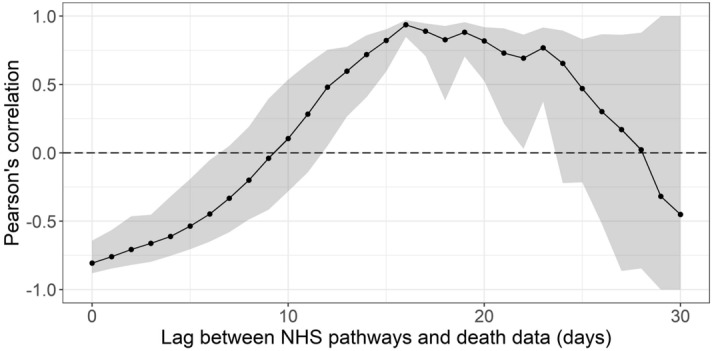
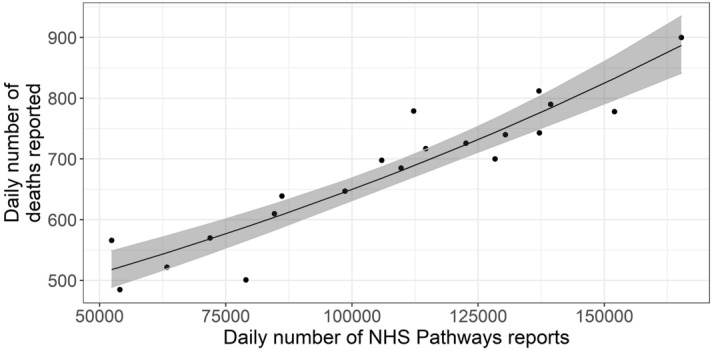
The National Health Service (NHS) Pathways triage system collates data on enquiries to 111 and 999 services in England. Since the 18th of March 2020, these data have been made publically available for potential COVID-19 symptoms self-reported by members of the public. Trends in such reports over time are likely to reflect behaviour of the ongoing epidemic within the wider community, potentially capturing valuable information across a broader severity profile of cases than hospital admission data. We present a fully reproducible analysis of temporal trends in NHS Pathways reports until 14th May 2020, nationally and regionally, and demonstrate that rates of growth/decline and effective reproduction number estimated from these data may be useful in monitoring transmission. This is a particularly pressing issue as lockdown restrictions begin to be lifted and evidence of disease resurgence must be constantly reassessed. We further assess the correlation between NHS Pathways reports and a publicly available NHS dataset of COVID-19-associated deaths in England, finding that enquiries to 111/999 were strongly associated with daily deaths reported 16 days later. Our results highlight the potential of NHS Pathways as the basis of an early warning system. However, this dataset relies on self-reported symptoms, which are at risk of being severely biased. Further detailed work is therefore necessary to investigate potential behavioural issues which might otherwise explain our conclusions.
Conflict of interest statement
The authors declare no competing interests.
Figures
References
-
- World Health Organization. Q&A on coronaviruses (COVID-19). Available from: https://www.who.int/news-room/q-a-detail/q-a-coronaviruses.
-
- A third of the global population is on coronavirus lockdown—here’s our constantly updated list of countries locking down and opening up [cited 2020 May 5]. Available from: https://www.businessinsider.fr/us/countries-on-lockdown-coronavirus-ital....
-
- Coronavirus (COVID-19) cases in the UK [cited 2020 May 5]. Available from: https://coronavirus.data.gov.uk/.
-
- Potential Coronavirus (COVID-19) symptoms reported through NHS Pathways and 111 online - NHS Digital [Internet]. [cited 2020 May 5]. Available from: https://digital.nhs.uk/data-and-information/publications/statistical/mi-....
Publication types
MeSH terms
Grants and funding
LinkOut - more resources
Full Text Sources
Other Literature Sources
Medical
