. 2021 Mar 29;11(1):7117.
doi: 10.1038/s41598-021-86514-6.

The gut microbiota metabolite urolithin A inhibits NF-κB activation in LPS stimulated BMDMs

Affiliations

The gut microbiota metabolite urolithin A inhibits NF-κB activation in LPS stimulated BMDMs

Khalid N M Abdelazeem et al. Sci Rep. .

Abstract

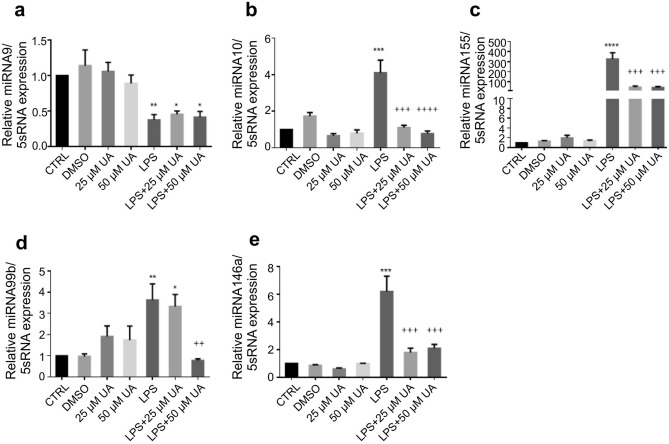
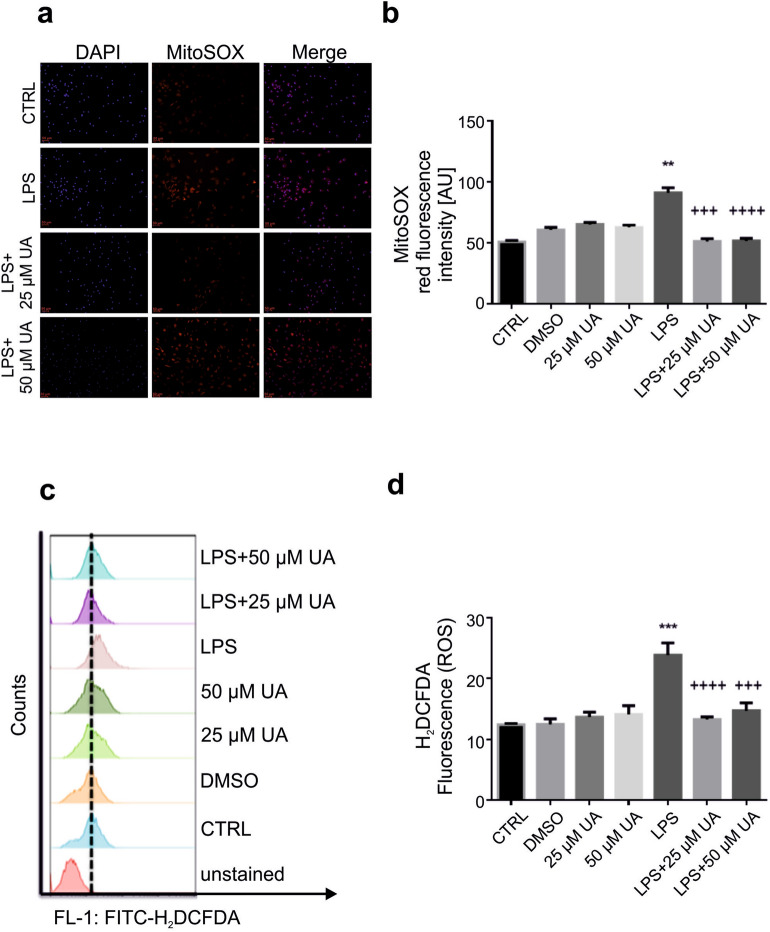
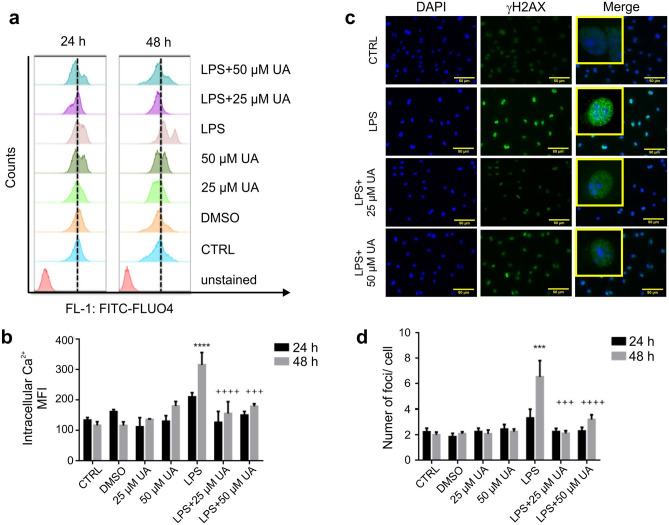
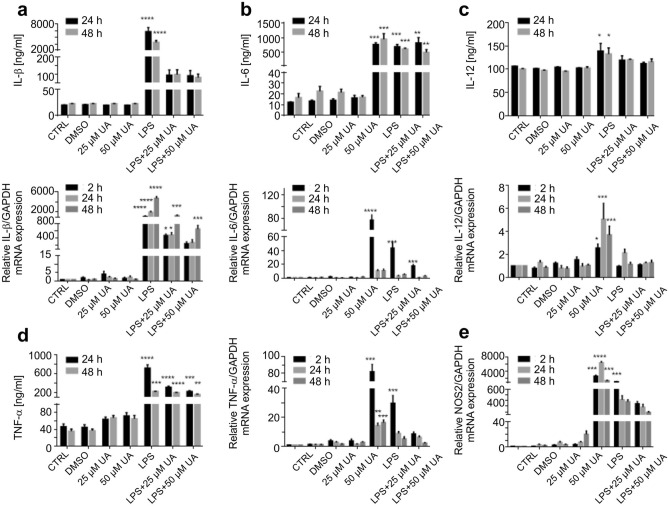
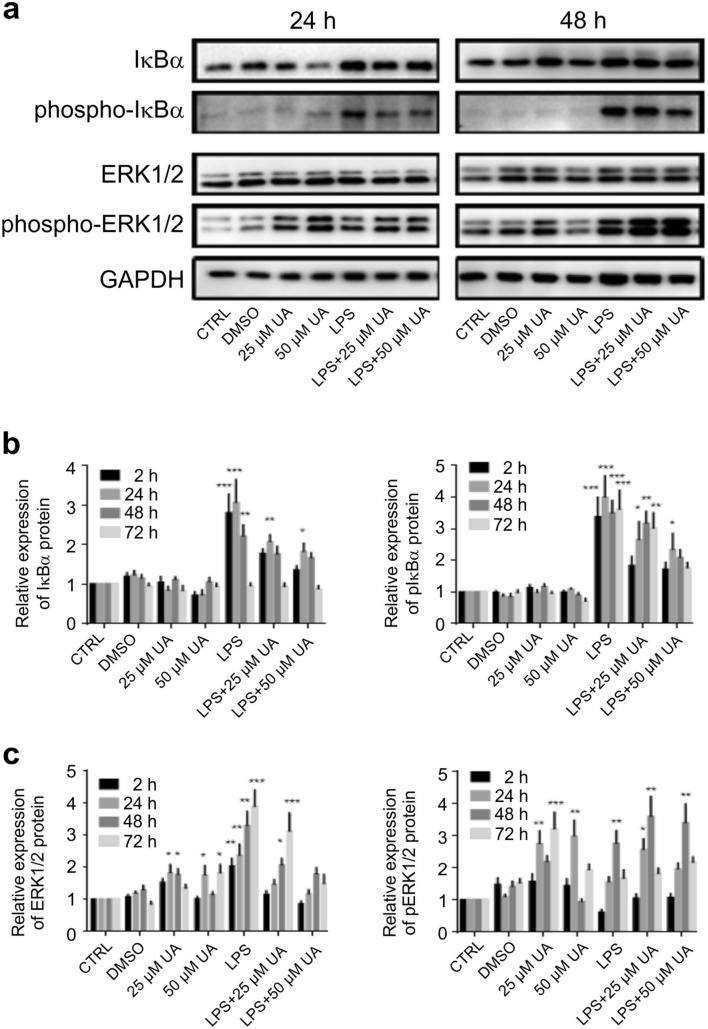
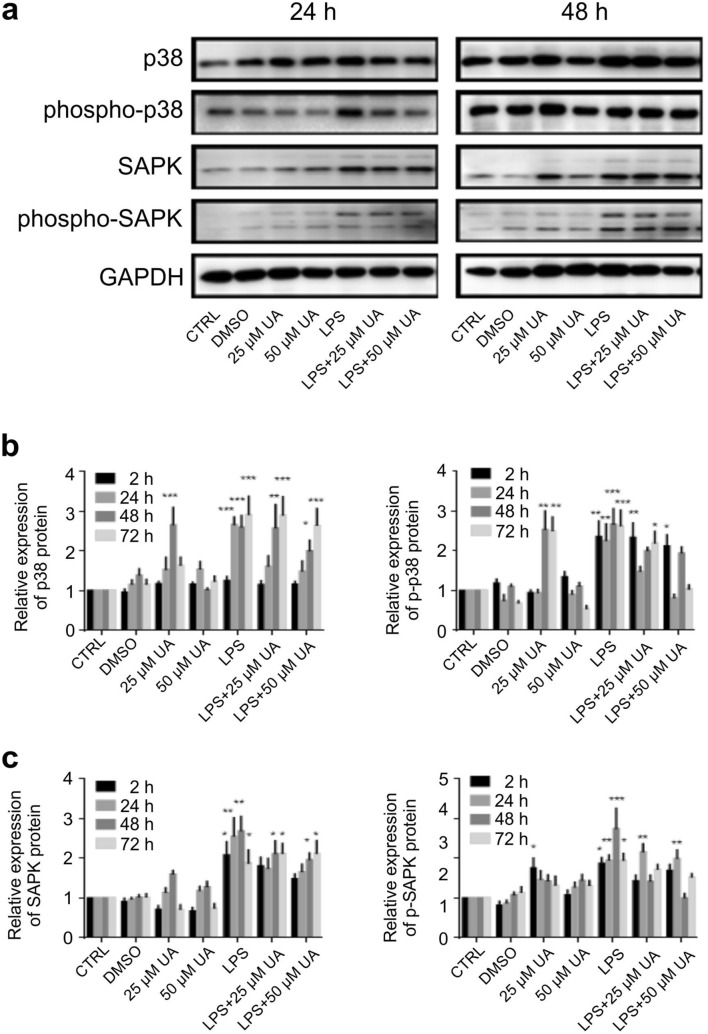
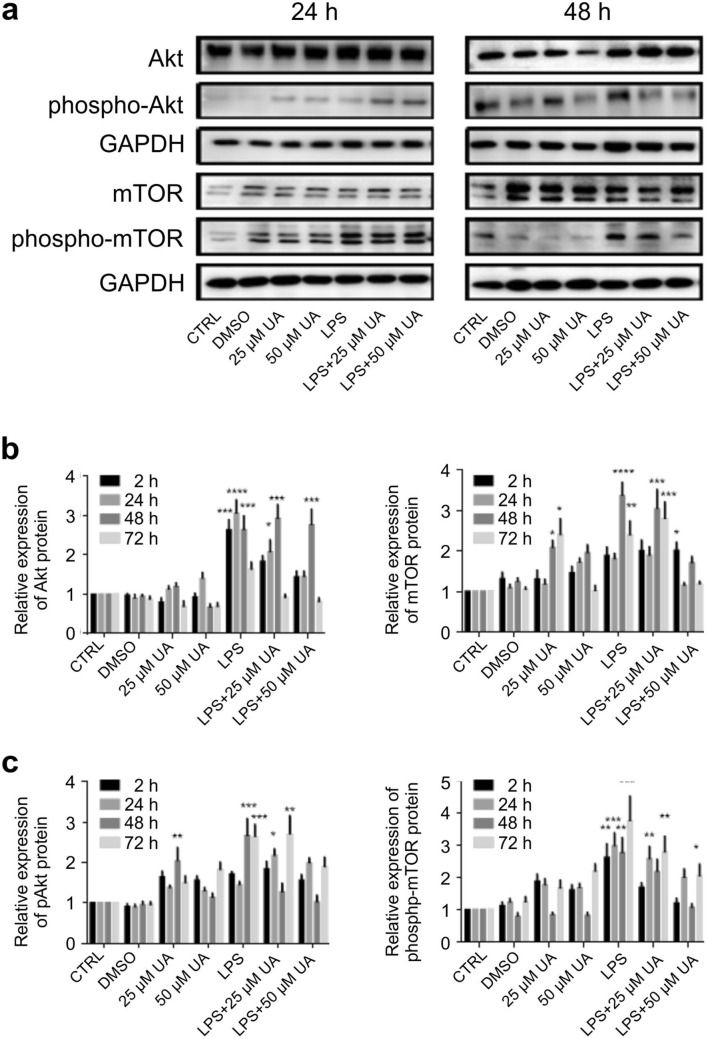
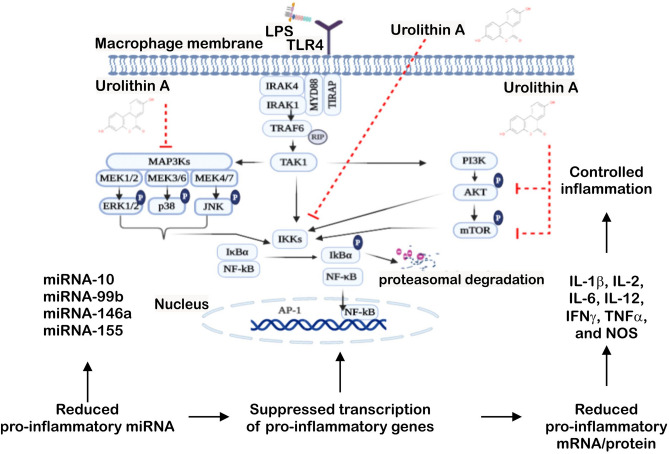
Inflammation is a natural defense process of the innate immune system, associated with the release of proinflammatory cytokines such as interleukin-1β, interleukin-6, interleukin-12 and TNFα; and enzymes including iNOS through the activation and nuclear translocation of NF-κB p65 due to the phosphorylation of IκBα. Regulation of intracellular Ca2+ is considered a promising strategy for the prevention of reactive oxygen species (ROS) production and accumulation of DNA double strand breaks (DSBs) that occurs in inflammatory-associated-diseases. Among the metabolites of ellagitannins that are produced in the gut microbiome, urolithin A (UA) has received an increasing attention as a novel candidate with anti-inflammatory and anti-oxidant effects. Here, we investigated the effect of UA on the suppression of pro-inflammatory molecules and NF-κB activation by targeting TLR4 signalling pathway. We also identified the influence of UA on Ca2+ entry, ROS production and DSBs availability in murine bone-marrow-derived macrophages challenged with lipopolysaccharides (LPS). We found that UA inhibits IκBα phosphorylation and supresses MAPK and PI3K activation. In addition, UA was able to reduce calcium entry, ROS production and DSBs availability. In conclusion, we suggest that urolithin A is a promising therapeutic agent for treating inflammatory diseases through suppression of NF-κB and preserving DNA through maintaining intracellular calcium and ROS homeostasis.


Conflict of interest statement

The authors declare no competing interests.

Figures

Figure 1
Figure 1
Urolithin A suppressed the inflammatory miRNA expression in LPS-stimulated murine BMDMs. Murine BMDMs were stimulated by 1 µg/ml of LPS in the presence or absence of UA (25 µM or 50 µM). The expression of miR-9 (a), miR-10 (b), miR-99b (c), miR.146a (d) and miR-155 (e) over 5S rRNA was evaluated in stimulated BMDMs after 72 h. The unstimulated and untreated BMDMs were used as control. BMDMs treated with DMSO were used as negative control. Arithmetic means ± SEM from seven independent experiments are depicted. One way ANOVA was used and *(p < 0.05), **(P 0.01), ***(p < 0.001), and ****(p < 0.0001) indicate statistically significant differences compared to control. ++(P 0.01), +++(p < 0.001), and ++++ (p < 0.0001) indicate statistically significant differences compared to LPS. Abbreviations: DMSO, dimethyl sulfoxide; UA, urolithin A; LPS, lipopolysaccharides; miR, micro RNA.
Figure 2
Figure 2
Urolithin A diminished cellular ROS production in LPS-stimulated murine BMDMs. (a) Murine BMDMs were stimulated by 1 µg/ml of LPS in presence or absence of UA (25 µM or 50 µM) for 48 h. LPS induced remarkable elevation of superoxide production (MitoSOX) demonstrated by red immunofluorescence which canceled with UA. Nuclei were counterstained with DAPI (blue). Images were taken with fixed exposure times for DAPI = 6 and MitoSOX = 750. The magnifications are 20-fold and scale bar represents 50 μm. (b) The graph represents a significant difference in mitochondrial ROS production compared to untreated control. (c) Representative original FACS histograms showing the effect of UA on ROS production (H2DCFDA) in LPS-stimulated murine BMDMs after 48 h. (d) The graph represents a significant difference in cellular ROS production compared to untreated control after 48 h. The unstimulated and untreated murine BMDMs were used as control. Murine BMDMs treated with DMSO were used as negative control. Arithmetic means ± SEM (n = 5–7). One way ANOVA was used and **(P < 0.001) and ***(p < 0.001) indicate statistically significant differences compared to control, whereas +++(p < 0.001), and ++++(p < 0.0001) indicate statistically significant differences compared to LPS. Abbreviations: DMSO, dimethyl sulfoxide; UA, urolithin A; LPS, lipopolysaccharides.
Figure 3
Figure 3
Urolithin A minimized the intracellular calcium concentration and ameliorated DSBs in LPS-stimulated murine BMDMs. (a, b) Murine BMDMs were stimulated with 1 µg/ml LPS in the presence or absence of UA (25 µM or 50 µM) for 24 h or 48 h. (a) Representative FACS histograms showing the effect of UA on stimulated BMDMs after 24 h and 48 h. The reference line was set at the peak of the control. (b) Arithmetic means ± SEM (n = 5–7) show a significant difference in intracellular Ca2+ concentration between control and treated groups after 24 h and 48 h. The unstimulated BMDMs were used as untreated control. DMSO was used as negative control. The intracellular Ca2+ was measured with flow cytometry. (c) Murine BMDMs were stimulated by 1 µg/ml of LPS with or without UA (25 µM or 50 µM) for 2 h (images not shown) and 48 h. After 48 h, LPS induced DSBs indicated by a prominent green immunofluorescence for Ser139-phosphorylated H2AX. Treatment with UA recorded a remarkable decrease in number of γH2AX foci. Nuclei were counterstained with DAPI (blue). The magnifications are 20-fold and scale bar represents 50 μm. The unstimulated and untreated BMDMs were used as control. DMSO was used as negative control. (d) Graph indicates the number of γH2AX foci per cell after indicated time points. Representative images and arithmetic means ± SEM from four independent experiments (600 cells were counted). Two way ANOVA was used and ***(p < 0.001) indicate statistically significant differences compared to respective control, whereas +++(p < 0.001), and ++++(p < 0.0001) indicate statistically significant differences compared to LPS. Abbreviations: DMSO, dimethyl sulfoxide; UA, urolithin A; LPS, lipopolysaccharides.
Figure 4
Figure 4
Urolithin A reduced the pro-inflammatory cytokine production and mRNA expression in LPS-stimulated murine BMDMs. Murine BMDMs were stimulated by 1 µg/ml of LPS in the presence or absence of UA (25 µM or 50 µM). Subsequently, expression of the pro-inflammatory cytokines IL-1β (a), IL-6 (b), IL-12 (c), TNF-α (d), and NOS2 (e) were measured in BMDMs by qRT-PCR (over GAPDH) and ELISA at depicted time points. The unstimulated and untreated BMDMs were used as control. BMDMs treated with DMSO were used as negative control. Arithmetic means ± SEM from seven independent experiments are depicted. Two way ANOVA was used and *(p < 0.05), **(P 0.01), ***(p < 0.001), and ****(p < 0.0001) indicate statistically significant differences compared to respective control. Abbreviations: DMSO, dimethyl sulfoxide; UA, urolithin A; LPS, lipopolysaccharides; IL, Interleukin; GAPDH, glyceraldehyde 3-phosphate dehydrogenase; and TNF, tumor necrosis factor; NOS, nitric oxide synthase.
Figure 5
Figure 5
Effect of urolithin A on IκBα and MAP kinase ERK1/2 expression and phosphorylation in LPS-stimulated murine BMDMs. Murine BMDMs were stimulated by 1 µg/ml of LPS in the presence or absence of UA (25 µM or 50 µM) and harvested at indicated time intervals, followed by western blot analysis. Phosphorylation of IκBα (a, b) and MAP kinases ERK1/2 (a, c) were monitored by immunoblot using pIκBα (Ser32/36) monoclonal antibodies and phospho-p44/42 MAP kinase (Thr202/Tyr204) polyclonal antibodies, respectively at depicted time points. Subsequently, blots were stripped and re-incubated with antibodies against total IκBα and ERK1/2. GAPDH served as a loading control. The unstimulated and untreated BMDMs were used as control. BMDMs treated with DMSO were used as negative control. Representative images and arithmetic means ± SEM from five independent experiments are depicted. Two way ANOVA was used and *(p < 0.05), **(P 0.01), and ***(p < 0.001) indicate statistically significant differences compared to respective control. Full length blots are found in the Supplementary File 9. Abbreviations: DMSO, dimethyl sulfoxide; LPS, lipopolysaccharides; UA, urolithin A; GAPDH, glyceraldehyde-3-phosphate dehydrogenase.
Figure 6
Figure 6
Effect of urolithin A on MAP kinase p38 and SAPK/JNK expression and phosphorylation in LPS-stimulated murine BMDMs. Murine BMDMs were stimulated by 1 µg/ml of LPS in the presence or absence of UA (25 µM or 50 µM) and harvested at indicated time intervals, followed by western blot analysis. Phosphorylation of MAP kinase p38 (a, b), and SAPK/JNK (a, c) were monitored by immunoblot using phospho-p38 MAP kinase (Thr180/Tyr182) and phospho-SAPK/JNK MAP kinase (Thr183/Tyr185) monoclonal antibodies, respectively at depicted time points. Subsequently, blots were stripped and re-incubated with antibodies against total p38 and SAPK/JNK. GAPDH served as a loading control. The unstimulated and untreated BMDMs were used as control. BMDMs treated with DMSO were used as negative control. Representative images and arithmetic means ± SEM from five independent experiments are depicted. Two way ANOVA was used and *(p < 0.05), **(P 0.01), and ***(p < 0.001) indicate statistically significant differences compared to respective control. Full length blots are found in the Supplementary File 9. Abbreviations: DMSO, dimethyl sulfoxide; LPS, lipopolysaccharides; UA, urolithin A; GAPDH, glyceraldehyde-3- phosphate dehydrogenase.
Figure 7
Figure 7
Urolithin A diminished PI3K/AKT/mTOR activation in LPS-stimulated murine BMDMs. Murine BMDMs were stimulated by 1 µg/ml of LPS in the presence or absence of UA (25 µM or 50 µM) and harvested at indicated time intervals followed by western blot analysis. Phosphorylation of AKT (a, b) and mTOR (a, c) were monitored by immunoblot using pAKT (Ser473) and phospho-mTOR (Ser2448) monoclonal antibodies. Subsequently, blots were stripped and re-incubated with antibody against total AKT and mTOR. GAPDH served as a loading control. The unstimulated and untreated BMDMs were used as control. BMDMs treated with DMSO were used as negative control. Representative images and arithmetic means ± SEM from five independent experiments are depicted. Two way ANOVA was used and *(p < 0.05), **(P 0.01), ***(p < 0.001), and ****(p < 0.0001) indicate statistically significant differences compared to respective control. Full length blots are found in the Supplementary File 9. Abbreviations: DMSO, dimethyl sulfoxide; LPS, lipopolysaccharides; UA, urolithin A; GAPDH, glyceraldehyde-3- phosphate dehydrogenase.
Figure 8
Figure 8
Urolithin A controlled NF-kB inflammatory response. LPS stimulates TLR4 signalling cascades. Urolithin A impairs the NF-kB activation through the inactivation of IKKs. Urolithin A suppresses MAPKs activation through blocking ERK, p38 and JNK phosphorylation. Additionally, urolithin A inhibits the phosphorylation of AKT and mTOR protein. Abbreviation: LPS; lipopolysaccharide; IR, ionizing radiation; TIRAP, TIR adaptor protein; MyD88, myeloid differentiation primary-response gene 88; IRAK, interleukin-1 receptor associated kinase; TRAF, TNF receptor associated factor; RIP, receptor-interacting protein kinases; TAK, transforming growth factor beta-activated kinase 1; IKK, IκB kinase; MAPK, mitogen activated protein kinase; PI3K, phosphatidylinositol 3-kinases; mTOR, mechanistic target of rapamycin; ERK, extracellular regulated kinase; JNK, c-Jun N-terminal kinase; NF-κB, nuclear factor-κB; IκB, kinase complex; AP, activator protein; IL, interleukin; IFN, interferon; TNF, tumor necrosis factor; and NOS, nitric oxide.

References

    1. Nobel YR, et al. Metabolic and metagenomic outcomes from early-life pulsed antibiotic treatment. Nat. Commun. 2015;6:7486. doi: 10.1038/ncomms8486. - DOI - PMC - PubMed
    1. Lobionda S, Sittipo P, Kwon HY, Lee YK. The role of gut microbiota in intestinal inflammation with respect to diet and extrinsic stressors. Microorganisms. 2019;7:271. doi: 10.3390/microorganisms7080271. - DOI - PMC - PubMed
    1. Molodecky NA, et al. Increasing incidence and prevalence of the inflammatory bowel diseases with time, based on systematic review. Gastroenterology. 2012;142:46–54. doi: 10.1053/j.gastro.2011.10.001. - DOI - PubMed
    1. Rutter MD, et al. Thirty-year analysis of a colonoscopic surveillance program for neoplasia in ulcerative colitis. Gastroenterology. 2006;130:1030–1038. doi: 10.1053/j.gastro.2005.12.035. - DOI - PubMed
    1. Ullman TA, Itzkowitz SH. Intestinal inflammation and cancer. Gastroenterology. 2011;140:1807–1816. doi: 10.1053/j.gastro.2011.01.057. - DOI - PubMed

Publication types

LinkOut - more resources