. 2021 Mar 29;4(1):427.
doi: 10.1038/s42003-021-01952-2.

MiR-199-3p enhances muscle regeneration and ameliorates aged muscle and muscular dystrophy

Affiliations

MiR-199-3p enhances muscle regeneration and ameliorates aged muscle and muscular dystrophy

Masashi Fukuoka et al. Commun Biol. .

Abstract

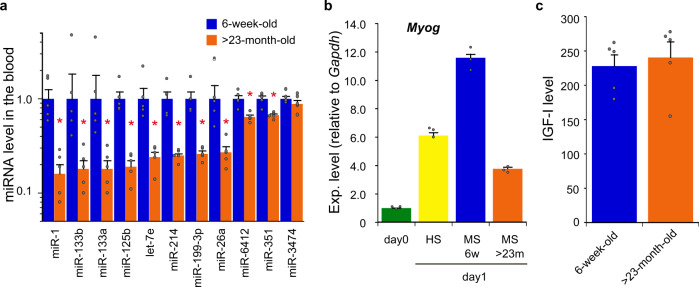
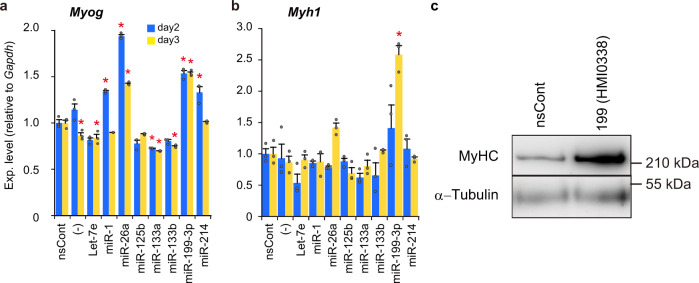
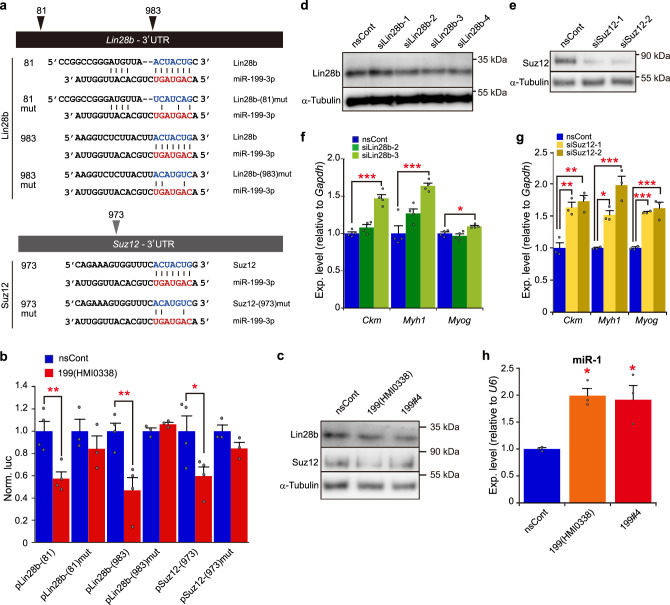
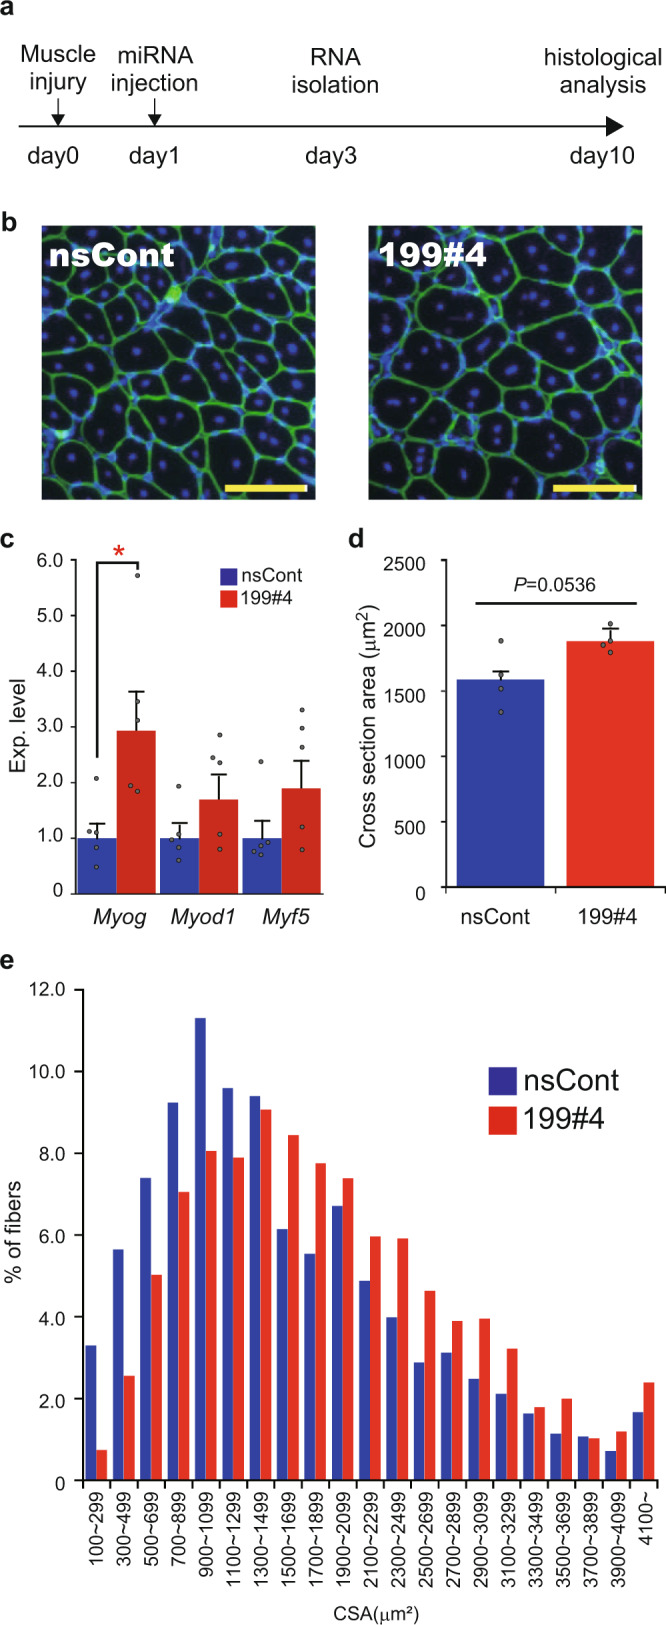
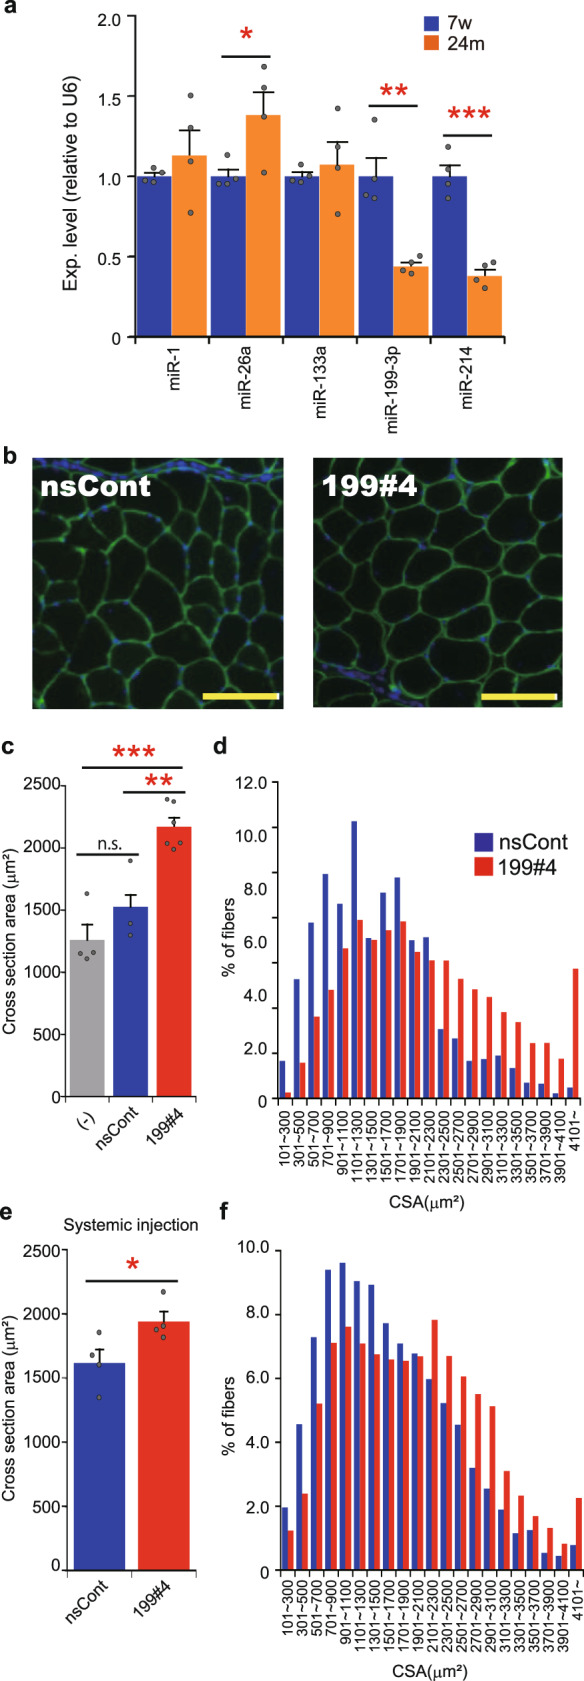
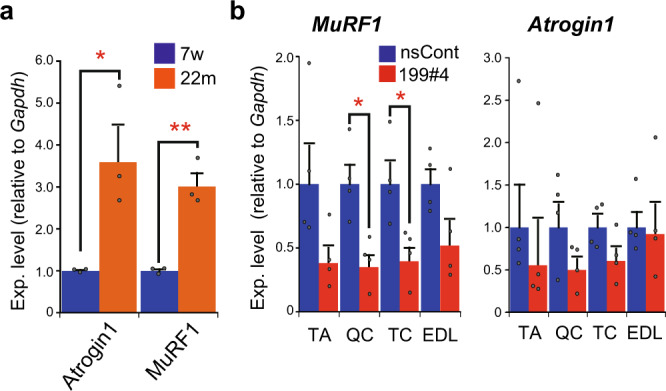
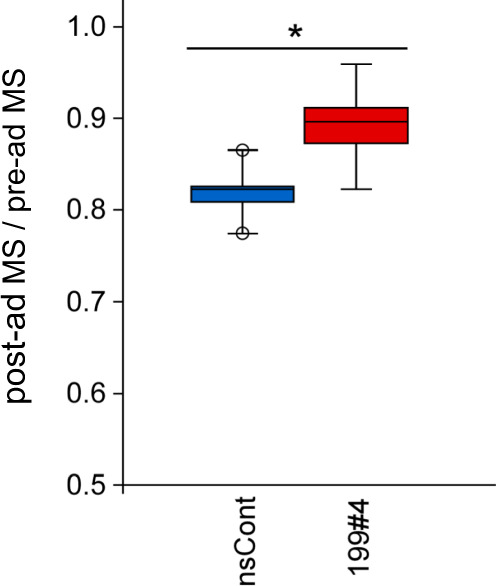
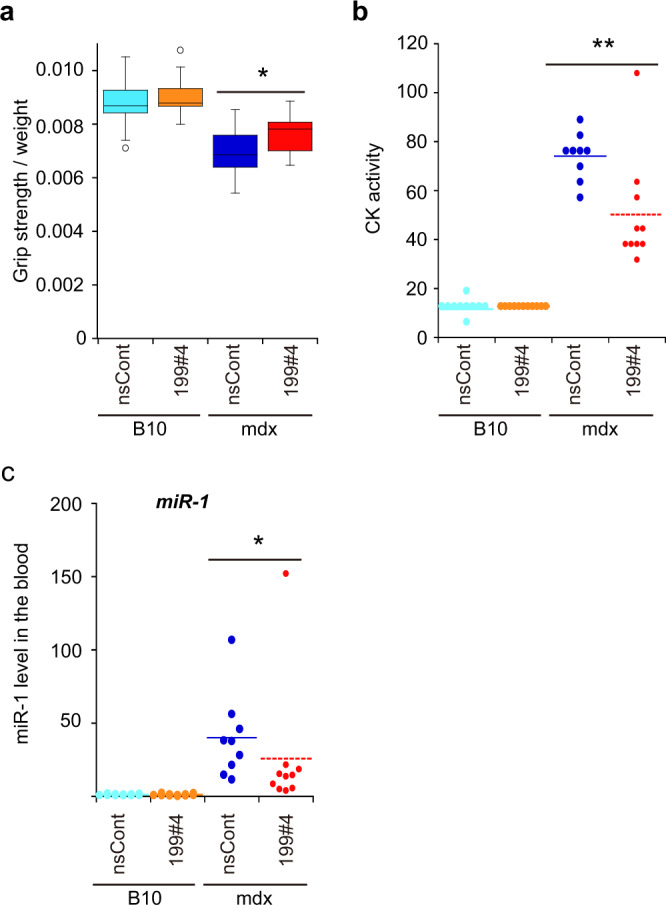
Parabiosis experiments suggest that molecular factors related to rejuvenation and aging circulate in the blood. Here, we show that miR-199-3p, which circulates in the blood as a cell-free miRNA, is significantly decreased in the blood of aged mice compared to young mice; and miR-199-3p has the ability to enhance myogenic differentiation and muscle regeneration. Administration of miR-199 mimics, which supply miR-199-3p, to aged mice resulted in muscle fiber hypertrophy and delayed loss of muscle strength. Systemic administration of miR-199 mimics to mdx mice, a well-known animal model of Duchenne muscular dystrophy (DMD), markedly improved the muscle strength of mice. Taken together, cell-free miR-199-3p in the blood may have an anti-aging effect such as a hypertrophic effect in aged muscle fibers and could have potential as a novel RNA therapeutic for DMD as well as age-related diseases. The findings provide us with new insights into blood-circulating miRNAs as age-related molecules.


Conflict of interest statement

H.H. and M.F. have a pending patent regarding the results of this study. All other authors declare no competing interests.

Figures

Fig. 1
Fig. 1. Blood-circulating substances in young and aged mice.
a Cell-free miRNAs (cf-miRNAs) circulating with blood in young and aged mice. RNA was isolated from the plasma of young (6-week-old) and aged (>23-month-old) C57BL/6J mice, and miRNAs (indicated) were examined by qRT-PCR. The data were analyzed by the delta–delta Ct method using the data of cel-miR-39 as an external control and normalized with the data obtained from young mice as 1. Data are shown as mean ± SEM (n = 5 mice; *p < 0.05 by Wilcoxon rank-sum test). b Myogenic differentiation with young and aged mouse serum. C2C12 cells were cultured for 24 h in following the differentiation media: DMEM supplemented with 5% young mouse serum (MS, 6w) or 5% aged mouse serum (MS, >23m), and DMEM supplemented with 2% house serum (HS) as a conventional differentiation medium. Total RNA was extracted from the cells and undifferentiated C2C12 cells (day 0) as a control. The expression of Myog as a myogenic differentiation marker was examined by qRT-PCR and analyzed by the delta–delta Ct method, using the data of Gapdh as an internal reference. The data were further normalized with the data of undifferentiated cells (day 0) as 1. Data are shown as mean ± SEM (n = 3 independent determinations). c IGF-I level in young and aged mouse blood. Plasma samples were prepared from the blood of young and aged mice, and plasma levels of IGF-I were measured by ELISA. Data are shown as mean ± SEM (n = 5 mice).
Fig. 2
Fig. 2. Effects of miRNAs on myogenic differentiation.
a, b Expression of myogenic differentiation marker genes. MiRNAs (indicated) that are more abundant in young mouse blood than in aged mouse blood were examined. Synthetic miRNAs (Mission® microRNA mimics) were introduced into C2C12 cells; and 2 and 3 days after miRNA introduction, the expression of Myog (a) and Myh1 (b) was examined by qRT-PCR as in Fig. 1b. Cells treated with non-silencing control RNAs (nsCont) and untreated cells (−) were also examined as a control. Normalized data were further normalized with the data obtained from cells treated with nsCont as 1. Data are shown as mean ± SEM (n = 3 independent determinations; *p < 0.001 by Dunnett’s test). c Myosin heavy chain (MyHC) expression. C2C12 cells transfected with Mission miR-199-3p mimic [199(HMI0338)] and nsCont were cultured for 4 days. Cell lysate was prepared and examined by western blotting using antibodies against MyHC and α-tubulin (as a loading control).
Fig. 3
Fig. 3. Target genes for miR-199-3p.
a Schematic representation of predicted binding sequences of target genes. Lin28b and Suz12 are candidate target genes for miR-199-3p. The predicted binding sequences and their position are shown. The seed sequence of miR-199-3p is indicated in red. Designed binding sequences with mismatches are also shown. b Suppression of reporter genes carrying the predicted binding sequences by miR-199-3p. Reporter plasmids, pLin28b-(81), pLin28b-(983), and pSuz12-(973), encoding the predicted binding sequences (indicated in a) in the 3′UTR of the Renilla luciferase reporter gene, and their mutant plasmids, pLin28b-(81)mut, pLin28b-(983)mut, and pSuz12-(973)mut, carrying the mismatched sequences (indicated in a) were co-transfected with Mission miR-199-3p mimic [199(HMI0338)] or nsCont to C2C12 cells. The Renilla luciferase activity (test reporter) was normalized with the Photinus luciferase (control reporter) activity. The data were further normalized to the data obtained with nsCont as 1. Data are shown as mean ± SEM [n = at least 3 independent determinations; *p < 0.05, **p < 0.01 by Student’s t test (two-tailed)]. c Suppression of Lin28b and Suz12 by miR-199-3p. C2C12 cells were transfected with miR-199 mimics [199(HMI0338) and our designed miR199#4 (199#4); see Supplementary Fig. 3] and nsCont. Two days later, Lin28b and Suz12 were examined by western blotting. Alpha-tubulin was examined as a loading control. d, e Gene silencing of Lin28b and Suz12 by RNAi. C2C12 cells were transfected with designed siRNAs against Lin28b (four siRNAs) and Suz12 (two siRNAs). Two days later, Lin28b (d) and Suz12 (e) were examined by western blotting as in c. f, g Expression of myogenic differentiation markers under Lin28b and Suz12 gene silencing. The expression of myogenic differentiation maker genes (indicated) under Lin28b (f) and Suz12 (g) gene silencing was examined by qRT-PCR and analyzed as in Fig. 2a, b. Data are shown as mean ± SEM (n = at least 3 independent determinations; *p < 0.05, **p < 0.01, ***p < 0.001 by Dunnett’s test). h Production of matured miR-1. C2C12 cells were transfected with miR-199 mimics and nsCont. The level of matured miR-1 in the treated cells was examined by qRT-PCR followed by the delta–delta Ct analysis, using the data of U6 snRNA as an internal reference. The data were normalized with the data of nsCont as 1. Data are shown as mean ± SEM (n = 3 independent determinations; *p < 0.05 by Dunnett’s test).
Fig. 4
Fig. 4. Effects of miR199#4 on muscle regeneration.
a Schematic representation of experiment design. C57BL/6J mice (8-week-old) are injected with BaCl2 to the TA muscle for muscle injury (day 0), and miR199#4 and nsCont were administered to the damaged sites 24 h later (day 1). Gene expression analysis and histological analysis are performed on day 3 and day 10, respectively. b Photos of the cross-section of myofibers treated with miR199#4 (199#4) and nsCont. Cryosections were prepared from regenerating TA muscles and stained with an antibody against Laminin-α2 (green) and DAPI (blue). Scale bars indicate 100 µm. c Expression of myogenic differentiation markers. Total RNA was prepared from regenerating TA muscles on day 3, and examined by qRT-PCR for myogenic differentiation maker genes (indicated). The data were analyzed by the delta–delta Ct method, using the data of Actb as an internal reference and further normalized with the data obtained with nsCont as 1. Data are shown as mean ± SEM [n = 5 treated mice; *p < 0.05 by Student’s t test (two-tailed)]. d Averaged cross-sectional area of regenerating myofibers. Cryosections of regenerating myofibers were prepared from four mice in each miR199#4 (199#4) and nsCont treatment and examined as in b. The cross-sectional areas (CSAs) of regenerating myofibers, which possess central nuclei (see b), were measured by the ImageJ software. At least 200 CSAs per test mouse were examined and averaged, and the averaged CSAs were further averaged in each treatment group (miR199#4 and nsCont). Data are shown as mean ± SEM [n = 4 treated mice, Student’s t test (two-tailed)]. e Histogram of the CSAs of myofibers. The CSAs examined in d were fractionated by size (indicated), and the number of the CSA data in each fraction was calculated by percentage (%).
Fig. 5
Fig. 5. Effects of miR199#4 on aged mice.
a Expression of miRNAs in young and aged TA muscles. The expression levels of miRNAs (indicated) in the TA muscle of young (7-week-old: 7w) and aged (~24-month-old: 24m) C57BL/6J mice were examined by qRT-PCR and analyzed by the delta–delta Ct method, using the data of U6 snRNA as an internal reference. The data were normalized to the data of young mice as 1. Data are shown as mean ± SEM [n = 4 mice; *p < 0.05, **p < 0.01, ***p < 0.001 by Student’s t test (two-tailed)]. b Photos of the cross-section of myofibers. Aged C57BL/6J mice (~24-month-old) were injected with miR199#4 (199#4) or nsCont to the TA muscle, and 2 days later the TA muscles were examined as in Fig. 4b. Scale bars indicate 100 µm. c Averaged cross-sectional area of myofibers. The cross-sectional areas (CSAs) of myofibers in the TA muscle were measured and analyzed as in Fig. 4d. The CSAs of myofibers in untreated aged mice (−) were also examined. The number of mice examined was as follows: six miR199#4-dosed mice, three nsCont-dosed mice, and four untreated mice. Data are shown as mean ± SEM [**p < 0.01, ***p < 0.001 by ANOVA (Tukey’s post hoc test)]. d Histogram of the CSAs of myofibers. Histogram of the CSAs of myofibers was analyzed and displayed as in Fig. 4e. e, f Analyses of the CSAs of myofibers in aged mice intravenously injected with miR199#4. Aged C57BL/6J mice (~24-month-old) were intravenously injected with miR199#4 or nsCont from the tail vein. One week later, the CSAs of myofibers in the TA muscle were examined as in Fig. 4b; and averaged CSA (e) and histogram of the CSAs (f) were analyzed as in Fig. 4d, e, respectively. The data of averaged CSAs (e) are shown as mean ± SEM [n = 4 treated mice; *p < 0.05 by Student’s t test (two-tailed)].
Fig. 6
Fig. 6. Suppression of genes related to the muscle atrophy pathway by miR199#4 treatment.
a Expression of Atrogin1 and MuRF1 in young and aged muscles. The expression of Atrogin1 and MuRF1, which are involved in the muscle atrophy pathway, in young (7-week-old: 7w) and aged (22-month-old: 22m) mice was examined by qRT-PCR as in Fig. 1b, and normalized to the data of young mice as 1. Data are shown as mean ± SEM [n = 3 mice; *p < 0.05, **p < 0.01 by Student’s t test (two-tailed)]. b Suppression of MuRF1 and Atrogin1 by miR199#4 treatment. Total RNA was extracted from the quadriceps (QC), triceps (TC), extensor digitorum longus (EDL), and TA muscles in aged mice intravenously injected with miR199#4 (199#4) or nsCont (the same mice examined in Fig. 5e, f), and the level of MuRF1 and Atrogin1 was examined by qRT-PCR followed by the delta–delta Ct analysis as in Fig. 2a, b. Data are shown as mean ± SEM [n = 4 treated mice; *p < 0.05 by Student’s t test (two-tailed)].
Fig. 7
Fig. 7. Grip strength test of aged mice.
Eighty-week-old (20-month-old) C57BL/6J mice were subjected to the grip strength test, and 1 week later, miR199#4 (199#4) and nsCont were intravenously administered. The grip strength test was carried out again 9 weeks later. The data were normalized by body weight, and the ratio of post-administered muscle strength (post-ad MS) to pre-administered muscle strength (pre-ad MS) was calculated. Data are shown as mean ± SEM [n = 5 mice; *p < 0.05 by Student’s t test (two-tailed)].
Fig. 8
Fig. 8. Effects of miR199#4 on mdx mice.
a Grip strength test of mdx mice. Mdx and B10 control mice (8-week-old) were injected twice intravenously with miR199#4 (199#4) and nsCont, and examined by the grip strength test 1 week after the last administration. The first two grip strength data were normalized by body weight and averaged. The number of mice examined was as follows: 13 miR199#4-dosed mdx mice, 12 nsCont-dosed mdx mice, 11 miR199#4-dosed B10 mice, and 13 nsCont-dosed B10 mice. Data are shown as mean ± SEM [*p < 0.05 by Student’s t test (two-tailed)]. b Creatine kinase (CK) activity. 1 week after the first administration, blood samples were collected and serum CK activity was measured. Data are plotted and shown in an arbitrary unit. Meanscore is indicated by a dotted bar [**p < 0.01 by Wilcoxon rank-sum test]. c Cf-miR-1 in the blood. The level of cf-miR-1 was examined in the same blood samples as b by qRT-PCR and analyzed as in Fig. 1a. The data were normalized with the averaged data of nsCont-dosed B10 mice as 1. Data are plotted, and meanscore is indicated by a dotted bar (*p < 0.05 by Wilcoxon rank-sum test). The number of mice examined in b and c was as follows: 10 miR199#4-dosed mdx mice, 9 nsCont-dosed mdx mice, 11 miR199#4-dosed B10 mice, and 11 nsCont-dosed B10 mice.

Similar articles

Cited by

References

    1. Sen P, Shah PP, Nativio R, Berger SL. Epigenetic mechanisms of longevity and aging. Cell. 2016;166:822–839. doi: 10.1016/j.cell.2016.07.050. - DOI - PMC - PubMed
    1. Herranz N, Gil J. Mechanisms and functions of cellular senescence. J. Clin. Investig. 2018;128:1238–1246. doi: 10.1172/JCI95148. - DOI - PMC - PubMed
    1. Dodig S, Cepelak I, Pavic I. Hallmarks of senescence and aging. Biochem. Med. 2019;29:030501. doi: 10.11613/BM.2019.030501. - DOI - PMC - PubMed
    1. Ohtani N, et al. Opposing effects of Ets and Id proteins on p16INK4a expression during cellular senescence. Nature. 2001;409:1067–1070. doi: 10.1038/35059131. - DOI - PubMed
    1. Takahashi A, et al. Mitogenic signalling and the p16INK4a-Rb pathway cooperate to enforce irreversible cellular senescence. Nat. Cell Biol. 2006;8:1291–1297. doi: 10.1038/ncb1491. - DOI - PubMed

Publication types