. 2021 Jun;31(6):631-648.
doi: 10.1038/s41422-021-00491-z. Epub 2021 Mar 29.

In vivo self-assembled small RNAs as a new generation of RNAi therapeutics

Affiliations

In vivo self-assembled small RNAs as a new generation of RNAi therapeutics

Zheng Fu et al. Cell Res. 2021 Jun.

Abstract

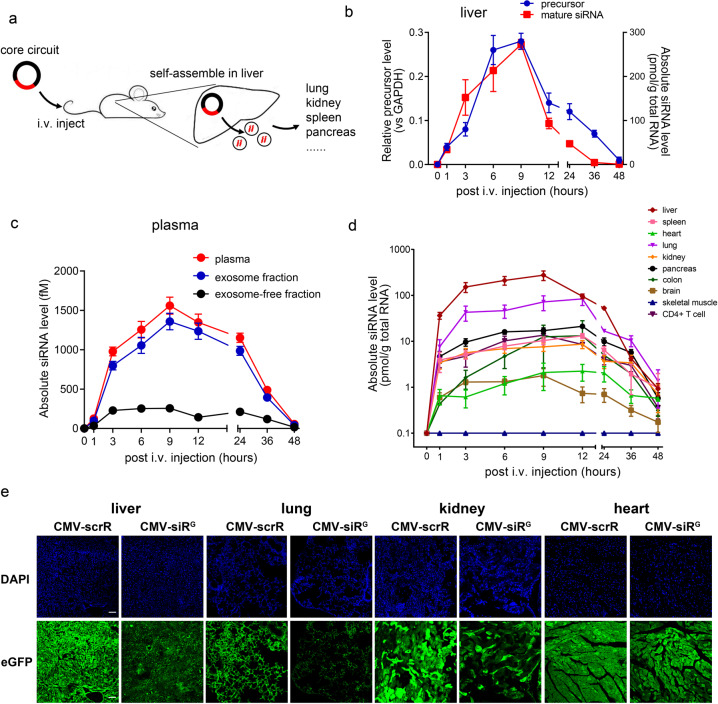
RNAi therapy has undergone two stages of development, direct injection of synthetic siRNAs and delivery with artificial vehicles or conjugated ligands; both have not solved the problem of efficient in vivo siRNA delivery. Here, we present a proof-of-principle strategy that reprogrammes host liver with genetic circuits to direct the synthesis and self-assembly of siRNAs into secretory exosomes and facilitate the in vivo delivery of siRNAs through circulating exosomes. By combination of different genetic circuit modules, in vivo assembled siRNAs are systematically distributed to multiple tissues or targeted to specific tissues (e.g., brain), inducing potent target gene silencing in these tissues. The therapeutic value of our strategy is demonstrated by programmed silencing of critical targets associated with various diseases, including EGFR/KRAS in lung cancer, EGFR/TNC in glioblastoma and PTP1B in obesity. Overall, our strategy represents a next generation RNAi therapeutics, which makes RNAi therapy feasible.


Conflict of interest statement

C.-Y.Z., X.C. and H.L. are co-inventors on patents related to using the genetic circuits to treat diseases. The application numbers are PCT/CN2015/094809, PCT/CN2017/083311 and PCT/CN2017/083312. K.Z. is a co-inventor on PCT/CN2015/094809 and PCT/CN2017/083311. U.U.-R. is a co-inventor on PCT/CN2017/083311 and PCT/CN2017/083312.

Figures

Fig. 1
Fig. 1. Construction and characterization of the genetic circuits.
a Schematic description of the architecture of the genetic circuit. The core circuit contains a promoter part (black) and an siRNA-expressing part (red). When the core circuit is placed in a cell/tissue chassis, the promoter drives the transcription of the siRNA and directs the siRNA payload into exosomes. Two composable, plug-in parts are driven by the same promoter of the core circuit and incorporated into the core circuit structure: one encodes a guidance tag (green) that is anchored on the exosome surface to enable targeting of exosomes to cells and tissues, and the other part (blue) expresses a different tandem siRNA. The core circuit design facilitates the systematic distribution of siRNAs to multiple tissues, while the composable-core circuit increases the simultaneous accumulation of two siRNAs in specific tissues. b Quantitative RT-PCR analysis of the levels of the desired guide strand and undesired passenger strand generated using the pre-miRNA strategy (EGFR siRNA is embedded in pre-miR-155 and is controlled by a CMV promoter, named CMV-siRE) or the shRNA strategy (EGFR siRNA is placed in an shRNA and is controlled by a U6 promoter, named U6-shRE) in HEK293T cells. A CMV- or U6-directed scrambled RNA (CMV-scrR or U6-scrR) was used as a control. RNU6A (U6) was selected as a reference gene for normalization of cellular siRNA levels (n = 3 in each group). c Quantitative RT-PCR analysis of EGFR siRNA levels in exosomes derived from HEK293T cells transfected with the CMV-scrR or CMV-siRE circuit. miR-16, a universally expressed miRNA, was selected as a reference gene for the normalization of siRNA levels in exosomes (n = 3 in each group). d Quantitative RT-PCR analysis of EGFR mRNA levels in LLC cells treated with exosomes derived from HEK293T cells transfected with CMV-scrR or CMV-siRE (n = 3 in each group). Different doses (total protein contents of exosomes were 4, 20 and 100 μg, respectively) of exosomes were added to reveal the dose-dependent effect. e Western blot analysis of EGFR protein levels in LLC cells treated with exosomes derived from HEK293T cells transfected with CMV-scrR or CMV-siRE. Different doses of exosomes were added to reveal the dose-dependent effect. Left panel, representative western blots. Right panel, quantitative analysis (n = 3 in each group). f A CMV-directed Flag-Lamp2b fusion construct (CMV-Flag-Lamp2b) or a CMV-directed Lamp2b construct (CMV-Lamp2b) was transfected into HEK293T cells. Exosomes were then isolated and either directly loaded for western blotting with anti-Flag and anti-CD63 antibodies (equal CD63 band densities indicate similar exosome levels) or immunoprecipitated with IgG or anti-Flag beads before western blotting. g The CMV-siRE, CMV-siRT or CMV-siRE+T circuits were transfected into HEK293T cells. A quantitative RT-PCR assay was performed to assess the levels of EGFR and TNC siRNAs in transfected HEK293T cells (n = 3 in each group). h CMV-scrR, CMV-siRE or CMV-Flag-siRE+T circuits were transfected into HEK293T cells. Exosomes were then isolated and either directly loaded for western blotting with anti-Flag and anti-CD63 antibodies or immunoprecipitated with IgG or anti-Flag beads before western blotting. A quantitative RT-PCR assay was performed to assess the levels of EGFR and TNC siRNAs in immunoprecipitated exosomes (n = 3 in each group). i Quantitative RT-PCR analysis of EGFR and TNC mRNA levels in U87MG cells treated with exosomes derived from HEK293T cells transfected with the CMV-scrR, CMV-siRE or CMV-RVG-siRE+T circuit (n = 3 in each group). Different doses of exosomes were added to reveal the dose-dependent effect. j Western blot analysis of EGFR and TNC protein levels in U87MG cells treated with exosomes derived from HEK293T cells transfected with the CMV-scrR, CMV-siRE or CMV-RVG-siRE+T circuit. Different doses of exosomes were added to reveal the dose-dependent effect. Left panel, representative western blots. Right panel, quantitative analysis (n = 3 in each group). Values are presented as the means ± SEM. Significance was determined using one-way ANOVA followed by Dunnett’s multiple comparison in d, e, g, i, j. *P < 0.05; **P < 0.01; ***P < 0.005; ns, not significant.
Fig. 2
Fig. 2. Delivery of EGFR siRNA to various mouse tissues following the intravenous injection of the CMV-siRE circuit.
a Schematic presentation of the in vivo assembly and delivery of siRNAs by intravenous injection of the core circuit. b Kinetics of the precursor and mature form of EGFR siRNA in mouse liver following tail vein injection of 5 mg/kg CMV-siRE circuit (n = 3 in each group). c Kinetics of the EGFR siRNA in the mouse plasma, exosome pellets and exosome-free plasma following tail vein injection of 5 mg/kg CMV-siRE circuit (n = 3 in each group). d Tissue distribution kinetics of the EGFR siRNA in various mouse tissues following tail vein injection of 5 mg/kg CMV-siRE circuit (n = 3 in each group). e Representative fluorescence microscopy images showing eGFP levels in frozen sections of liver, lung, kidney and heart obtained from eGFP-transgenic mice after intravenous injection of 5 mg/kg CMV-scrR or CMV-siRG circuit for seven times. Positive eGFP signals are shown in green, and DAPI-stained nuclei are shown in blue. Scale bar, 100 μm. Values are presented as the means ± SEM.
Fig. 3
Fig. 3. Intravenous injection of the CMV-siRE circuit diminishes tumor formation in orthotopic lung cancer models.
a Flow chart of the experimental design. Nude mice were intravenously injected with LLC cells and analyzed using micro-CT at 30 days post-inoculation to ensure the formation of lung tumors. Next, mice were intravenously injected with PBS or 5 mg/kg CMV-scrR or CMV-siRE circuit or intragastrically administered gefitinib every 2 days for a total of seven injections. Mice were then monitored to evaluate survival time or tumor growth. b Kaplan–Meier survival curves (PBS, n = 11; CMV-scrR, n = 11; gefitinib, n = 8; CMV-siRE, n = 16). c Representative 3-D reconstructions of mouse lungs pre- and post-treatment with genetic circuits or gefitinib. Tumors are shown in maroon to demonstrate their location in the 3-D reconstructions. The entire 3-D reconstructions are shown in Supplementary information, Fig. S19. d A semiautomated quantitative image analysis was performed using 3-D reconstructions of the thoracic cavity to assess the tumor volume pre- and post-treatment with genetic circuits or gefitinib (PBS, CMV-scrR and gefitinib, n = 6; CMV-siRE, n = 12). e Representative H&E-stained lung sections. Scale bar, 200 μm. f Representative EGFR-stained lung sections and quantitative analysis of EGFR levels in lung sections (PBS, CMV-scrR and gefitinib, n = 4; CMV-siRE, n = 5). Scale bar, 75 μm. g Representative proliferating cell nuclearantigen (PCNA)-stained lung sections and quantitative analysis of PCNA levels in lung sections (PBS, CMV-scrR and gefitinib, n = 4; CMV-siRE, n = 5). The tumor cell proliferation rate is indicated by the percentage of PCNA-positive cells. Scale bar, 75 μm. h Western blot analysis of EGFR protein levels in lung tumor samples. Normal mice without tumors were included as negative controls. Left panel, representative western blots. Right panel, quantitative analysis (n = 3 in each group). i Quantitative RT-PCR analysis of EGFR mRNA levels in lung tumor samples (n = 6 in each group). Normal mice without tumors were included as negative controls. Values are presented as the means ± SEM. Significance was determined using one-way ANOVA followed by Dunnett’s multiple comparison in fi. Kaplan–Meier survival analyses were performed in b, and statistical significance was assessed with the log-rank test. *P < 0.05; **P < 0.01; ***P < 0.005; ns, not significant.
Fig. 4
Fig. 4. Intravenous injection of the CMV-siRK circuit diminishes tumor formation in spontaneous lung cancer models.
a Flow chart of the experimental design. The KRASLSL-G12D;p53flfl mice were administered Adeno-Cre and analyzed using micro-CT 50 days post-inhalation to ensure spontaneous tumor formation in the lungs. Mice were then intravenously injected with 5 mg/kg CMV-scrR or CMV-siRK circuit every 2 days for a total of seven injections. Mice were then monitored to evaluate survival time or tumor growth. b Kaplan–Meier survival curves (CMV-scrR, n = 7; CMV-siRK, n = 8). c Representative 3-D reconstructions of mouse lungs pre- and post-treatment with genetic circuits. The entire 3-D reconstructions are shown in Supplementary information, Fig. S22. d, e A semiautomated quantitative image analysis was performed using 3-D reconstructions of the thoracic cavity to assess the tumor number and volume pre- and post-treatment with genetic circuits (CMV-scrR, n = 7; CMV-siRK, n = 8). f Representative H&E-stained lung sections. Scale bar, 1000 μm. g Western blot analysis of KRAS, p-AKT and p-ERK protein levels in the lung tumor samples (n = 4 in each group). Shown are representative western blots. h Quantitation of KRAS, p-AKT and p-ERK protein levels in the lung tumor samples (n = 4 in each group). i Quantitative RT-PCR analysis of KRAS mRNA levels in the lung tumor samples (n = 6 in each group). j Representative images of immunohistochemical staining of KRAS, p-AKT and p-ERK proteins in lung sections. Scale bar, 75 μm. k Quantitative analysis of immunohistochemical staining of KRAS, p-AKT and p-ERK proteins in lung sections (CMV-scrR, n = 3; CMV-siRK, n = 4). Values are presented as the means ± SEM. Significance was determined using two-sided t-test in h, i, k. Kaplan–Meier survival analyses were performed in b, and statistical significance was assessed with the log-rank test. *P < 0.05; **P < 0.01; ***P < 0.005; ns, not significant.
Fig. 5
Fig. 5. Intravenous injection of the CMV-RVG-siRE+T circuit delivers siRNAs to the brain and inhibits tumor growth in a glioblastoma mouse model.
a Schematic presentation of the in vivo assembly and delivery of siRNA by intravenous injection of the composable-core circuit. b The CMV-Flag-scrR, CMV-siRE+T or CMV-Flag-siRE+T circuits were intravenously injected into mice. Plasma exosomes were then either directly loaded for western blotting with anti-Flag and anti-CD63 antibodies (middle and bottom lanes) or immunoprecipitated with IgG or anti-Flag beads before western blotting (upper lane). A quantitative RT-PCR assay was performed to assess the levels of EGFR and TNC siRNAs in immunoprecipitated exosomes (n = 3 in each group). c The levels of EGFR and TNC siRNAs in mouse brain, spleen, lung and kidney tissues after intravenous injection of PBS or 5 mg/kg CMV-scrR, CMV-siRE+T or CMV-RVG-siRE+T circuit (n = 3 in each group). d Representative fluorescence microscopy images showing eGFP levels in frozen sections of brain obtained from eGFP-transgenic mice after intravenous injection of PBS, 5 mg/kg CMV-siRG circuit or CMV-RVG-siRG circuit for seven times. Positive eGFP signals are shown in green, and DAPI-stained nuclei are shown in blue. Scale bar, 100 μm. e Flow chart of the experimental design. Nude mice were intracranially implanted with bioluminescent U87MG-Luc cells and analyzed using BLI on day 7 post-implantation to ensure glioblastoma formation in the brain. Mice were then intravenously injected with PBS or 5 mg/kg CMV-scrR, CMV-RVG-siRE or CMV-RVG-siRE+T circuit for a total of seven times over 2 weeks. Mice were then either monitored for survival analysis or sacrificed for evaluation of tumor growth. f Kaplan–Meier survival curves (PBS, n = 7; CMV-scrR, n = 6; CMV-RVG-siRE, n = 7; CMV-RVG-siRE+T, n = 15). g BLI images of glioblastoma sizes in representative mice. h Quantification of glioblastoma sizes (PBS, n = 7; CMV-scrR, n = 8; CMV-RVG-siRE, n = 6; CMV-RVG-siRE+T, n = 11). i The levels of EGFR and TNC siRNAs in glioblastoma samples (n = 4 in each group). j Western blot analysis of EGFR and TNC protein levels in glioblastoma samples. Upper panel, representative western blots. lower panel, quantitative analysis (n = 4 in each group). Values are presented as the means ± SEM. Significance was determined using one-way ANOVA followed by Dunnett’s multiple comparison in h, j. Kaplan–Meier survival analyses were performed in f, and statistical significance was assessed with the log-rank test. *P < 0.05; **P < 0.01; ***P < 0.005; ns, not significant.
Fig. 6
Fig. 6. Intravenous injection of the CMV-RVG-siRP circuit restores leptin and insulin sensitivity, decreases adiposity and increases energy expenditure in a mouse model of obesity.
a Flow chart of the experimental design. Male C57BL/6J mice at 3 weeks of age were placed on a HFD for 12 weeks. Mice rapidly gained weight and became obese. Mice were then maintained on a HFD and treated with PBS or 5 mg/kg CMV-scrR, CMV-siRP or CMV-RVG-siRP circuit through tail vein injection for a total of 12 times over 24 days. Body weights were monitored during treatment. After treatment, mice were divided into several groups and subjected to the evaluation of fat mass, energy expenditure, leptin sensitivity and glucose homoeostasis. b Body weight curves (n = 14 in each group). c Weights of epididymal fat pads (n = 14 in each group). dk Energy expenditure parameters, including oxygen consumption (VO2), respiratory exchange ratio (RER), total activity and heat production, were monitored (n = 3 in each group). l, m Weight loss and food intake inhibition in response to leptin. Male mice were injected with leptin (0.5 μg/g body weight every 12 h) for the indicated periods. Food intake and body weight were monitored 2 days prior to the start of injection and normalized to 100% for day 0 values (n = 6 in each group). n Basal serum leptin levels (n = 6 in each group). o Western blot analysis of PTP1B in the hypothalamus. Mice were injected with or without leptin (to stimulate leptin signalling), and hypothalamus was collected for immunoblot analysis of PTP1B (n = 3 in each group). SSG (200 mg/kg i.p. dose) serves as a control. Shown are representative western blots. p Mouse GTT results (n = 8 in each group). q Mouse ITT results. Blood glucose values are expressed as the percentage of the initial concentration (n = 8 in each group). r Western blot analysis of PTP1B and tyrosine phosphorylation of insulin receptors in the liver. Mice were injected with or without insulin (to stimulate insulin signalling), and liver was collected for immunoblot analysis with antibodies against PTP1B, p-IR (Tyr1162/Tyr1163) or total IR (n = 3 in each group). SSG (200 mg/kg i.p. dose) serves as a control. Shown are representative western blots. Values are presented as the means ± SEM. Significance was determined using one-way ANOVA followed by Dunnett’s multiple comparison in c, e, g, i, kn, and using two-way ANOVA followed by Dunnett’s multiple comparison in b, l, m, p, q. *P < 0.05; **P < 0.01; ***P < 0.005; ns, not significant.

References

    1. Ichim TE, et al. RNA interference: a potent tool for gene-specific therapeutics. Am. J. Transplant. 2004;4:1227–1236. - PMC - PubMed
    1. Bobbin ML, Rossi JJ. RNA interference (RNAi)-based therapeutics: delivering on the promise? Ann. Rev. Pharmacol. Toxicol. 2016;56:103–122. - PubMed
    1. Davidson BL, McCray PB., Jr. Current prospects for RNA interference-based therapies. Nat. Rev. Genet. 2011;12:329–340. - PMC - PubMed
    1. Singh A, Trivedi P, Jain NK. Advances in siRNA delivery in cancer therapy. Artif. Cells Nanomed. Biotechnol. 2018;46:274–283. - PubMed
    1. Nair JK, et al. Multivalent N-acetylgalactosamine-conjugated siRNA localizes in hepatocytes and elicits robust RNAi-mediated gene silencing. J. Am. Chem. Soc. 2014;136:16958–16961. - PubMed

Publication types

Substances