. 2021 Mar 29;4(1):425.
doi: 10.1038/s42003-021-01880-1.

Sensitive quantification of carbon monoxide in vivo reveals a protective role of circulating hemoglobin in CO intoxication

Affiliations

Sensitive quantification of carbon monoxide in vivo reveals a protective role of circulating hemoglobin in CO intoxication

Qiyue Mao et al. Commun Biol. .

Abstract

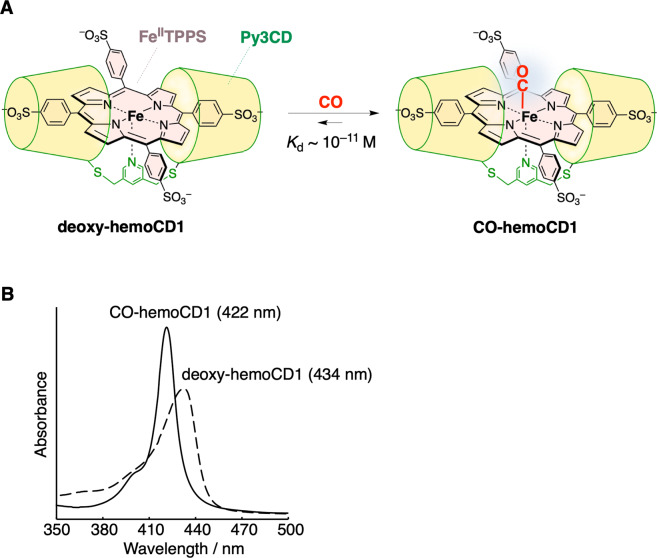
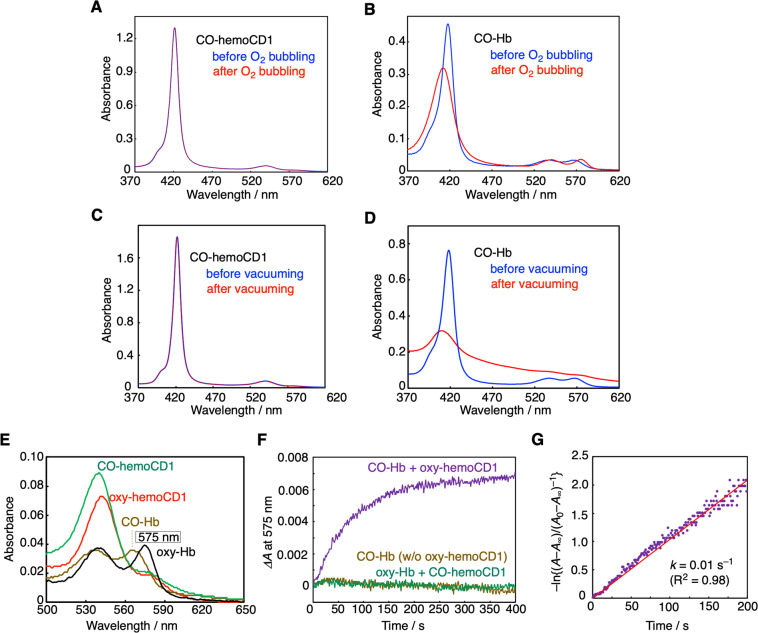
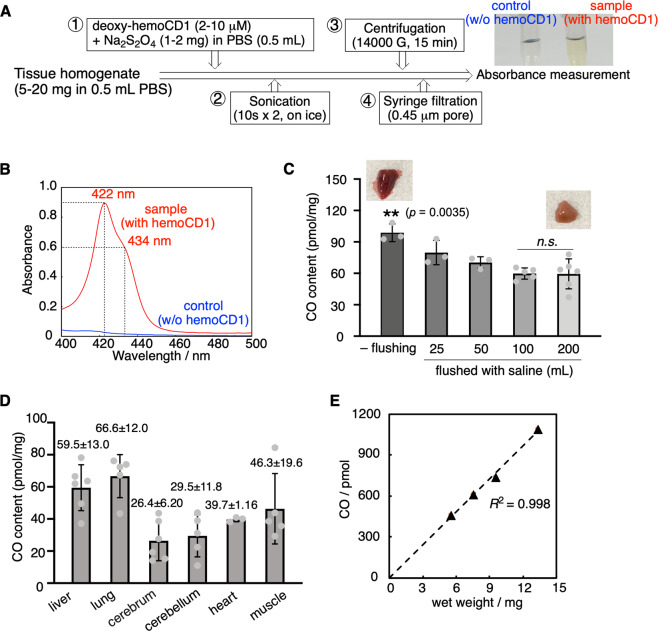
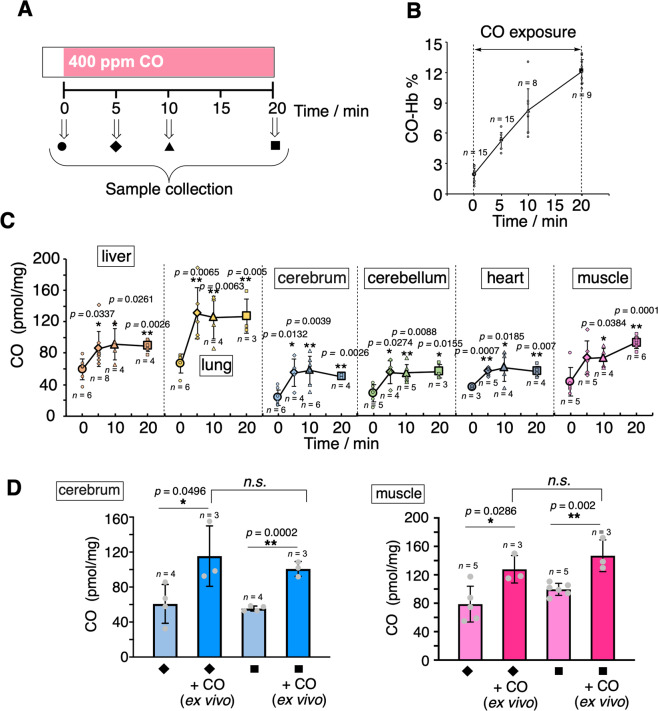
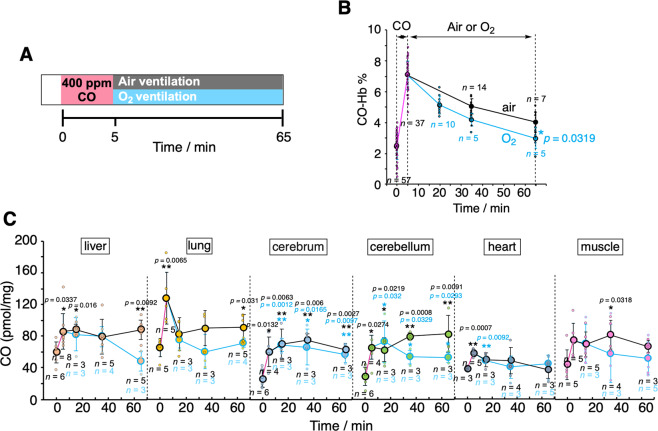
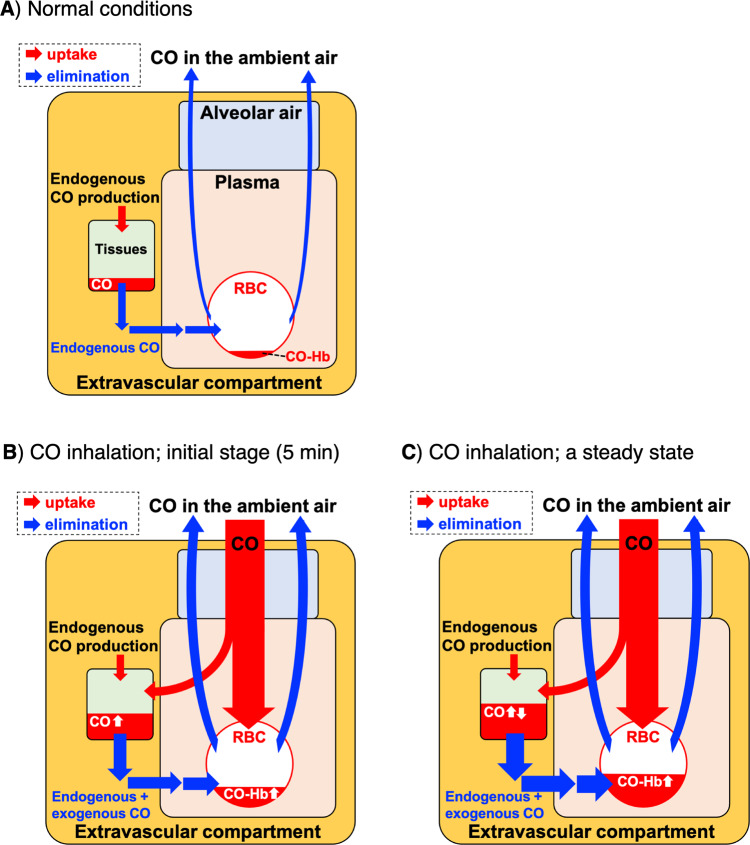
Carbon monoxide (CO) is a gaseous molecule known as the silent killer. It is widely believed that an increase in blood carboxyhemoglobin (CO-Hb) is the best biomarker to define CO intoxication, while the fact that CO accumulation in tissues is the most likely direct cause of mortality is less investigated. There is no reliable method other than gas chromatography to accurately determine CO content in tissues. Here we report the properties and usage of hemoCD1, a synthetic supramolecular compound composed of an iron(II)porphyrin and a cyclodextrin dimer, as an accessible reagent for a simple colorimetric assay to quantify CO in biological samples. The assay was validated in various organ tissues collected from rats under normal conditions and after exposure to CO. The kinetic profile of CO in blood and tissues after CO treatment suggested that CO accumulation in tissues is prevented by circulating Hb, revealing a protective role of Hb in CO intoxication. Furthermore, hemoCD1 was used in vivo as a CO removal agent, showing that it acts as an effective adjuvant to O2 ventilation to eliminate residual CO accumulated in organs, including the brain. These findings open new therapeutic perspectives to counteract the toxicity associated with CO poisoning.


Conflict of interest statement

The authors declare no competing interests.

Figures

Fig. 1
Fig. 1. HemoCD1, a CO detecting agent.
A HemoCD1 is composed of 5,10,15,20-tetrakis(4-sulfonatophenyl)porphinatoiron(II) (FeIITPPS) and a per-O-methyl-β-cyclodextrin dimer having a pyridine linker (Py3CD). The structure of deoxy-hemoCD1 and CO-hemoCD1 complexes is shown. B UV–vis spectra of hemoCD1 showing the Soret bands typical of deoxy-hemoCD1 (434 nm) and CO-hemoCD1 (422 nm) in PBS at pH 7.4 and 25 °C.
Fig. 2
Fig. 2. Characteristics of hemoCD1 as a CO scavenger.
UV–vis spectra of CO-hemoCD1 (3.5 μM, A) and CO-Hb (2.3 μM, B) in PBS at pH 7.4 and 25 °C before (blue) and after (red) bubbling O2 into the solutions for 5 min. CO-Hb was converted to its O2-bound form (oxy-Hb, red line) whereas CO-hemoCD1 was not. UV–vis spectra of CO-hemoCD1 (5.0 μM, C) and CO-Hb (3.7 μM, D) before (blue) and after (red) vacuuming under 10 Torr for 2 h followed by re-solubilization of the residues. CO-hemoCD1 was stable while CO-Hb decomposed after this treatment. EG Competition between hemoCD1 and Hb for CO binding. E UV–vis spectra of oxy-, and CO-hemoCD1 (5.0 μM each), and oxy- (575 nm absorbance peak) and CO-Hb (2.4 μM each). F Time-course for changes in absorbance at 575 nm, indicative of formation of oxy-Hb, after mixing stock solutions of oxy-hemoCD1 (0.75 mM, 20 μl in air-saturated PBS) and CO-Hb (0.72 mM, 10 μl in CO-saturated PBS) in air-saturated PBS (3 ml) at pH 7.4 and 25 °C. Controls are represented by solutions of CO-Hb without (w/o) oxy-hemoCD1, and oxy-Hb mixed with CO-hemoCD1. G First-order rate plot for changes in absorbance at 575 nm over time. The linear regression analysis gave a rate constant of k = 0.01 s−1.
Fig. 3
Fig. 3. Spectroscopic quantification of CO in aqueous solution using hemoCD1.
A UV–vis spectra of hemoCD1 (6.0 μM) after exposure to various amounts of CO in PBS (1 ml) at pH 7.4 and 25 °C. RCO values were calculated using Eq. (1). B The plot of known amounts of CO dissolved in water versus the quantified values of CO determined by the hemoCD1 assay. Data are shown as mean ± SD (n = 3).
Fig. 4
Fig. 4. Quantification of CO in rat tissues.
A Experimental procedure describing the various steps of the hemoCD1 assay for measuring CO in tissue samples collected from different rat organs. The picture shows clear supernatant solutions of tissue sonicates without (control) and with deoxy-hemoCD1. B Typical representative spectra of supernatant solutions of liver sample and control obtained at the end of the hemoCD1 assay. C Amounts of CO quantified in liver tissues without (–) or following flushing with 25–200 ml saline. Each bar represents the mean ± SD (n = 3–6). Statistical significance, **p < 0.01 versus 200 ml flushed organs; n.s. not significant. D Content of endogenous CO (pmol/mg, wet weight) detected in different organs using the hemoCD1 assay. Each bar represents the mean ± SD (n = 6 for liver, n = 5 for lung, n = 6 for cerebrum, n = 5 for cerebellum, n = 3 for heart, and n = 5 for muscle). E Plot of the wet weight of liver tissue versus the amount of CO detected.
Fig. 5
Fig. 5. Kinetic studies of CO levels in blood and tissues after exposure to CO in rats.
A Anesthetized rats were exposed to CO inhalation (400 ppm) and samples collected at different times as shown. B Changes in CO-Hb (%) in the venous blood collected from right ventricles as a function of time. C Tissue CO contents as a function of time. Each plot represents the mean ± SD (n = 3–6, the number of experiments is shown in the panel). Statistical significance, *p < 0.05, **p < 0.01 versus t = 0. D Amount of CO in muscle and cerebrum before and after purging CO gas ex vivo. Samples collected at 5 or 20 min were placed under CO atmosphere for 1 h and then assayed for CO content. Each bar represents the mean ± SD (n = 3–5, the number of experiments is shown in the panel). Statistical significance, *p < 0.05, **p < 0.01; n.s. not significant.
Fig. 6
Fig. 6. Effect of normobaric air/O2 ventilation on CO levels in blood and tissues after exposure to CO in rats.
A Anesthetized rats were exposed to CO inhalation (400 ppm) for 5 min followed by either air (black) or O2 ventilation (blue) as indicated. B Changes in CO-Hb (%) in the venous blood collected from right ventricles as a function of time. Each plot represents mean ± SD (n > 5, the number of experiments is shown in the panel). Statistical significance, *p < 0.05, versus air ventilation. C Amounts of CO measured under the experimental conditions described in A. The plots connected by black and blue lines represent the data obtained under air and O2 ventilation, respectively. Each bar represents mean ± SD (n > 3, the number of experiments is shown in the panel). Statistical significance, *p < 0.05, **p < 0.01; n.s. not significant versus t = 0.
Fig. 7
Fig. 7. Effect of normobaric air/O2 ventilation in combination with hemoCD1 injection on CO levels in blood and tissues after exposure to exogenous CO in rats.
A Anesthetized rats were exposed to CO inhalation (400 ppm) for 5 min followed by either air or pure O2 ventilation in combination with intravenous hemoCD1 infusion (1.4 ± 0.2 mM, 2.5 ml in PBS) as indicated by the three different protocols: I, oxy-hemoCD1 was infused for 30 min under room air ventilation; II: oxy-hemoCD1 was infused for 15 min under pure O2 ventilation; III: O2 ventilation was conducted for 30 min before infusion of oxy-hemoCD1 for 15 min. The right panels show the changes in CO-Hb (%) of the blood and the CO levels detected in the cerebrum and cerebellum samples collected as indicated. B Anesthetized rats were exposed to CO inhalation (400 ppm) for 80 min followed by O2 ventilation in combination with intravenous hemoCD1 infusion (3.0 ± 0.2 mM, 2.5 ml in PBS) as indicated by the two different protocols: IV, oxy-hemoCD1 was infused for 15 min under pure O2 ventilation; V: O2 ventilation was conducted for 30 min before infusion of oxy-hemoCD1 for 15 min. The right panels show the changes in CO-Hb (%) in the blood and the CO levels detected in the cerebrum and cerebellum samples collected as indicated. Each plot for CO-Hb (%) represents mean ± SD (n > 3, the numbers of experiments are shown in the panels). Each bar for CO (pmol/mg) represents the mean ± SD (n > 3, the numbers of experiments are shown in the panels). Statistical significance, *p < 0.05, **p < 0.01; n.s. not significant versus t0.
Fig. 8
Fig. 8. Proposed mechanism of CO compartmentalization under normal conditions and during CO inhalation.
A Normal conditions. Endogenous CO continuously produced in cells is stored in tissues, diffuses to Hb, and is exhaled. B Initial stage of CO inhalation. Inhaled CO forms CO-Hb in RBC and diffused to tissues. C A steady state during CO inhalation. CO accumulated in tissues gradually transfers to Hb in RBC based on the higher CO affinity of Hb versus intracellular CO targets (see Table 1 and text for details). The compartment models are based on our data and Refs. ,.

References

    1. Dydek, T. M. Investigating carbon monoxide poisonings. In Carbon Monoxide Poisoning (ed. Penney, D. G.) Ch. 12 (CRC and Taylor and Francis Press, 2007).
    1. Motterlini R, Foresti R. Biological signaling by carbon monoxide and carbon monoxide-releasing molecules. Am. J. Physiol. Cell Physiol. 2017;312:C302–C313. doi: 10.1152/ajpcell.00360.2016. - DOI - PubMed
    1. Shimizu T, et al. Gaseous O2, NO, and CO in signal transduction: Structure and function relationships of heme-based gas sensors and heme-redox sensors. Chem. Rev. 2015;115:6491–6533. doi: 10.1021/acs.chemrev.5b00018. - DOI - PubMed
    1. Szabo C. Gasotransmitters in cancer: from pathphysiology to experimental therapy. Nat. Rev. Drug Discov. 2016;15:185–203. doi: 10.1038/nrd.2015.1. - DOI - PMC - PubMed
    1. Fukuto JM, et al. Small molecule signaling agents: the integrated chemistry and biochemistry of nitrogen oxides, oxides of carbon, dioxygen, hydrogen sulfide, and their derived species. Chem. Res. Toxicol. 2012;25:769–793. doi: 10.1021/tx2005234. - DOI - PMC - PubMed

Publication types

Substances