. 2021 Apr;53(4):521-528.
doi: 10.1038/s41588-021-00812-3. Epub 2021 Mar 29.

Ultraconserved enhancer function does not require perfect sequence conservation

Affiliations

Ultraconserved enhancer function does not require perfect sequence conservation

Valentina Snetkova et al. Nat Genet. 2021 Apr.

Abstract

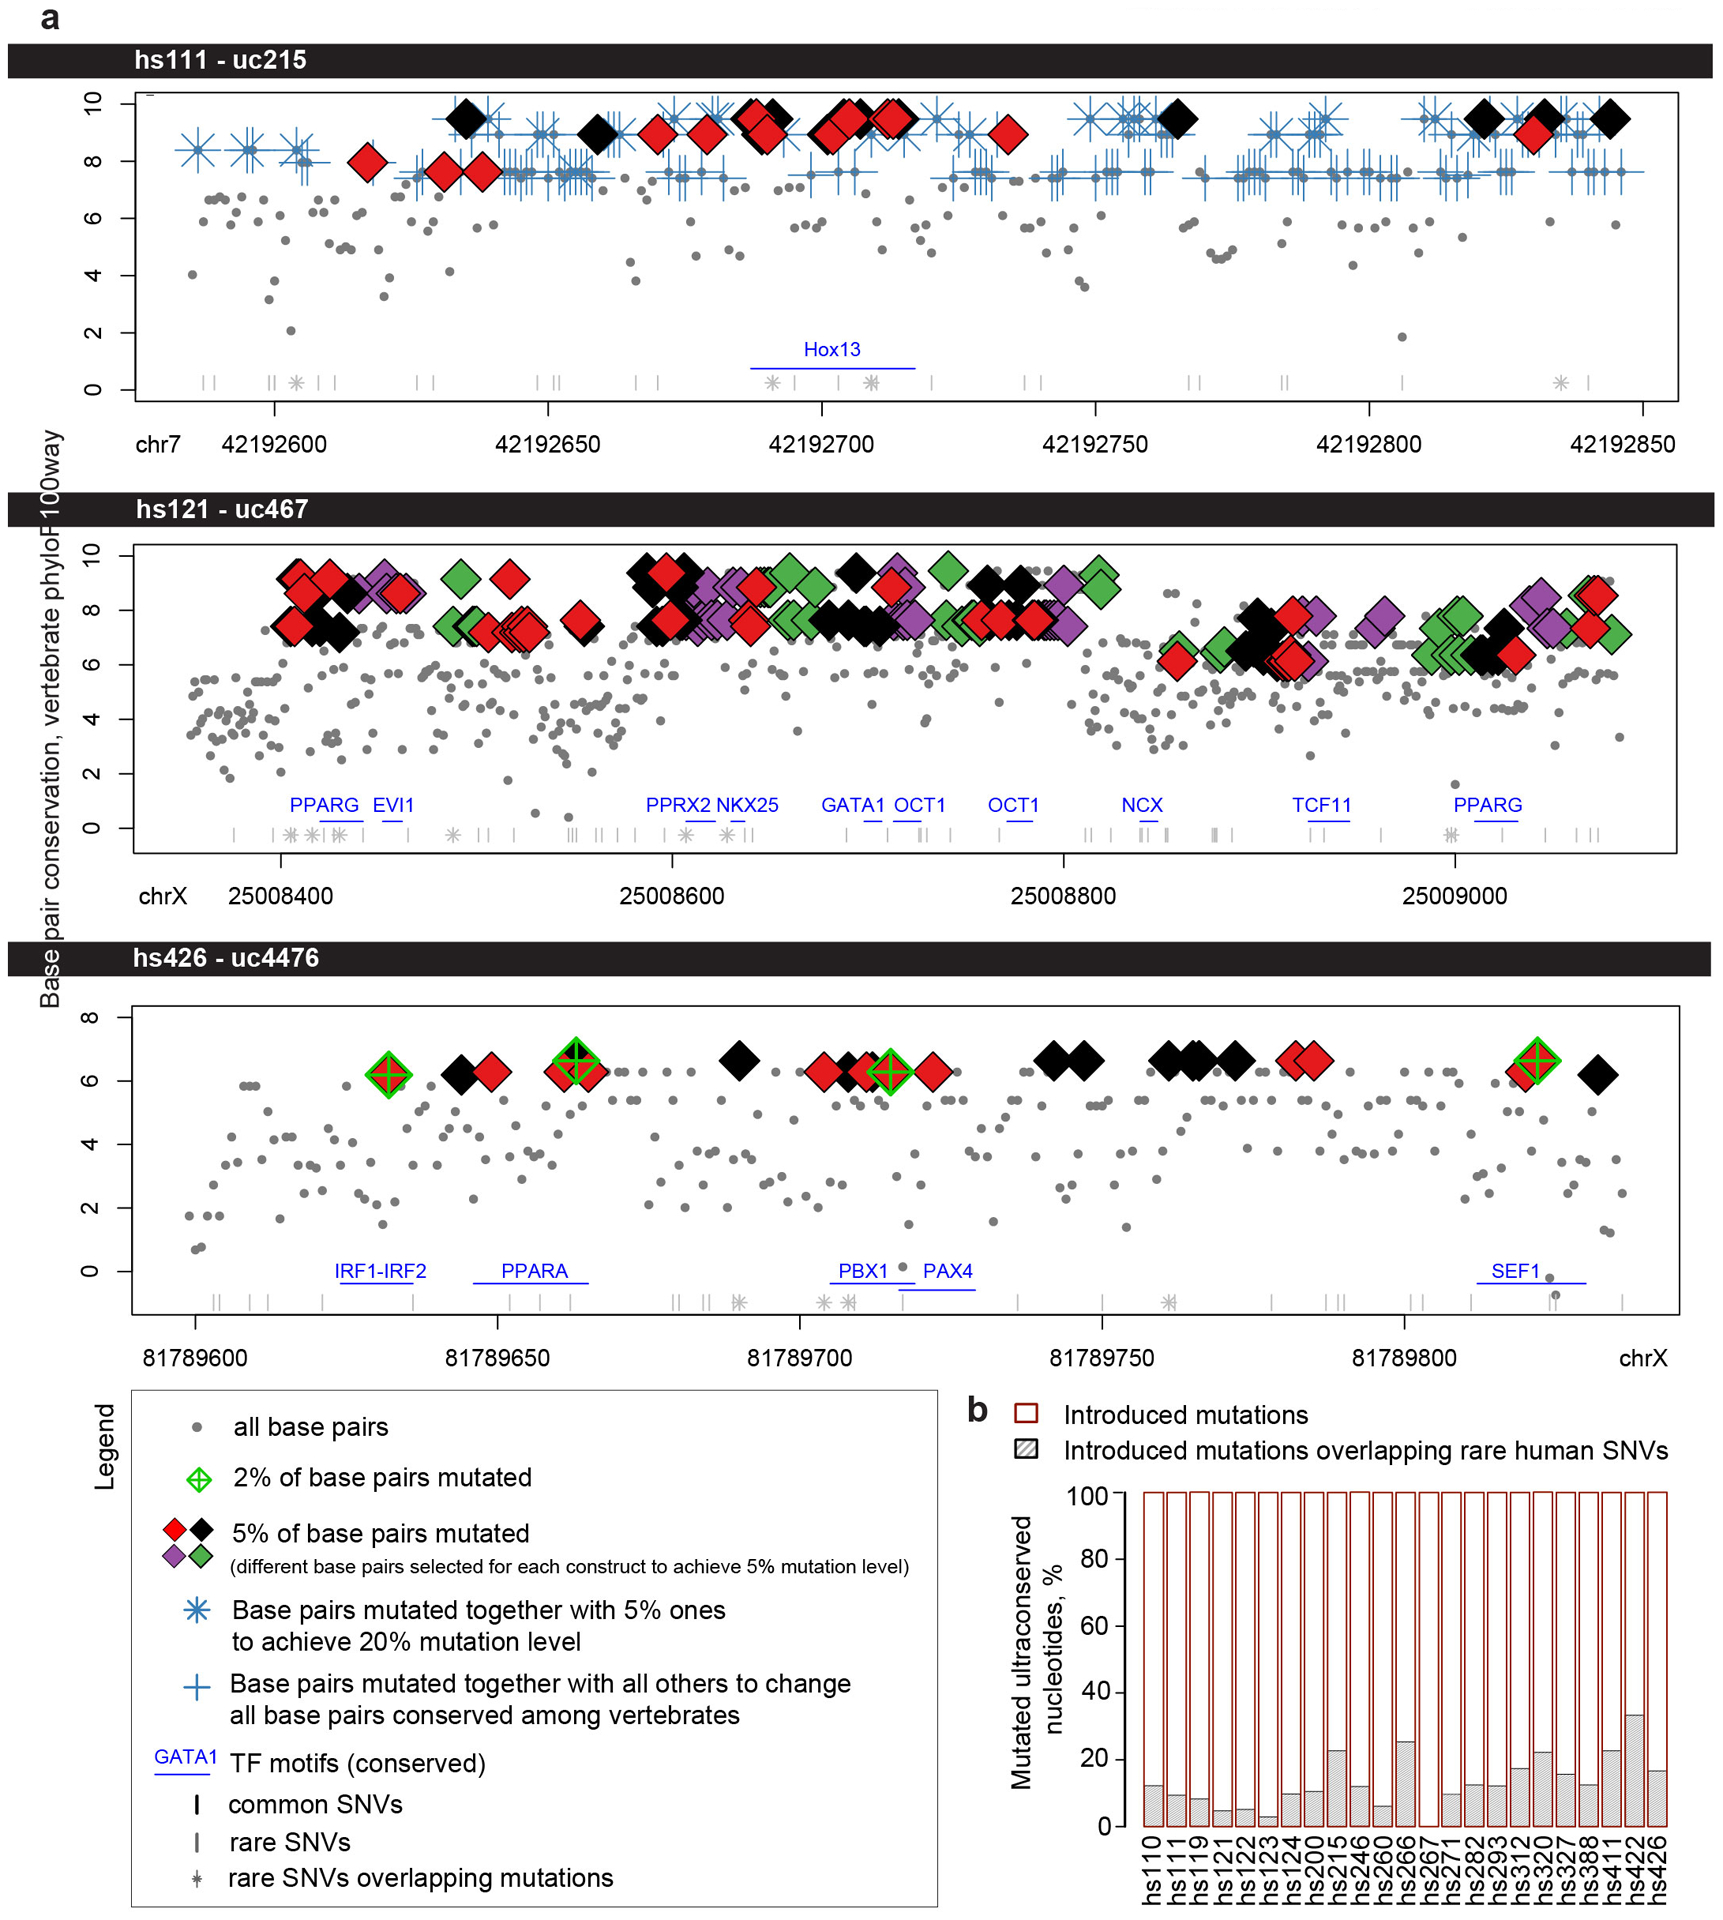
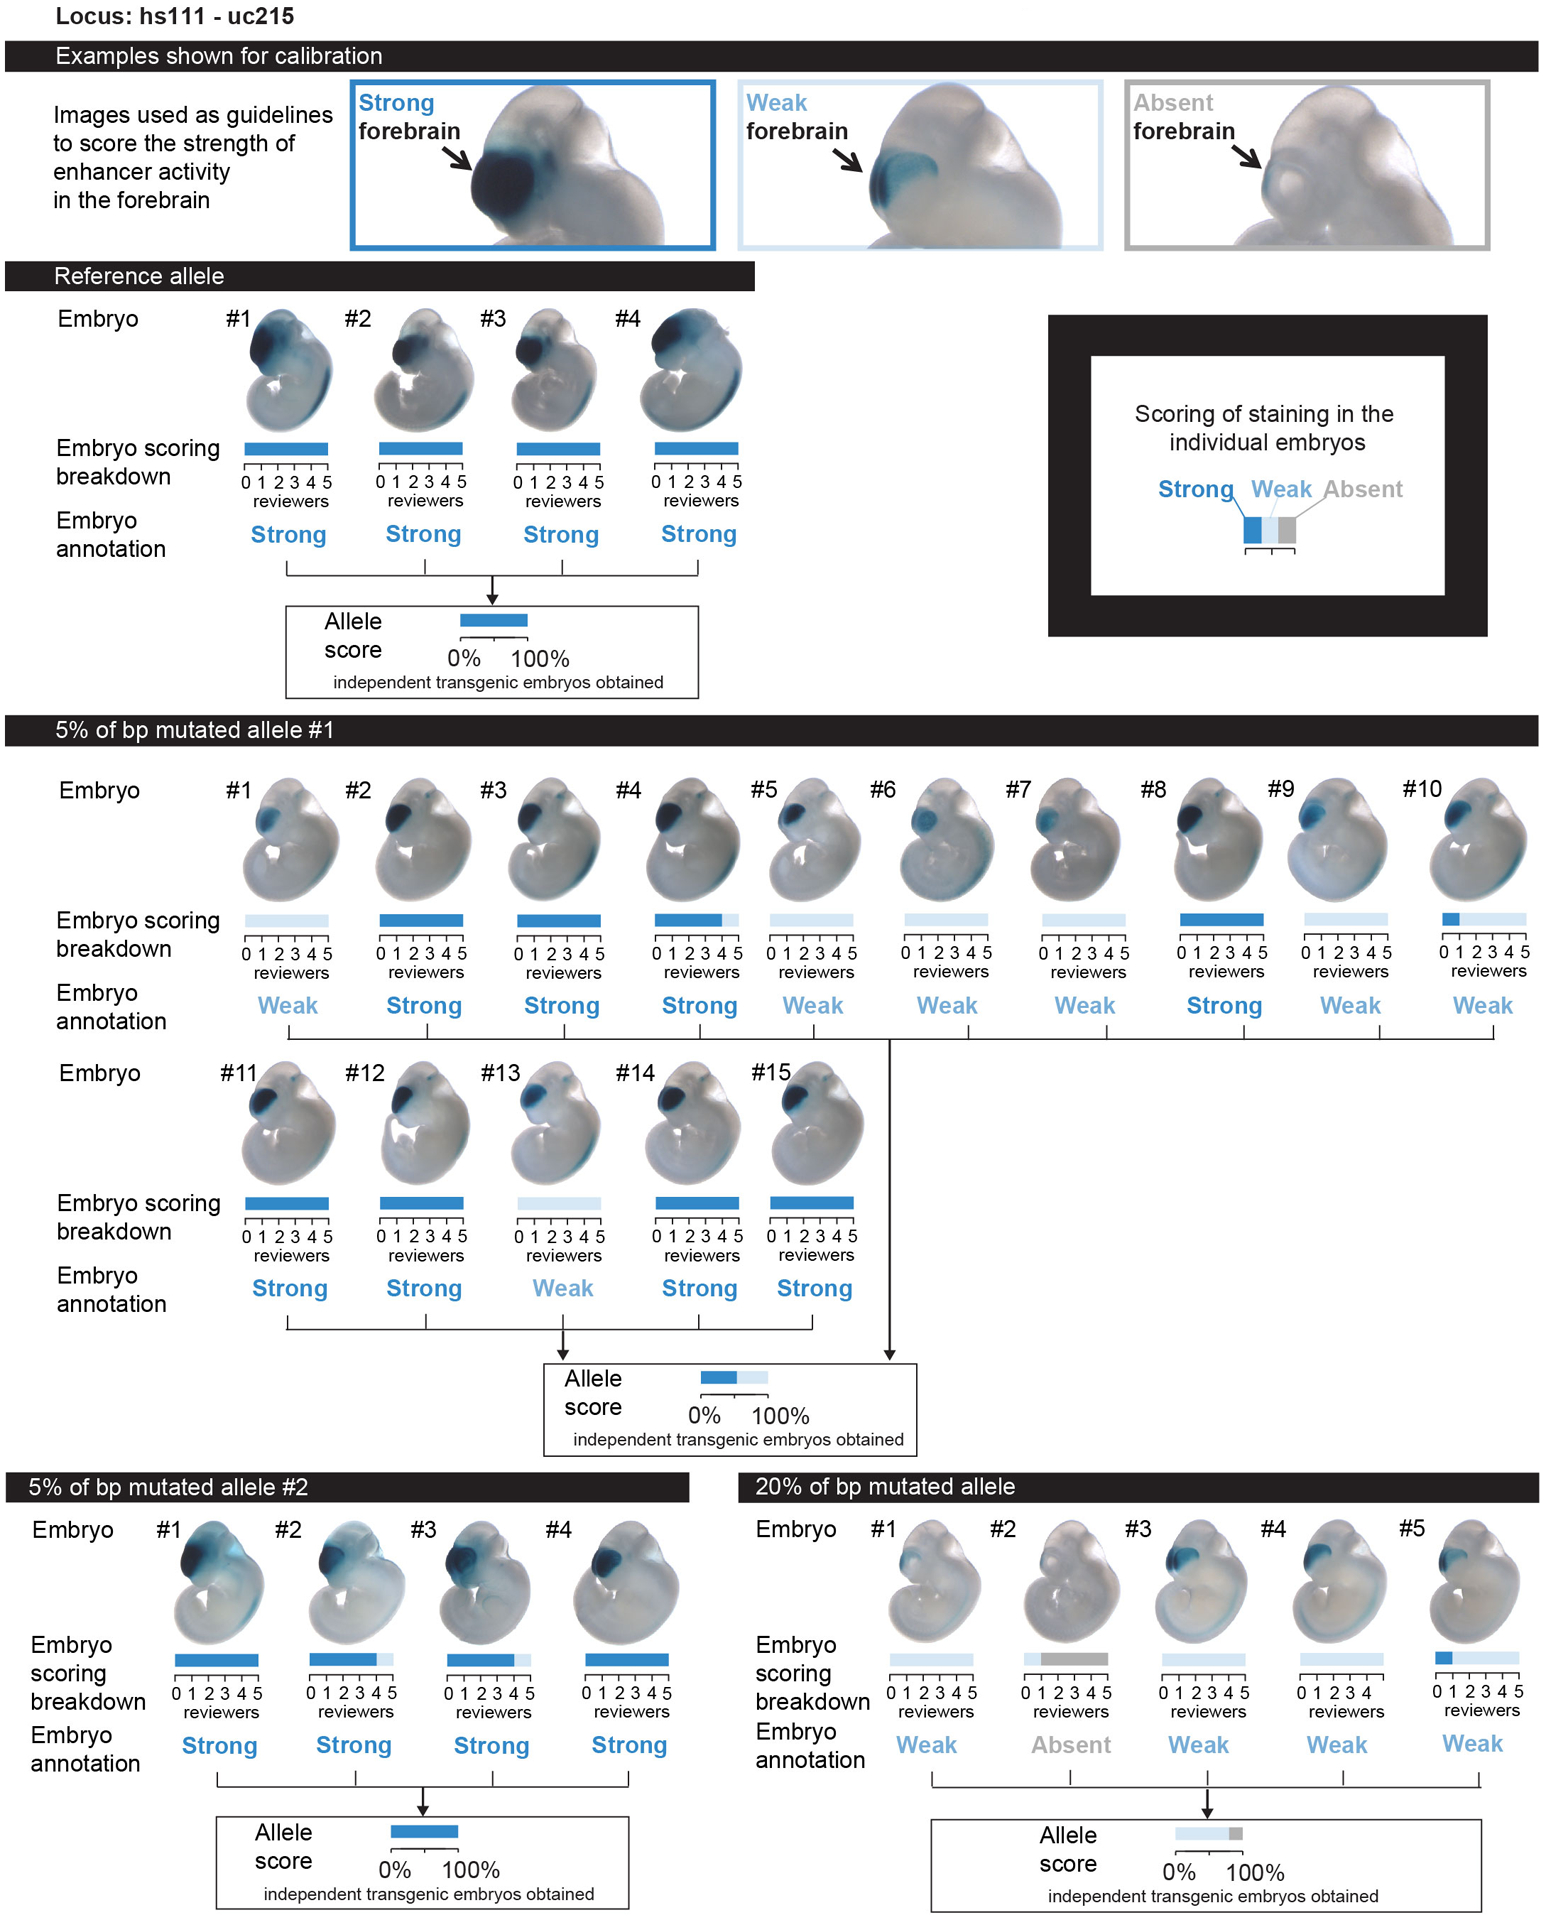
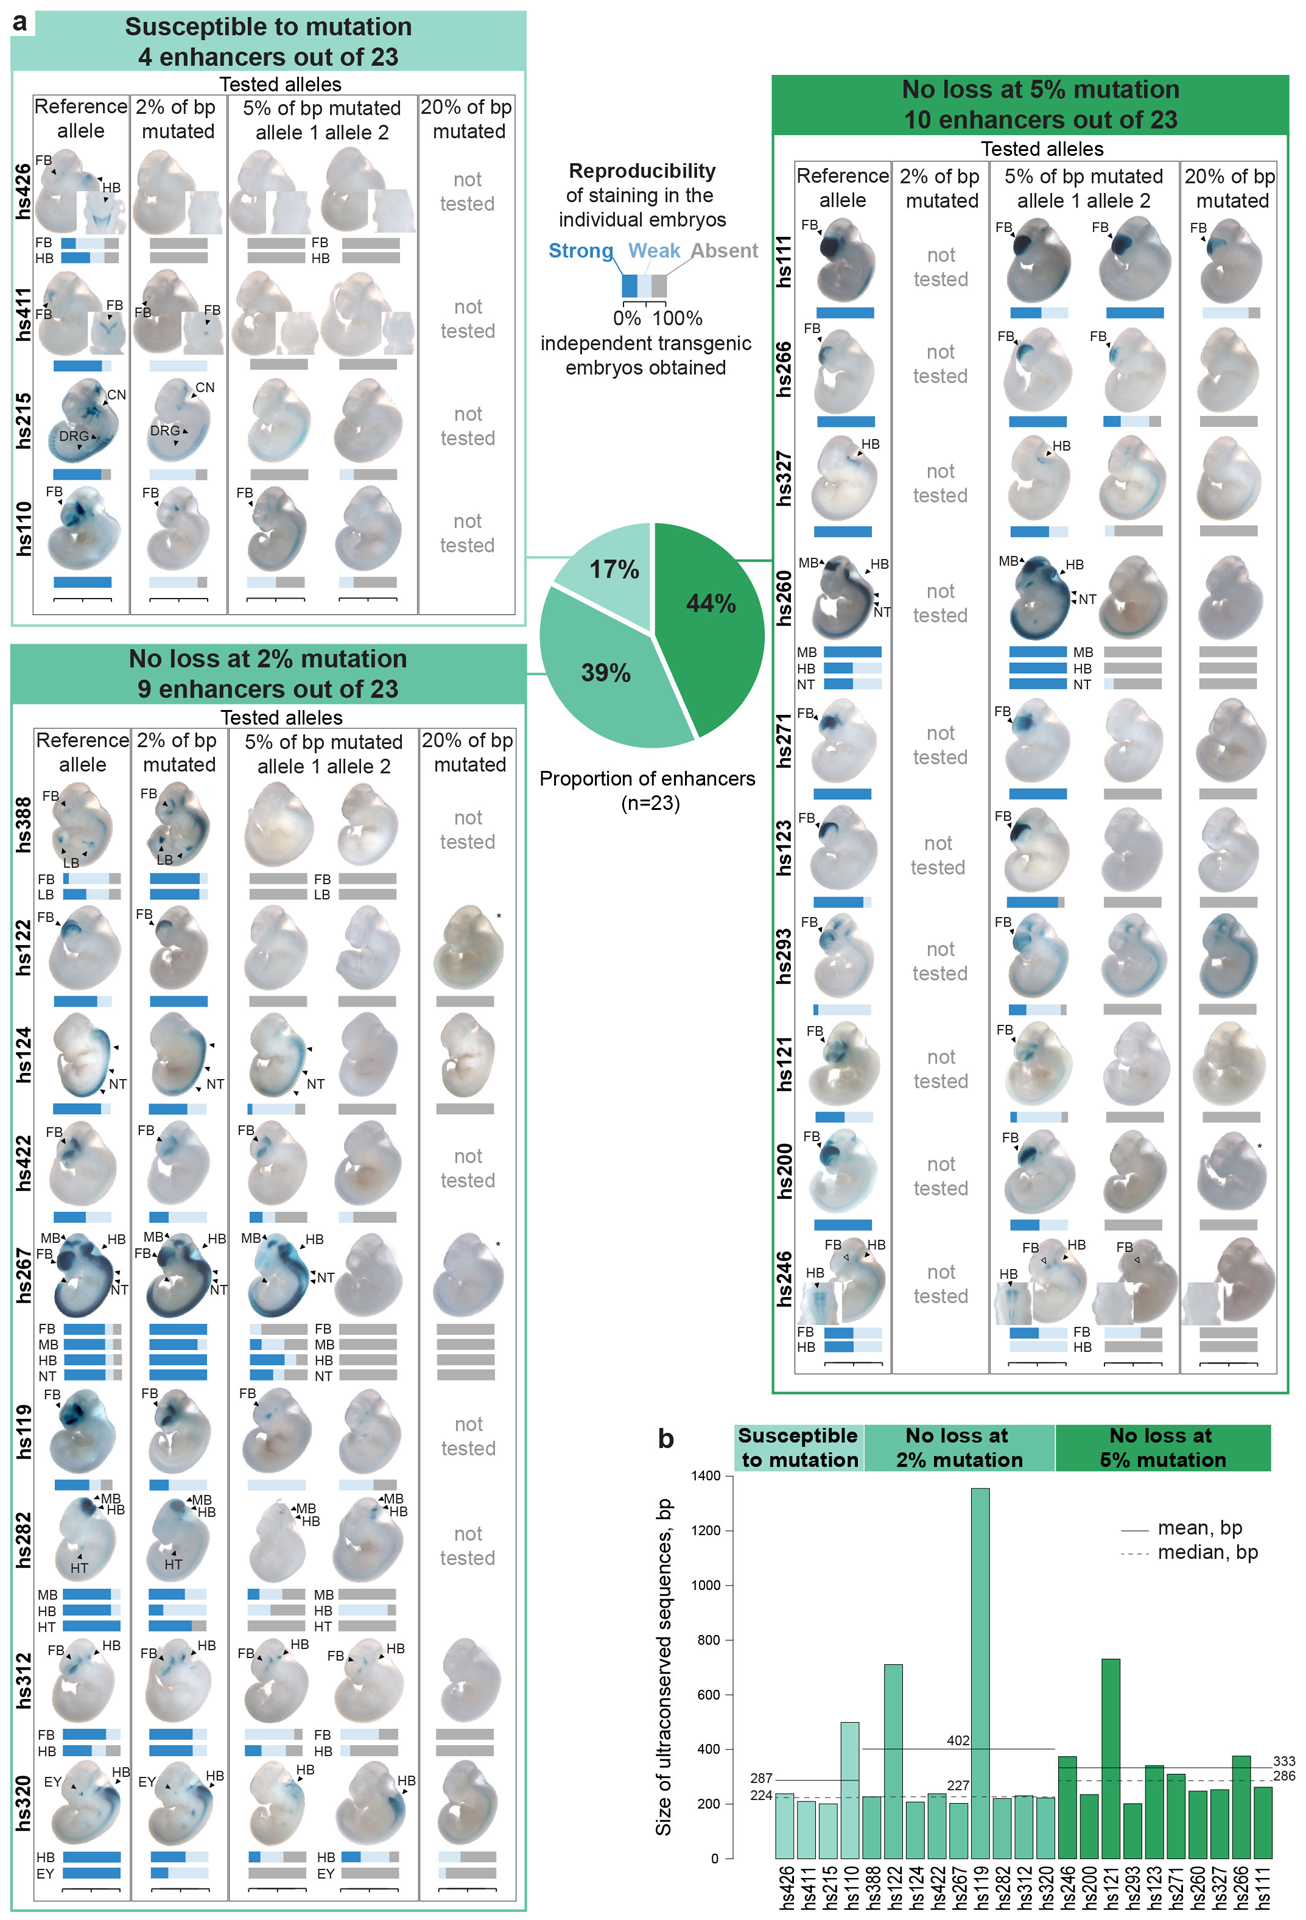
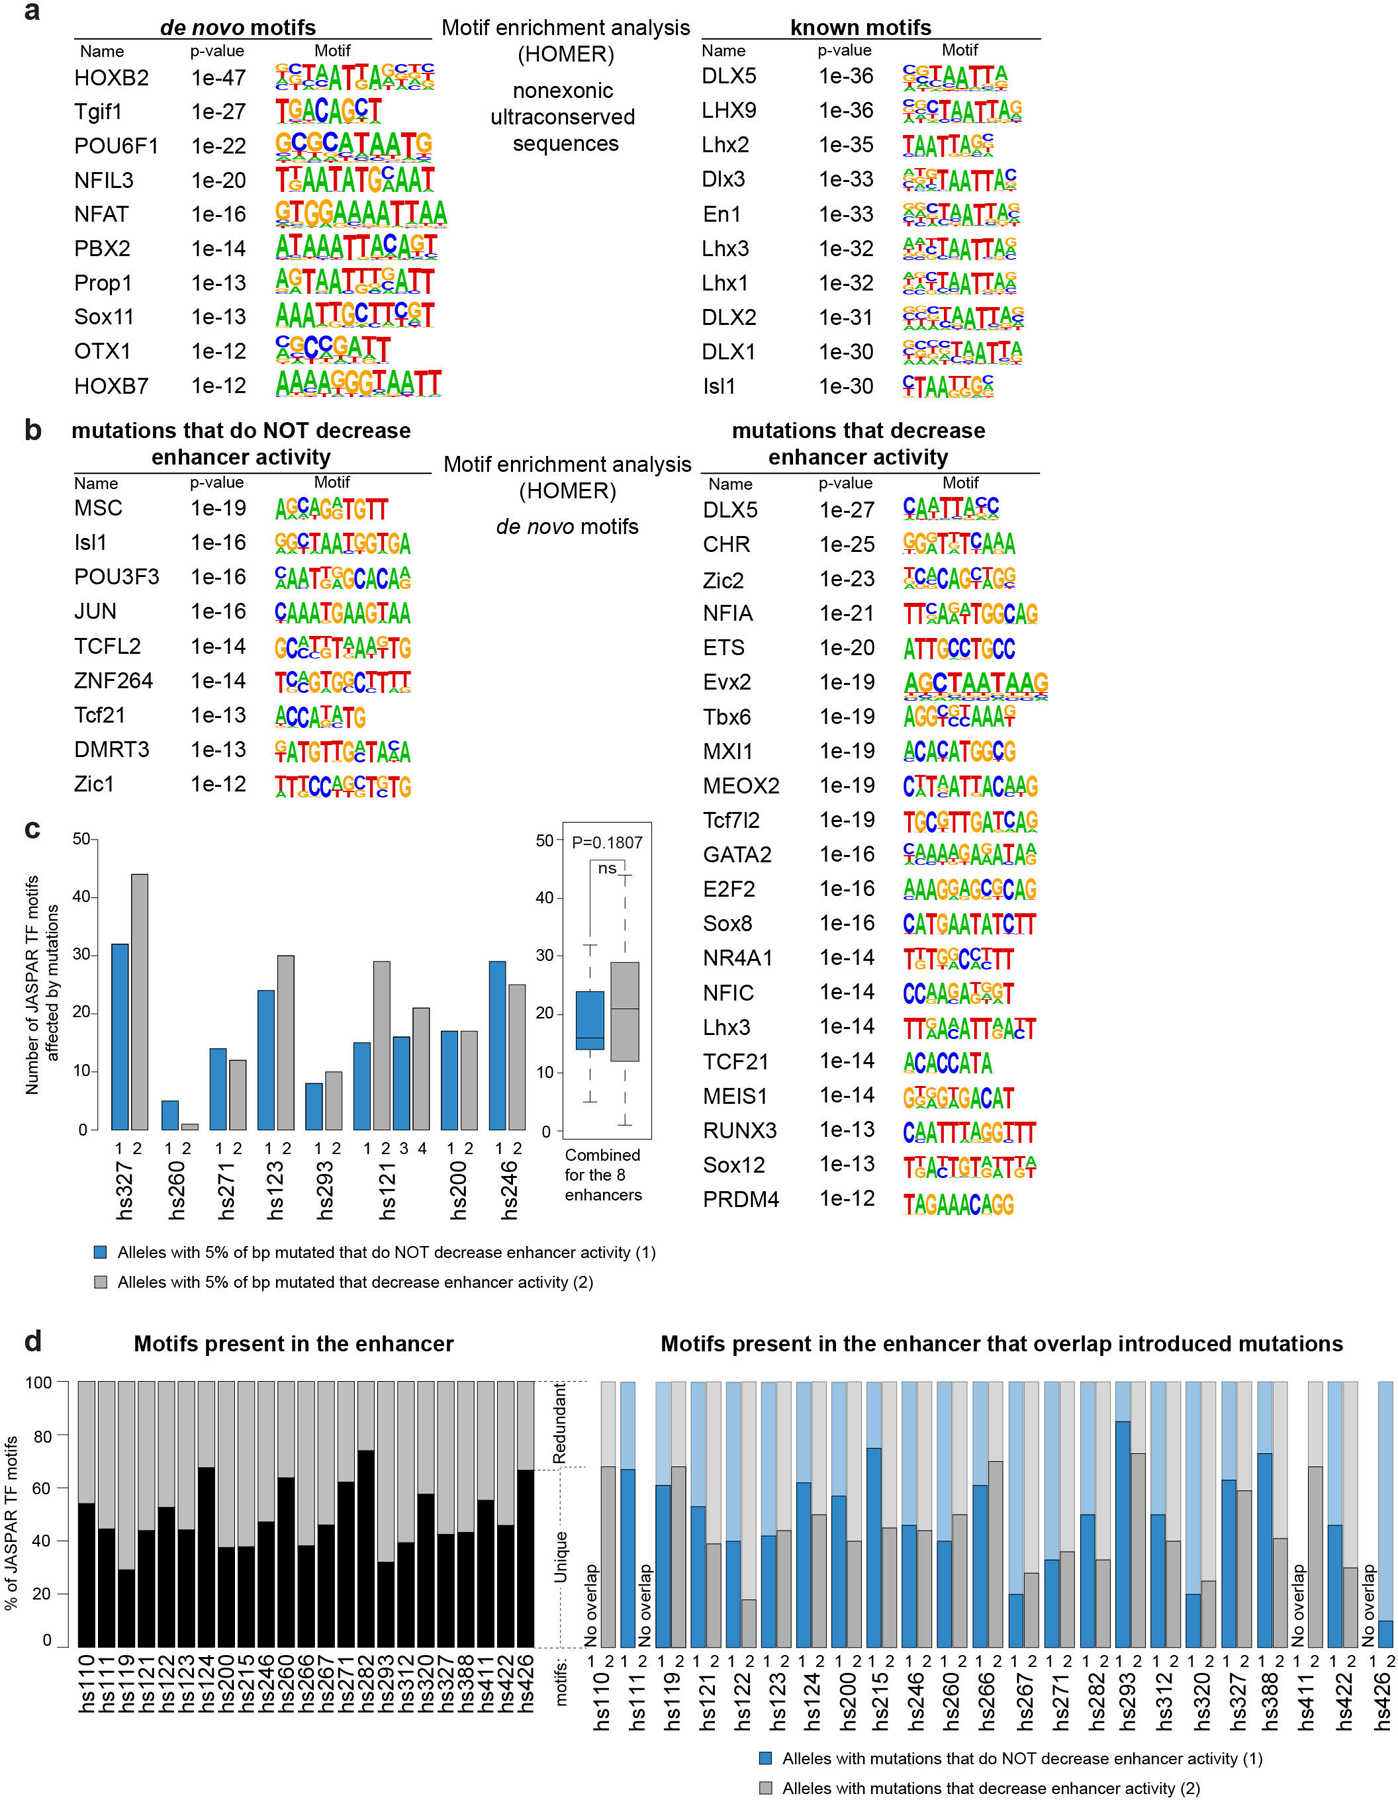
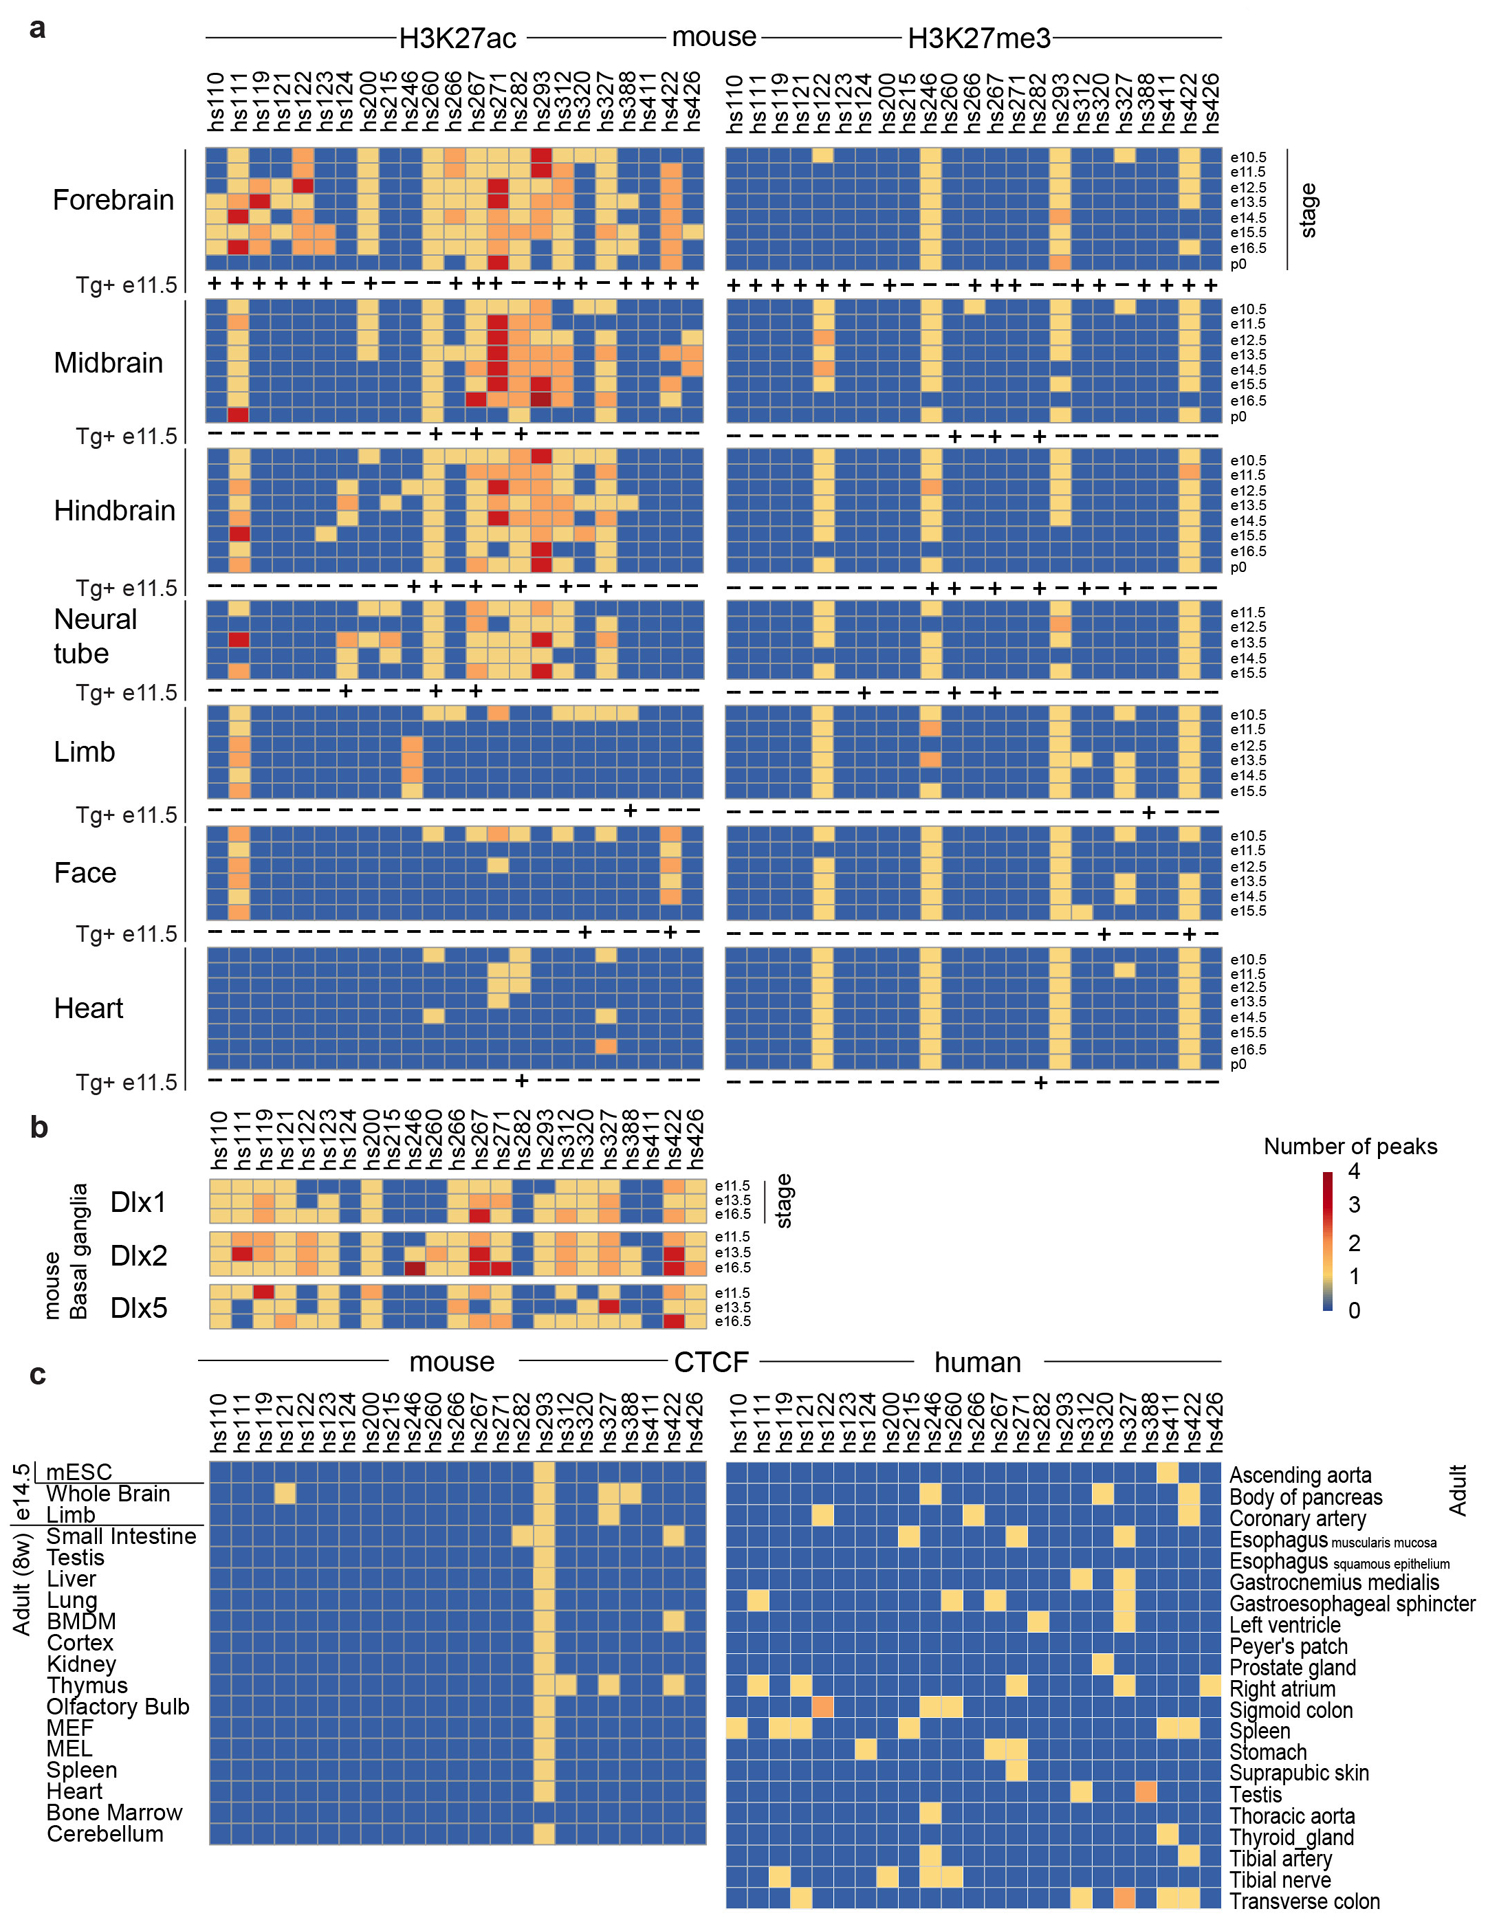
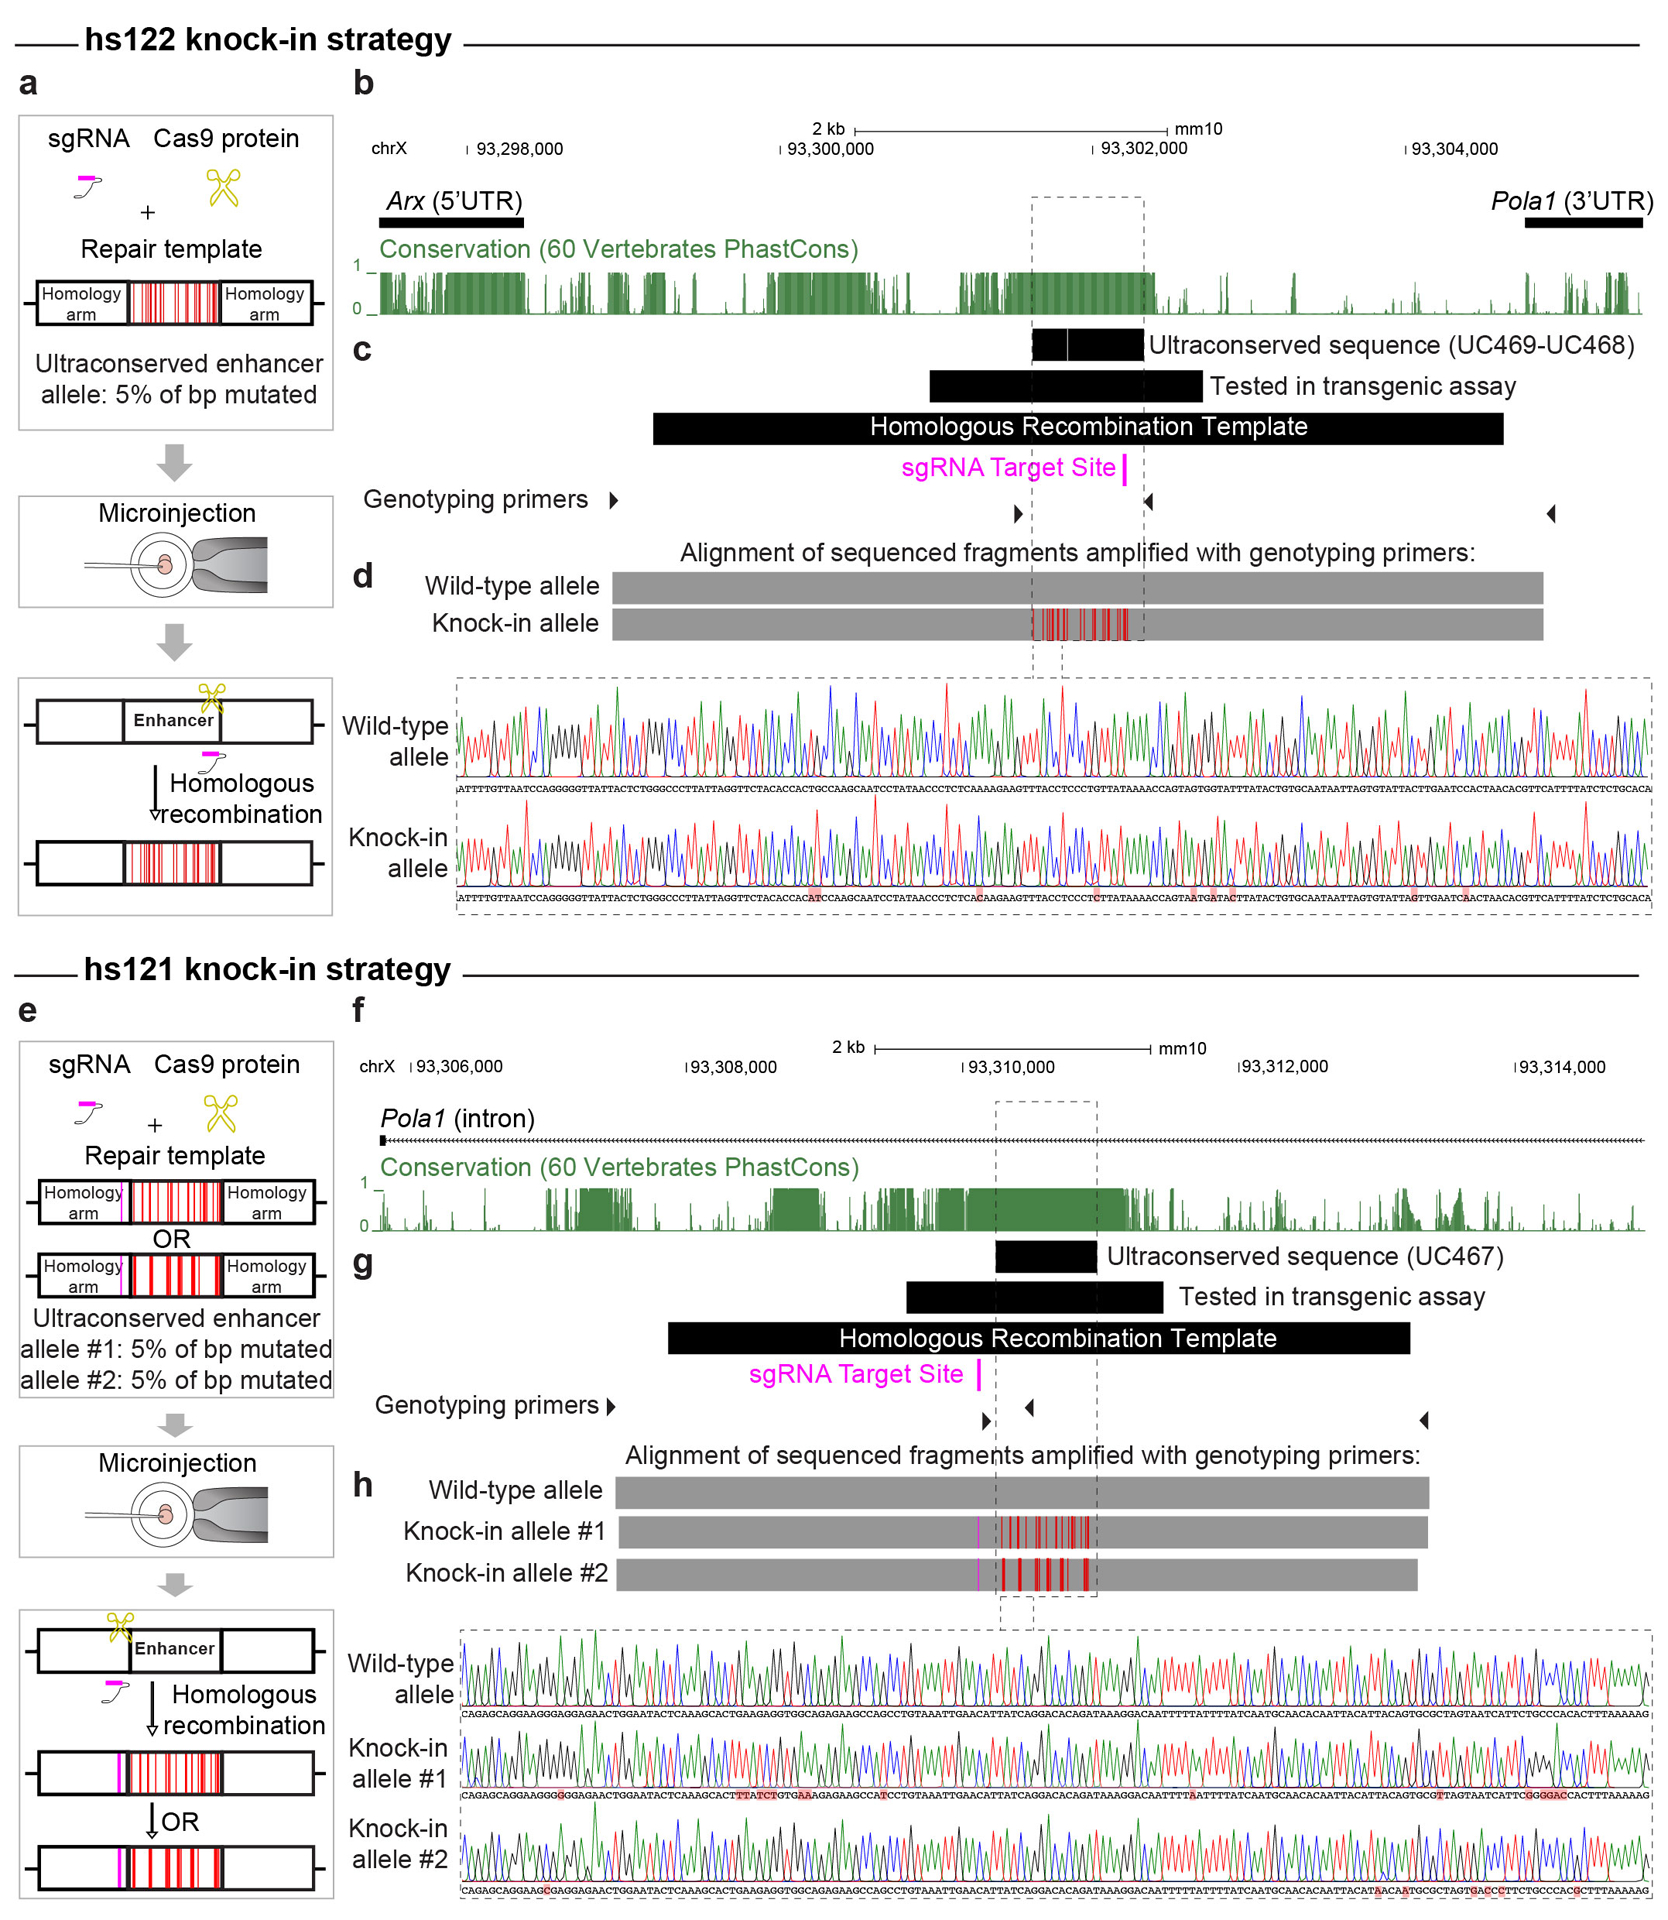
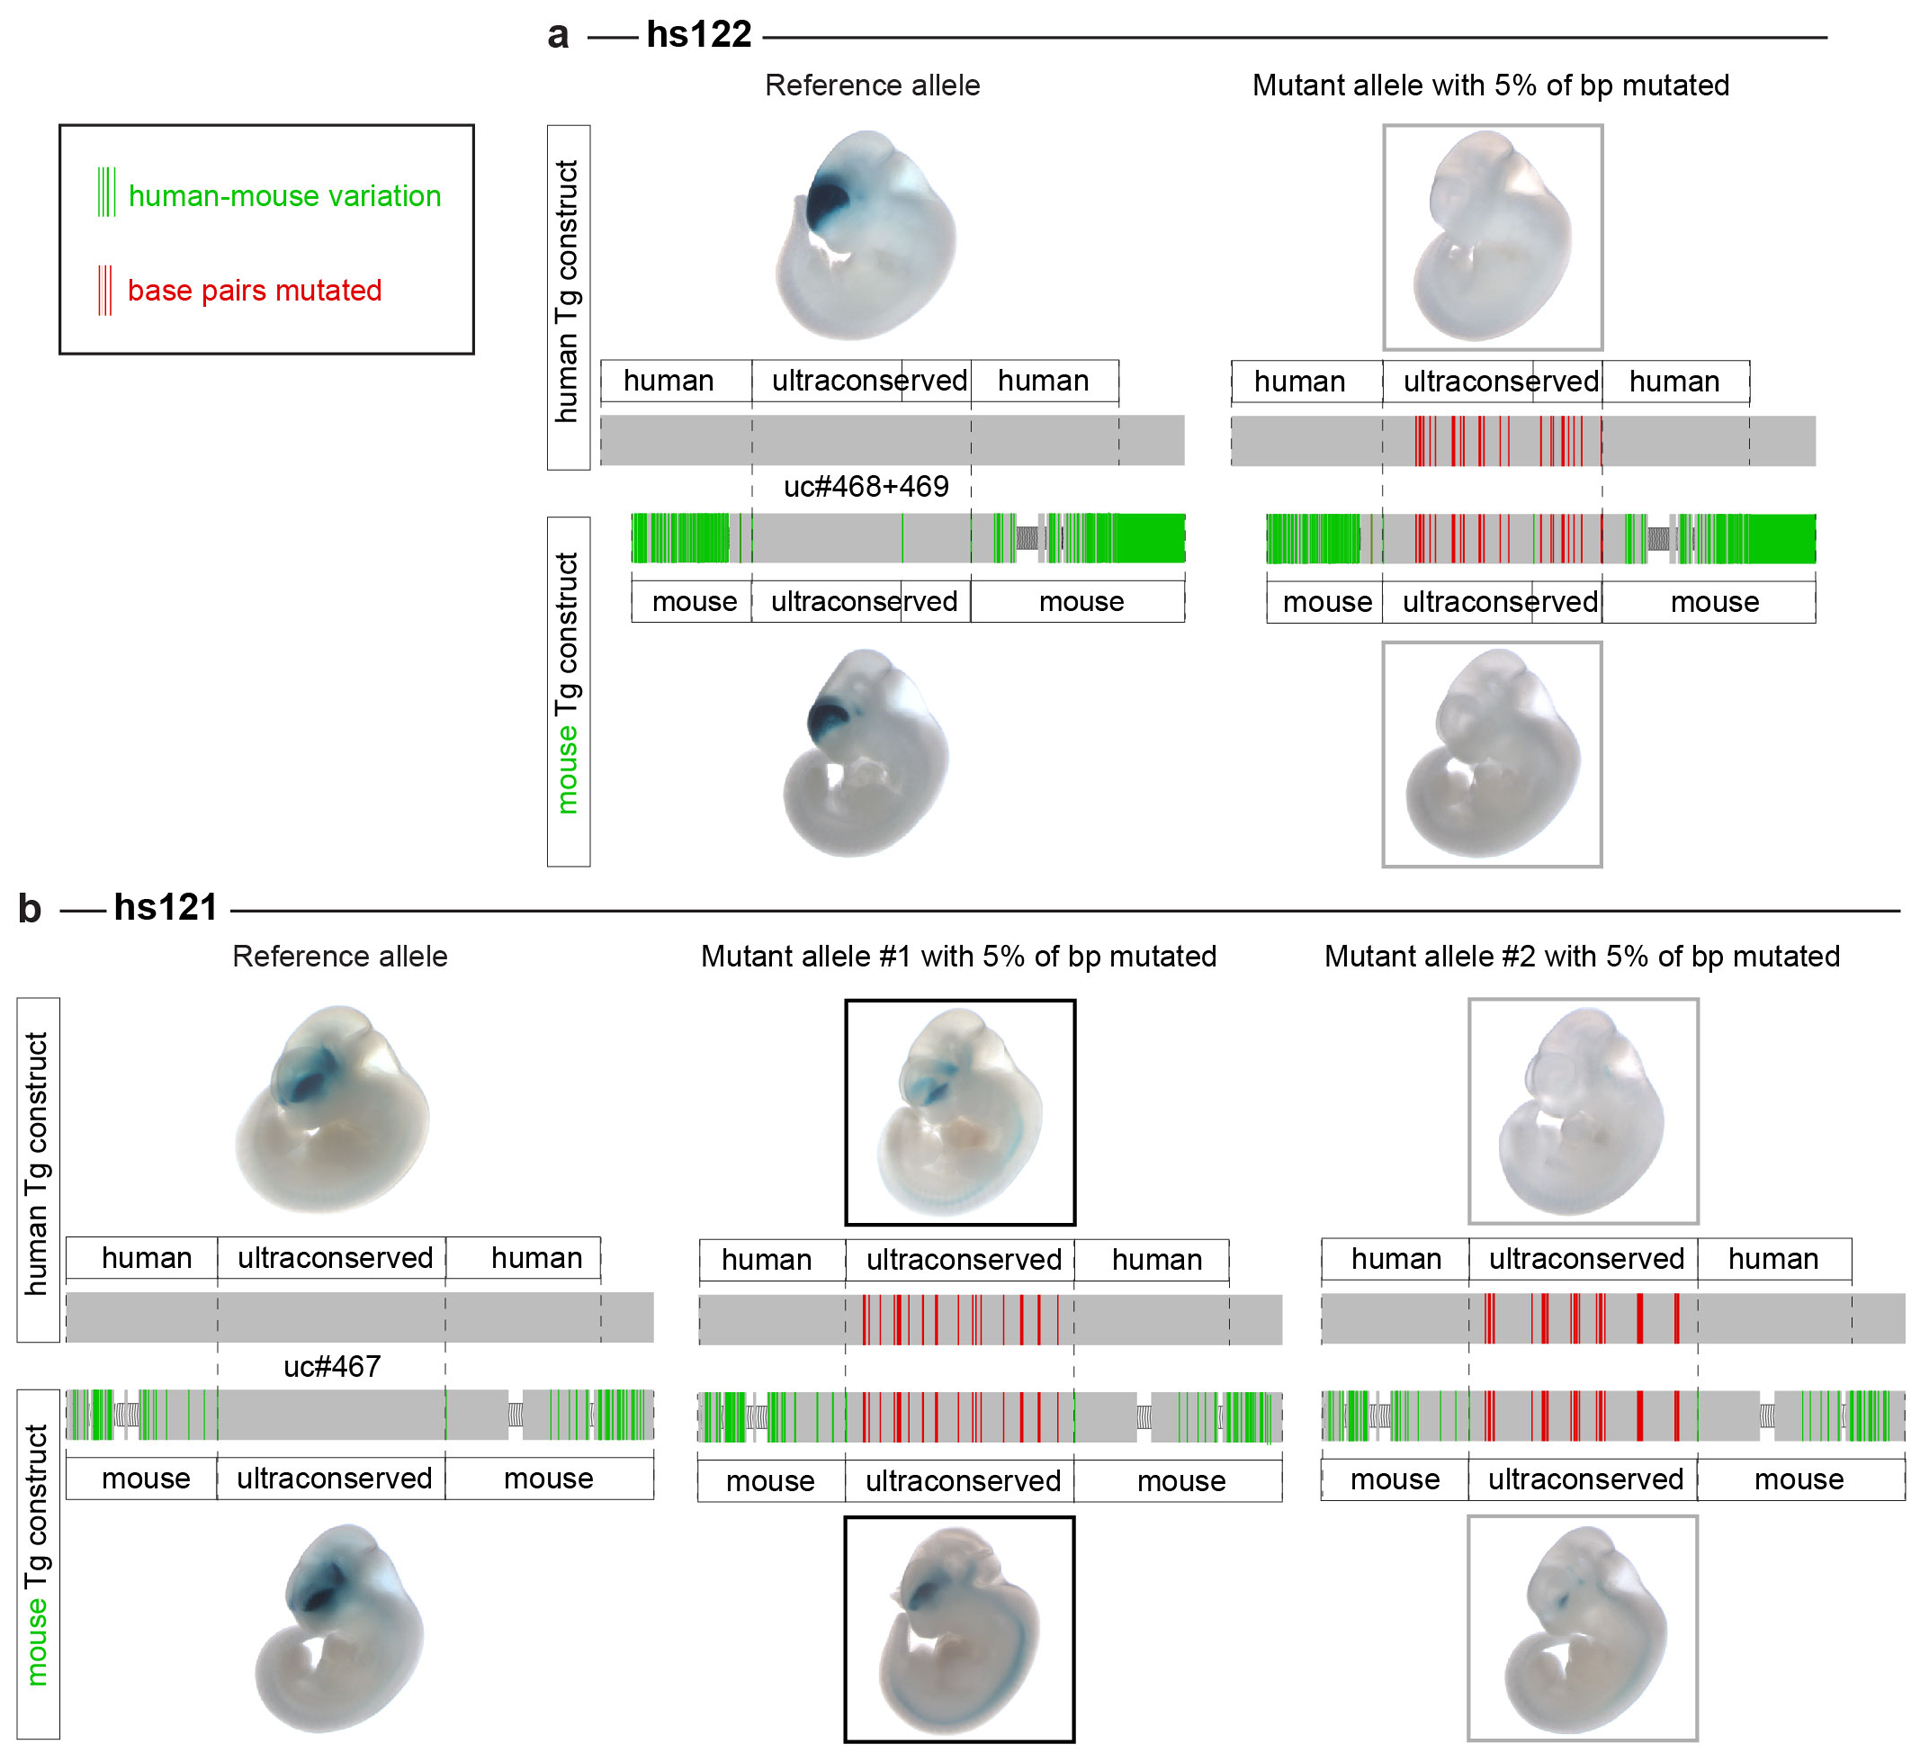
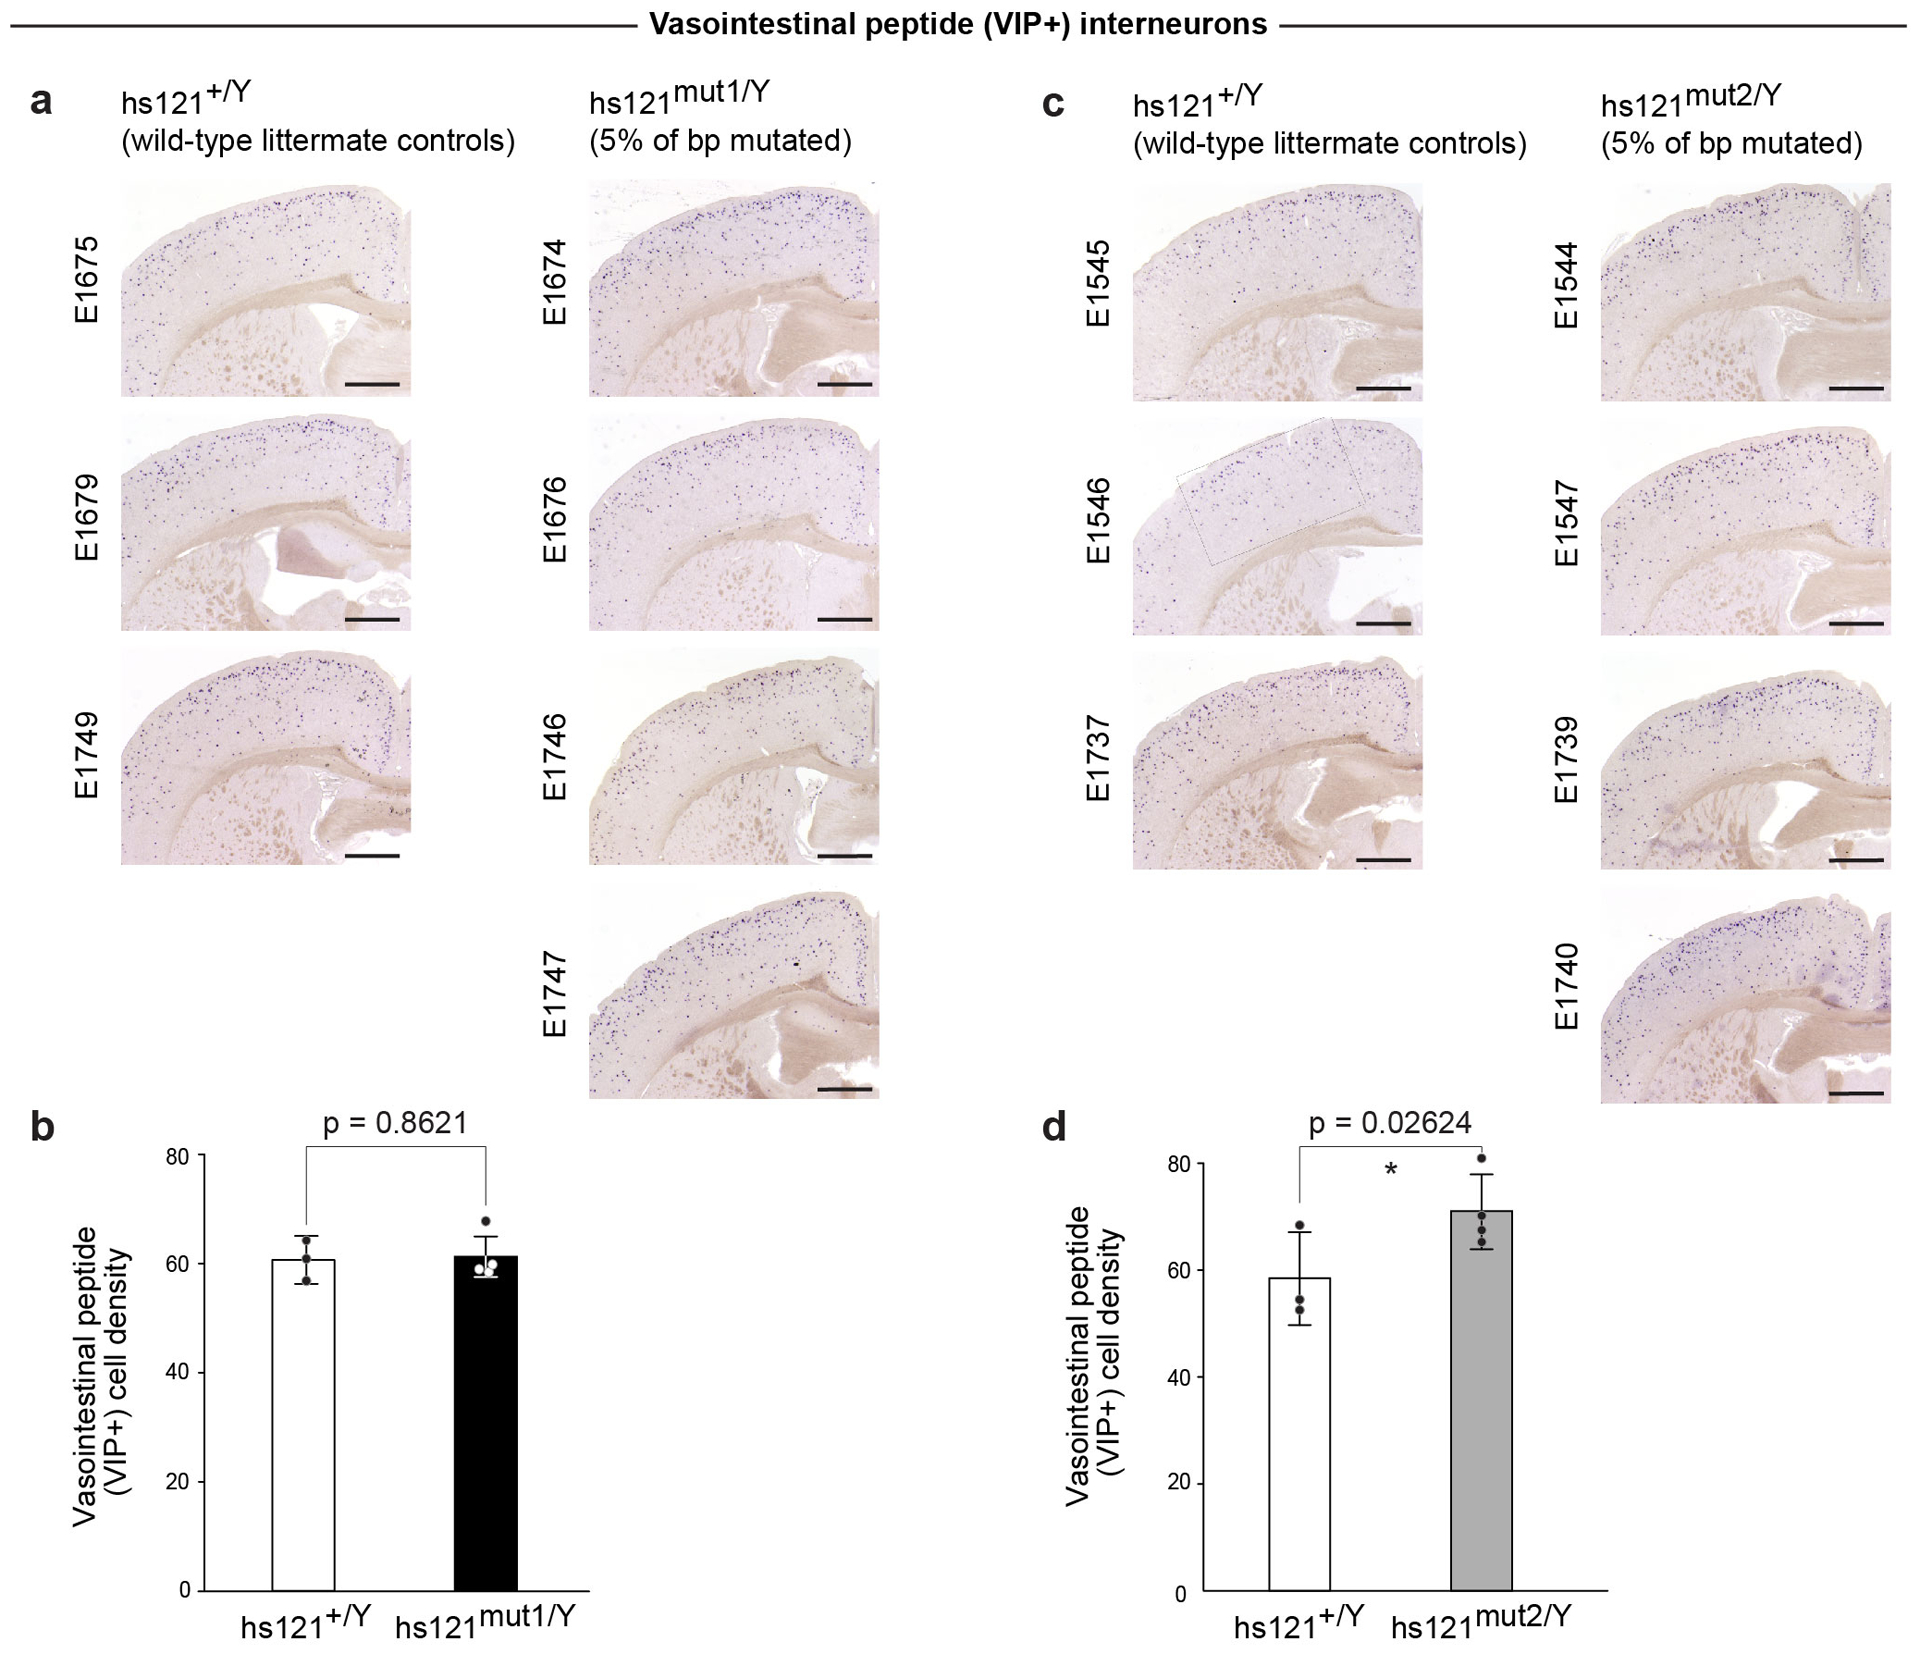
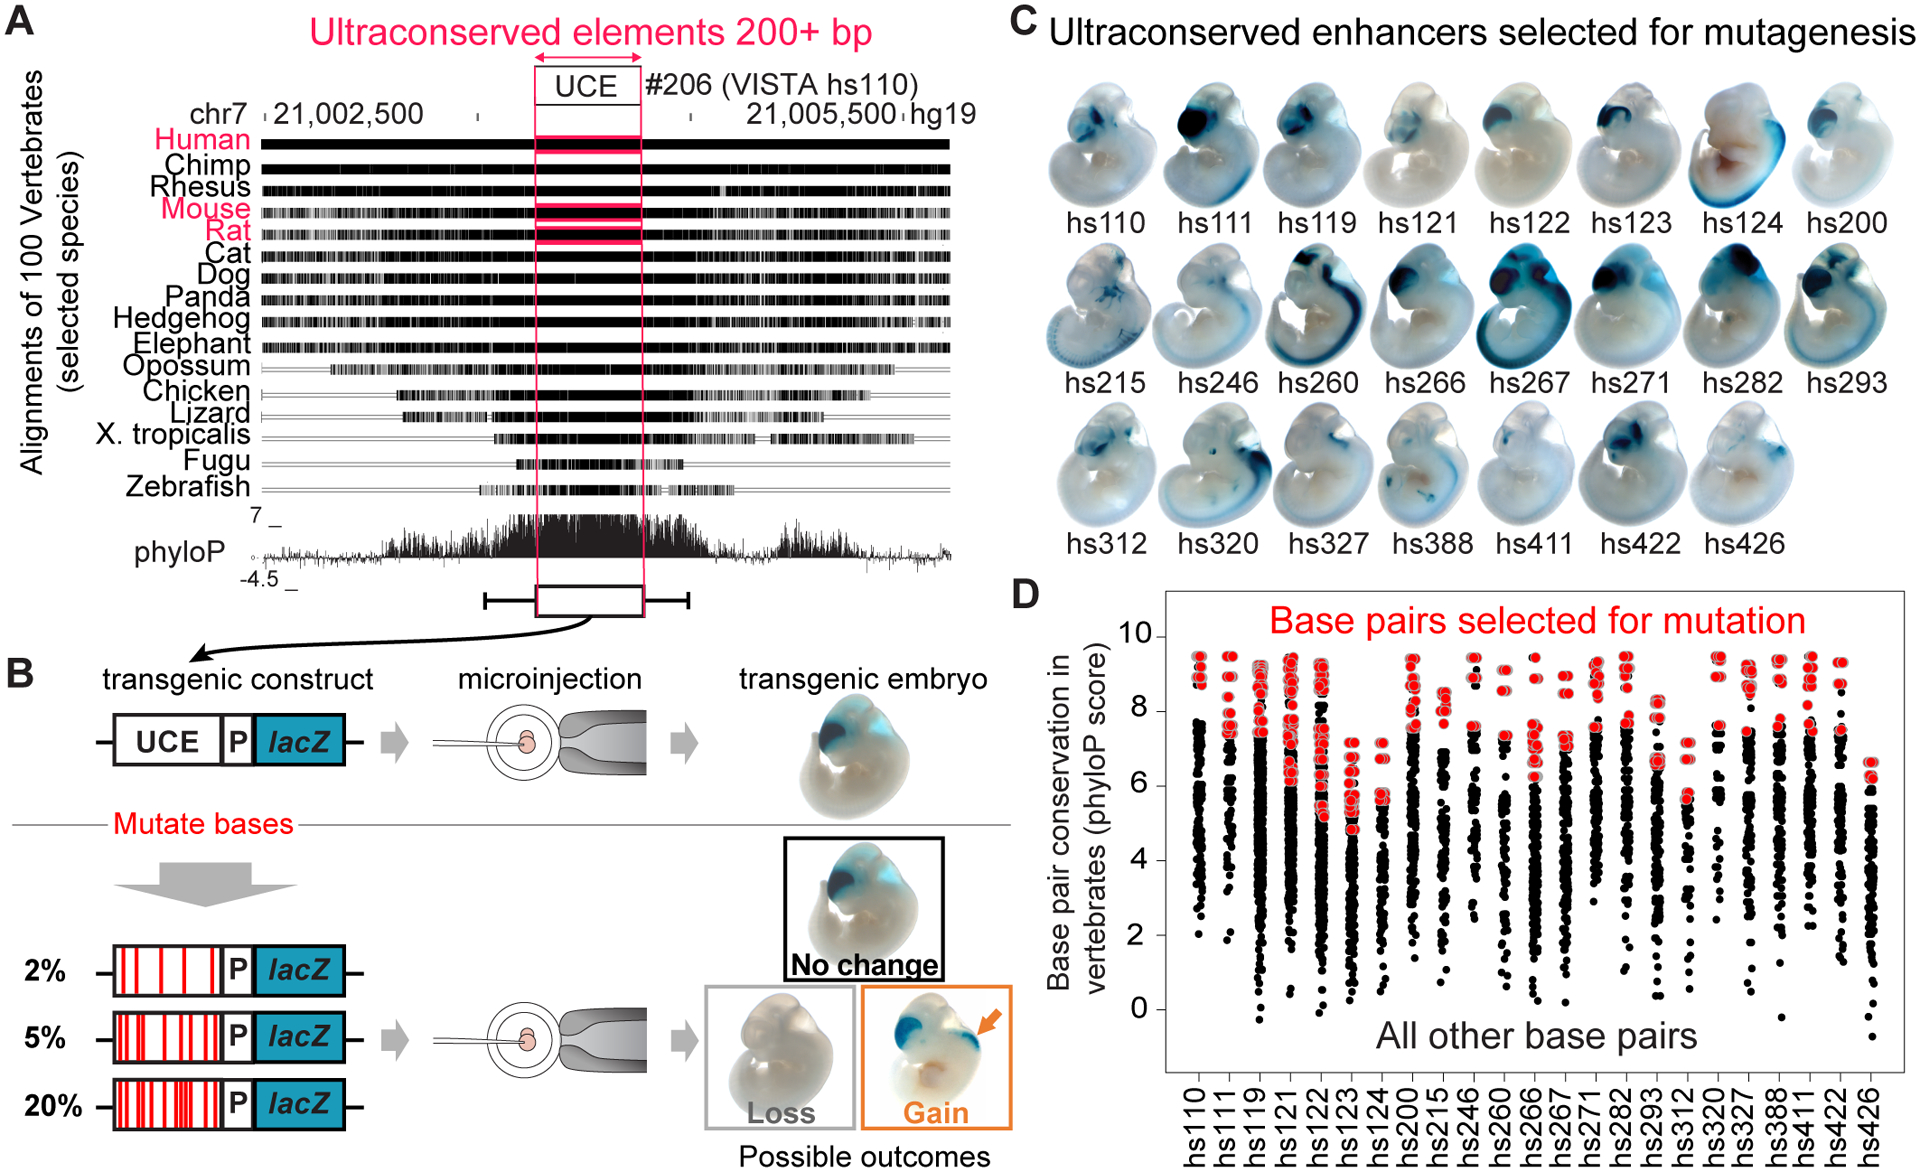
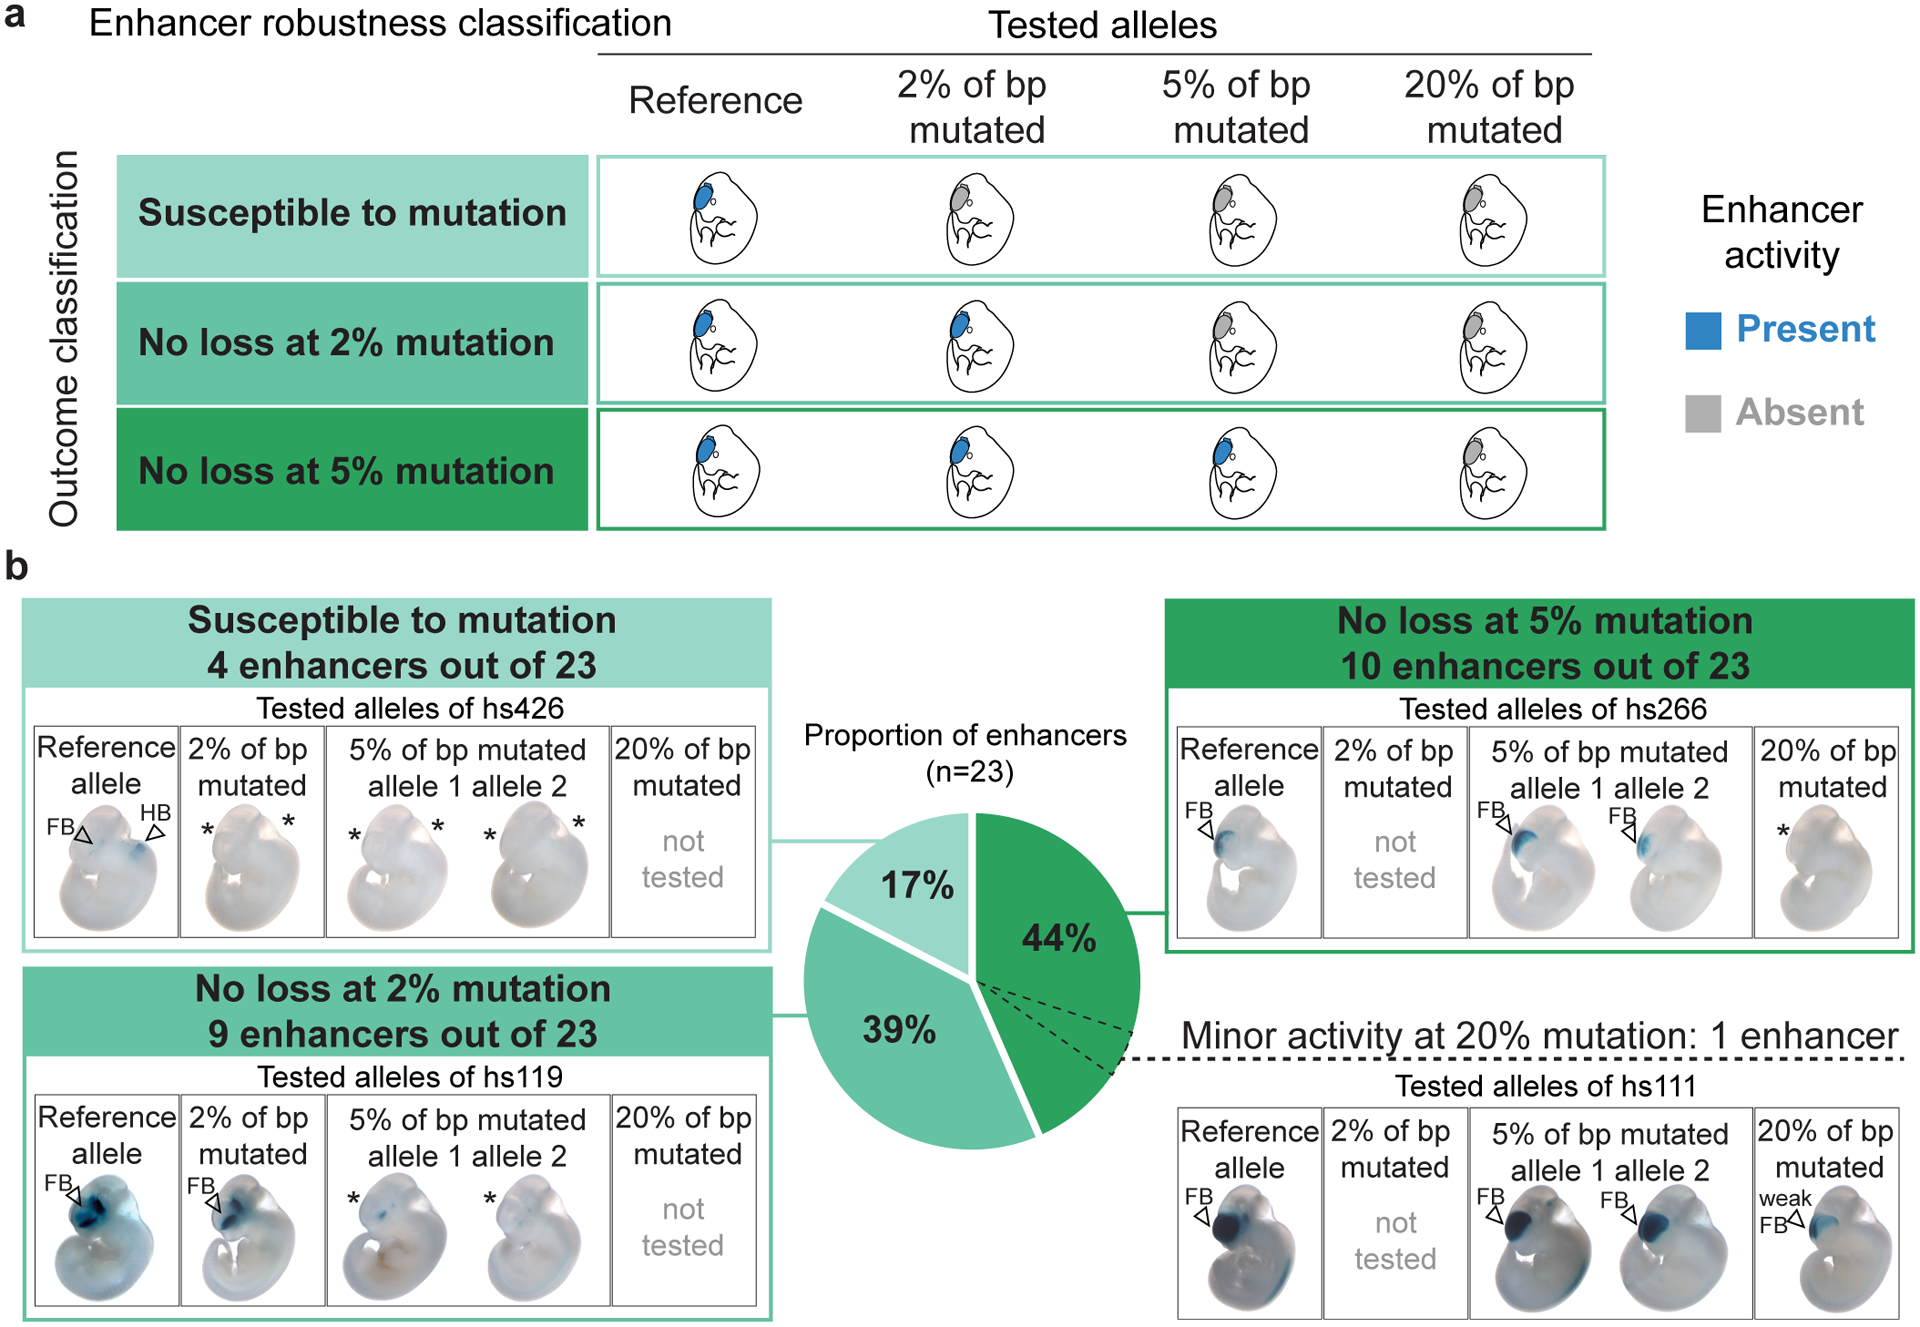
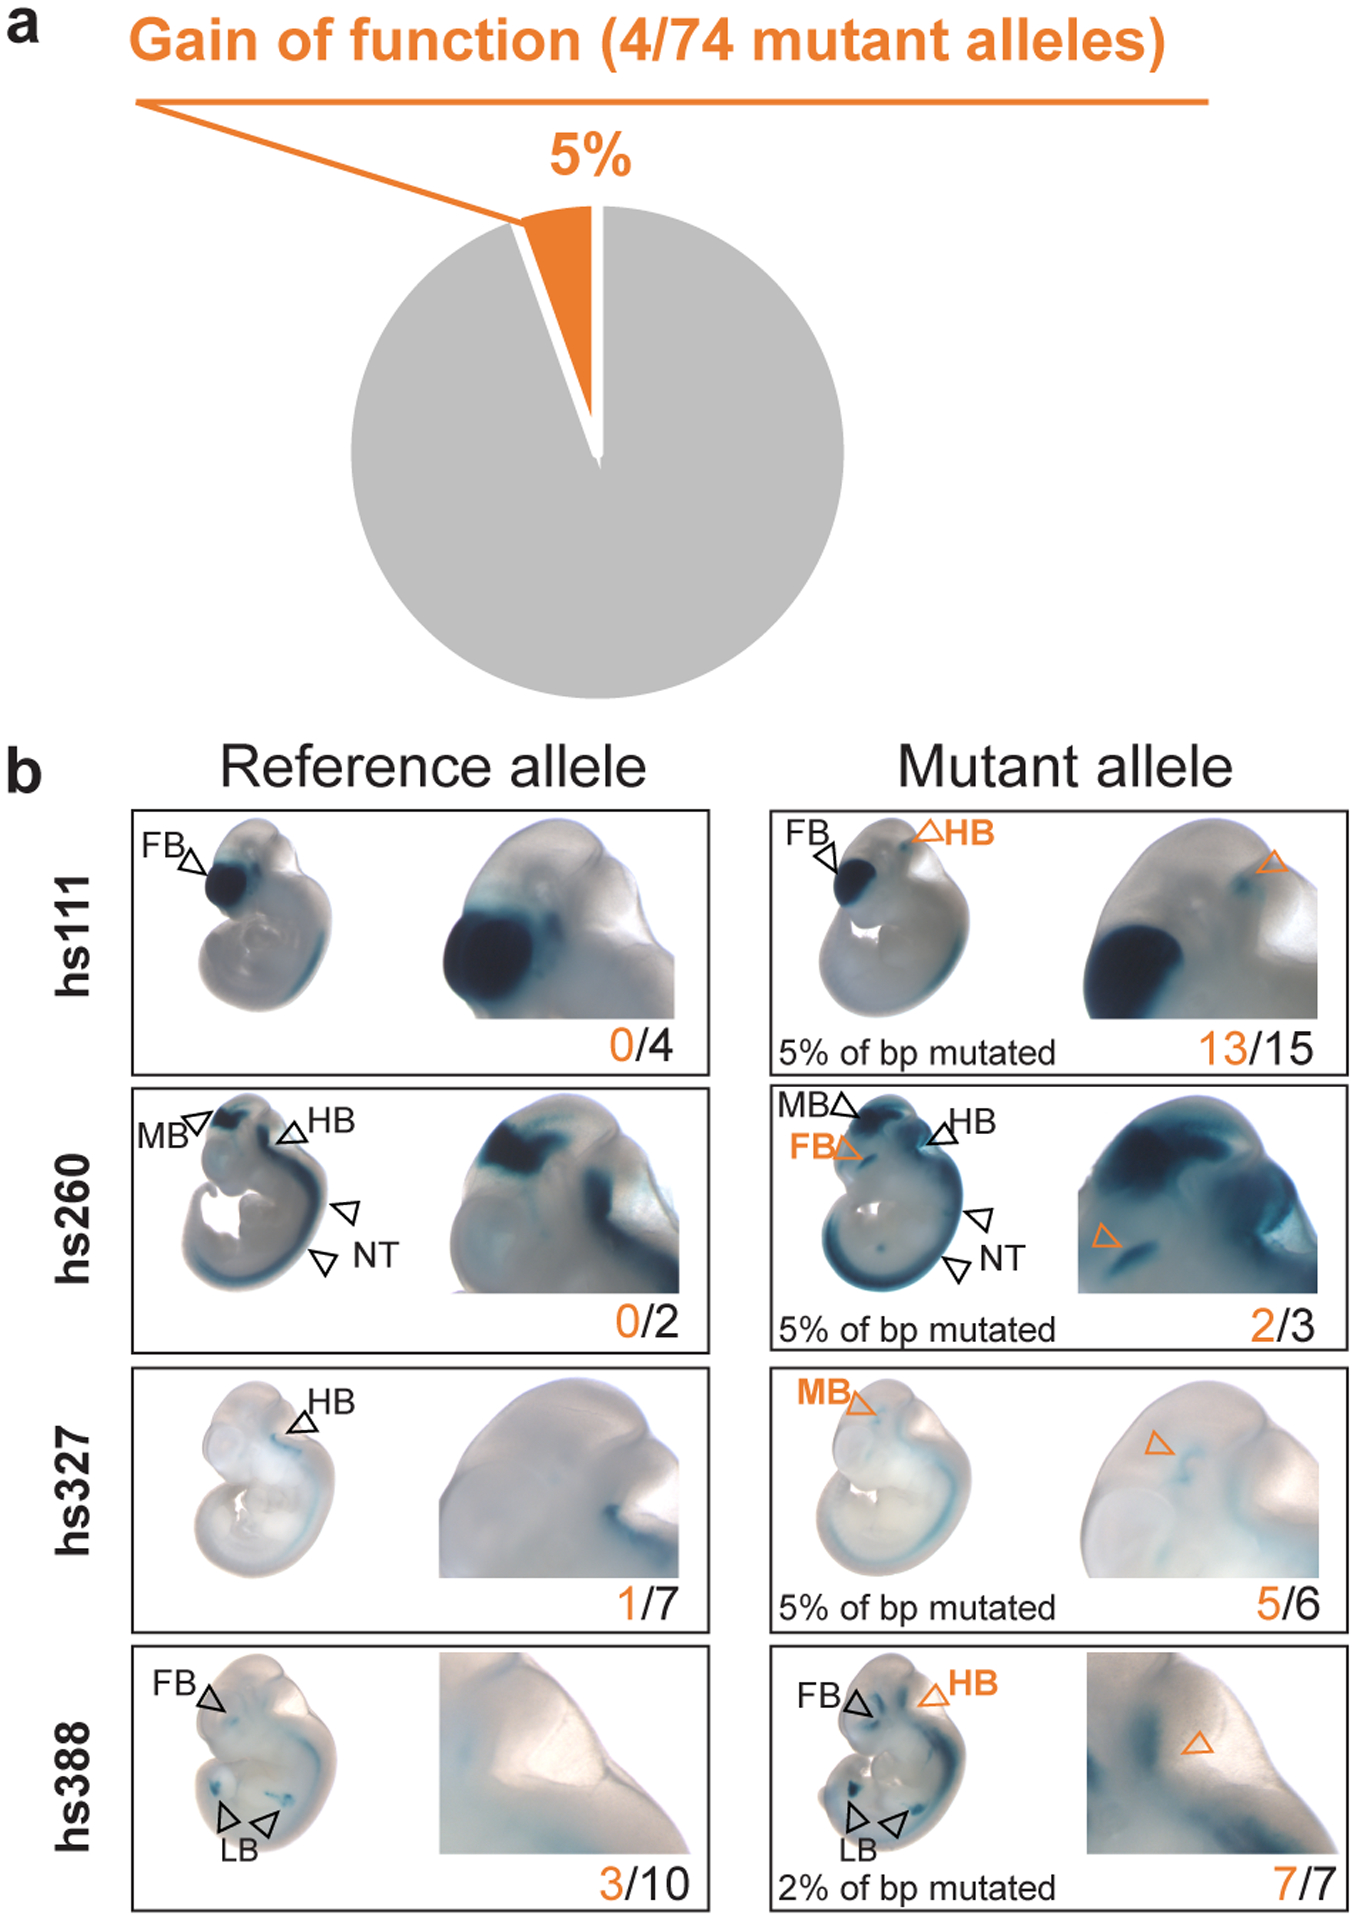
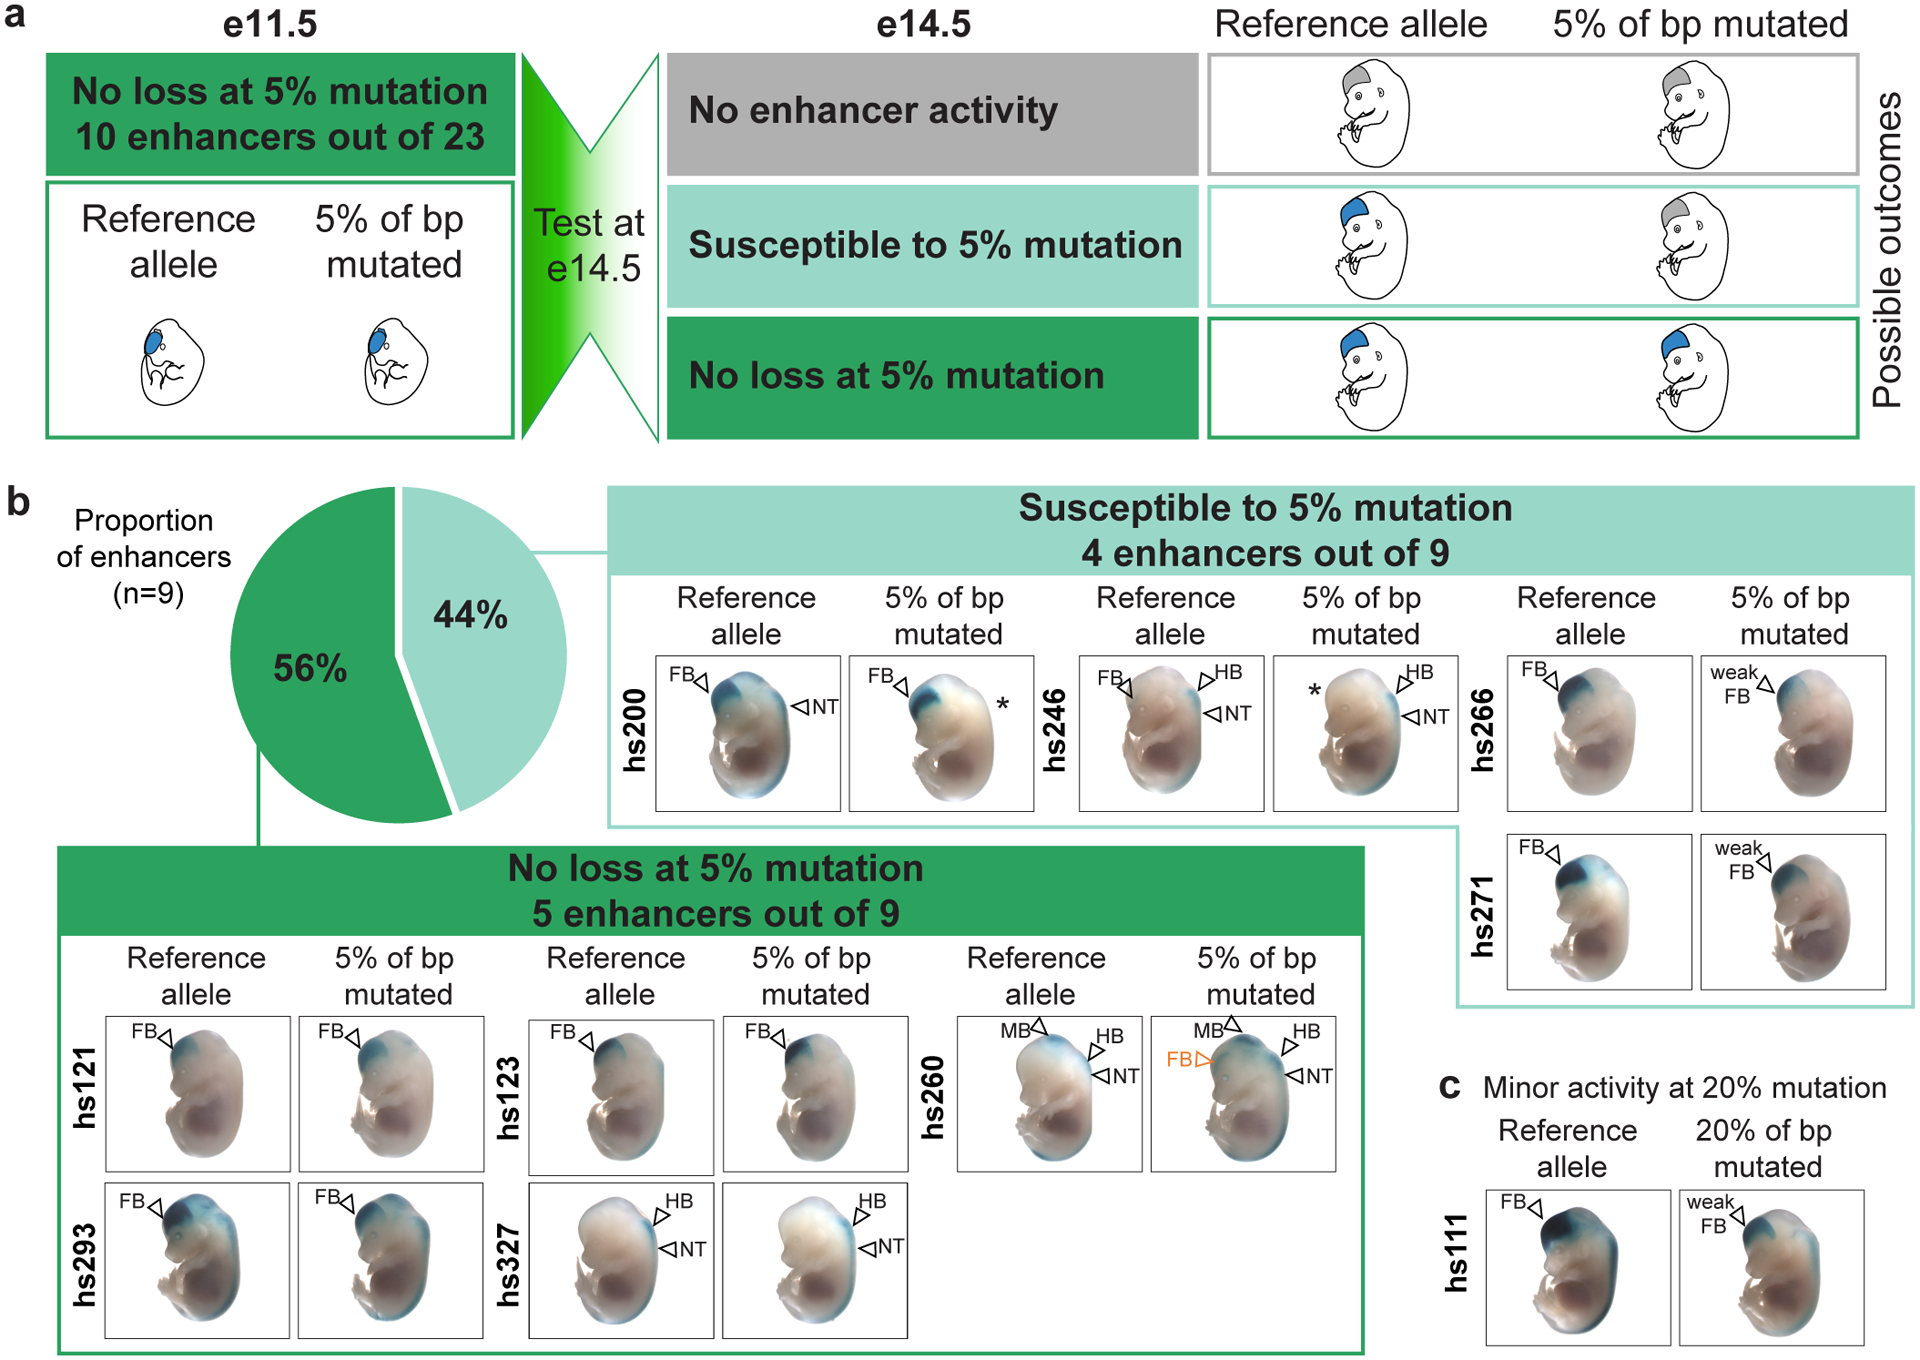
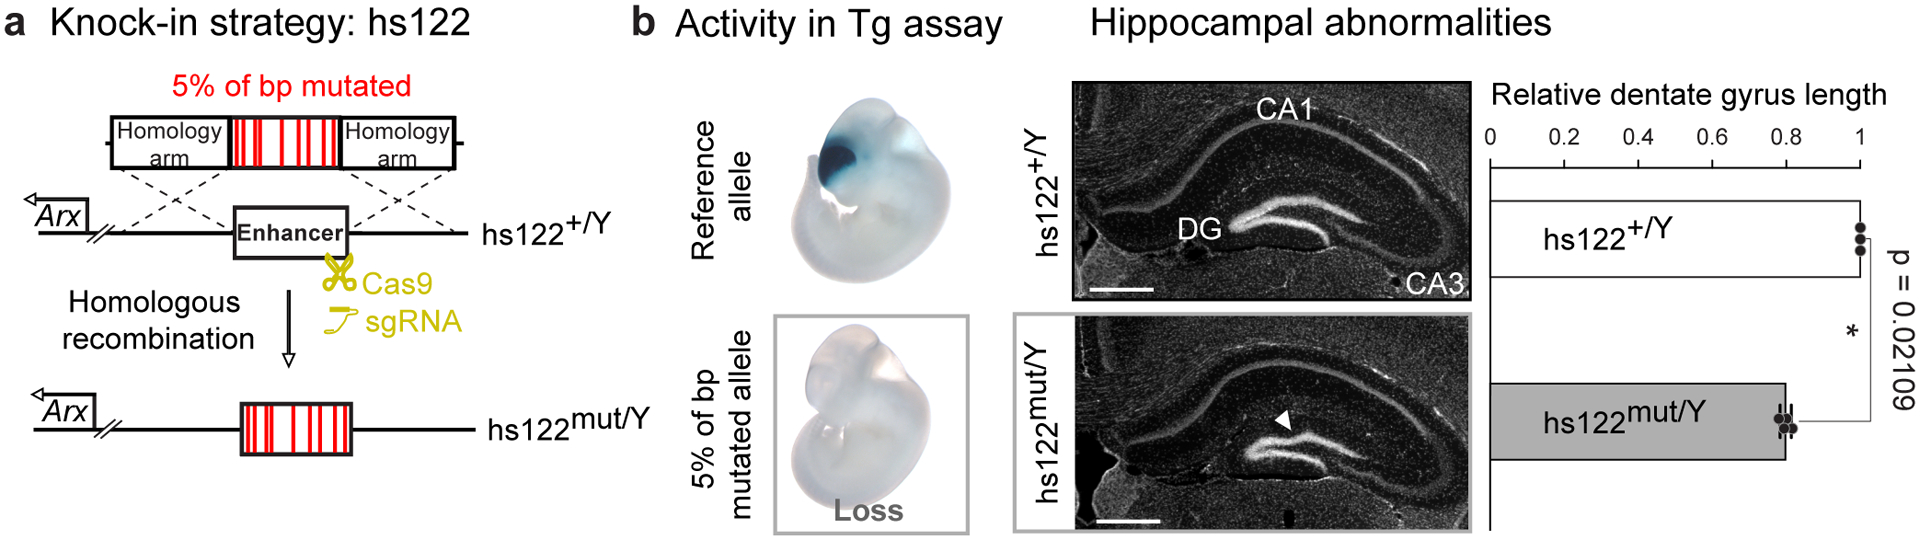
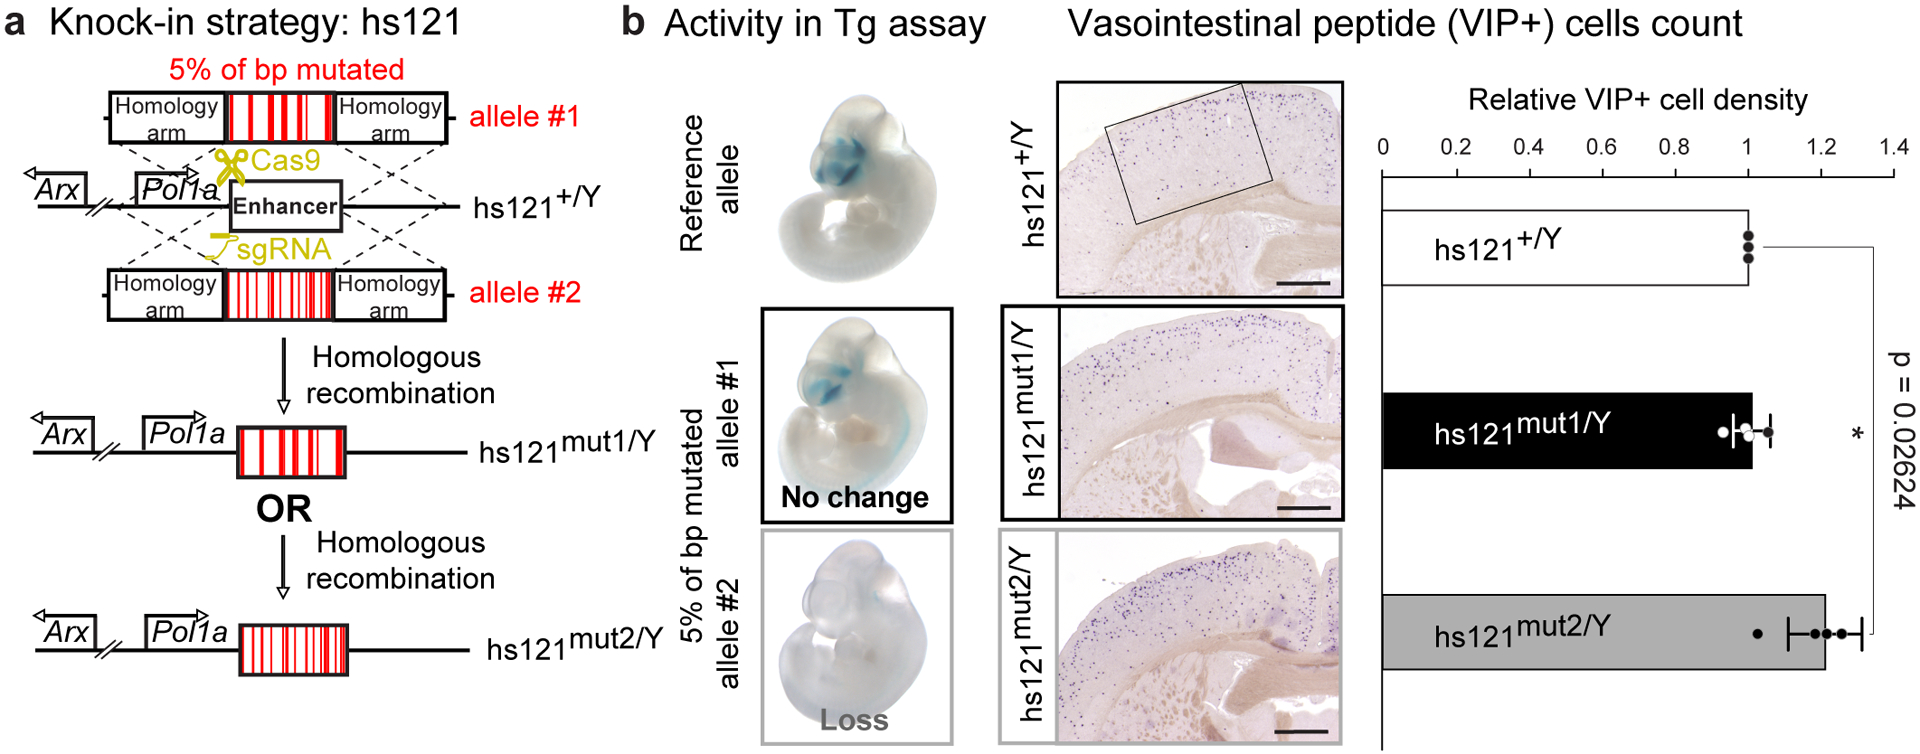
Ultraconserved enhancer sequences show perfect conservation between human and rodent genomes, suggesting that their functions are highly sensitive to mutation. However, current models of enhancer function do not sufficiently explain this extreme evolutionary constraint. We subjected 23 ultraconserved enhancers to different levels of mutagenesis, collectively introducing 1,547 mutations, and examined their activities in transgenic mouse reporter assays. Overall, we find that the regulatory properties of ultraconserved enhancers are robust to mutation. Upon mutagenesis, nearly all (19/23, 83%) still functioned as enhancers at one developmental stage, as did most of those tested again later in development (5/9, 56%). Replacement of endogenous enhancers with mutated alleles in mice corroborated results of transgenic assays, including the functional resilience of ultraconserved enhancers to mutation. Our findings show that the currently known activities of ultraconserved enhancers do not necessarily require the perfect conservation observed in evolution and suggest that additional regulatory or other functions contribute to their sequence constraint.


Conflict of interest statement

Competing Interest Statements

J.L.R.R. is cofounder, stockholder, and currently on the scientific board of Neurona, a company studying the potential therapeutic use of interneuron transplantation. The authors declare no other competing interests.

Figures

Extended Data Fig. 1
Extended Data Fig. 1. Characterization of base pairs selected for mutagenesis.
a, Detailed breakdown of conservation (phylop100way score) and position of base pair mutations for selected examples of ultraconserved enhancers mutated in this study. Base pairs selected to achieve various levels of mutagenesis: 2%, 5%, 20%, or all base pairs conserved among ~100 vertebrates are marked according to the legend. All coordinates are in hg19. Locations of conserved transcription factor motifs and human SNVs (TOPMed, https://bravo.sph.umich.edu/freeze5/hg38/) are also included (see legend). See Supplementary Information for similar plots of all 23 ultraconserved enhancers selected for mutagenesis. b, Percentage of mutations introduced into ultraconserved sequences that also overlapped human SNVs (all overlap rare human variants, i.e. found in <1% of human population. No introduced mutations overlap a SNV common in the human population).
Extended Data Fig. 2
Extended Data Fig. 2. Example of enhancer scoring.
Top: calibration images given for one ultraconserved enhancer (hs111) to show different categories of enhancer activity. Randomized embryo images were shown to five reviewers alongside the calibration images displayed at the top. The reviewers scored the strength of enhancer activity independently and blind to the identity of the enhancer allele. Bottom: breakdown of enhancer activity scoring results per embryo for four different alleles tested for the hs111 enhancer: reference allele, allele with 5% of bp mutated #1, allele with 5% of bp mutated #2, and allele with 20% of bp mutated. See Supplementary Information for a similar scoring breakdown of all 23 ultraconserved enhancers selected for mutagenesis.
Extended Data Fig. 3
Extended Data Fig. 3. Distribution of 23 ultraconserved enhancers among the three groups of enhancer mutagenesis outcomes.
a, Images of embryos and enhancer activity results for all 23 enhancers. Bar plots under the embryo images show the strength and reproducibility of LacZ staining (serving as a proxy for enhancer activity) among individual transgenic embryos from each enhancer allele. Enhancer activity was scored by five independent reviewers blind to the embryo genotype after the images were randomized (see Methods, Extended Data Fig. 2 and Supplementary Information for details). Embryo images for CRISPR-assisted transgenic experiments for the reference alleles of enhancers hs200 and hs215 were published previously. All other transgenic assays were newly performed for this study. All of the mutation alleles tested harbored sequence changes at 2, 5, or 20% of ultraconserved bases, as indicated above, with the exception of three of the alleles grouped with the 20% variants (marked with an asterisk [*] for hs122, hs200, and hs267). For the hs122 allele, 25% of bp were actually mutated. For hs200 (16% mutation) and hs267 (12% mutation), fewer than 20% of base pairs are well-conserved among ~100 vertebrates, so lower levels of mutagenesis were used. b, Length of ultraconserved sequences for all 23 enhancers arranged by enhancer mutagenesis outcomes with mean and median shown per group as solid and dashed lines, respectively. No statistically significant differences detected between groups (two-tailed t-tests).
Extended Data Fig. 4
Extended Data Fig. 4. Motif enrichment analysis.
a, Motifs that are significantly enriched in 370 noncoding ultraconserved sequences compared to the whole human genome. b, Motifs that are significantly enriched in 15 base pair k-mers centered on introduced mutations compared to the whole human genome. c, Left: Bar plot comparing the number of transcription factor motifs in the JASPAR database that overlap introduced mutations in alleles of the same enhancer that either decreased enhancer activity (grey bars) or not (blue bars). Each allele has 5% of ultraconserved base pairs mutated. Right: Boxplot summarizing data from all eight enhancers shown in the bar plot. Data is presented as median in the center, first (25th percentile) and third (75th percentile) quartile as bounds of the boxes, and ± 1.5 × ICR (interquartile range = third − first quartile) from bounds of the boxes as whiskers. d, Left: Bar plot showing the percentage of JASPAR transcription factor motifs overlapping 23 enhancers mutated in this study that occur in the ultraconserved sequence of an enhancer only once (unique, black) or multiple times (redundant, grey). On average, 48% of motifs were unique. Right: Bar plot comparing distribution of unique vs. redundant transcription factor motifs that overlap introduced mutations between mutant alleles that saw decrease in enhancer activity (grey bars) and those that did not (blue bars). On average, ~52% of motifs that overlapped introduced mutations that did not decrease enhancer activity were unique, while the average for unique motifs that overlapped introduced mutations that decreased enhancer activity was ~44%.
Extended Data Fig. 5
Extended Data Fig. 5. Chromatin signatures of 23 ultraconserved enhancers mutated in this study in multiple tissues and developmental times points in mouse and human.
a, Histone modifications associated with active enhancers (H3K27ac) and inactive sequences (H3K27me3) sampled from multiple tissues throughout mouse development. ‘+’ and ‘-’ for ‘Tg+ e11.5’ indicate the presence or absence, respectively, of the activity by the reference enhancer allele in e11.5 (e12.5 for hs124) transgenic mouse embryos reported in this study. ChIP-seq data was obtained from Gorkin et al., 202040. b, Binding of Dlx transcription factors during embryonic development of mouse basal ganglia. ChIP-seq data was obtained from Lindtner et al., 201941. c, Binding of CTCF in embryonic and adult mouse tissues and adult human tissues. ChIP-seq data was obtained from Yue et al., 201442 for mouse samples and from Dunham et al., 201243 for human samples.
Extended Data Fig. 6
Extended Data Fig. 6. Knock-in strategy to introduce the mutations into the endogenous mouse alleles of hs122 (uc468+uc469) and hs121 (uc467).
a, e, The mutant enhancer alleles were knocked-in via homologous recombination of the reference allele via a CRISPR/Cas9 microinjection protocol. A sgRNA for hs122 was designed to target the reference allele sequence that overlaps mutations introduced into the mutant allele. The target sequence of a sgRNA for hs121 was 115bp upstream of the ultraconserved sequence, thus hs121 repair templates carried a point mutation altering the PAM sequence for the sgRNA (schematically indicated by the pink lines) to prevent their cleavage by the CRISPR/Cas9 complex. b, f, The genomic region between the Arx and Pola1 genes contains hs122, and hs121 is located in the first intron of the Pola1 gene. Conservation tracks (green) show phastCons scores between mouse and other vertebrate genomes. c, g, Positions of the ultraconserved sequences within enhancers (uc468+uc469 OR uc467), the sequences tested in the transgenic assay, the homologous recombination templates, and genotyping primers are shown schematically in black. Position of the sgRNA target sites shown in pink. d, h, Males hemizygous for the mutant alleles of the hs122 and hs121 enhancers were genotyped with PCR amplification (positions of genotyping primers shown as black triangles in c and g) and Sanger sequencing. Top: alignment of reads from the knock-in alleles and wild-type alleles to the reference mouse genome (mm10) is shown in grey, with mismatches indicating the location of the introduced mutations represented by red lines. Bottom: Sanger sequencing traces for mutant knock-in and wild-type alleles are shown for the region within the dotted lines. Introduced mutations are highlighted in red. See Tables S4, S5 for more information on coordinates and sequences.
Extended Data Fig. 7
Extended Data Fig. 7. Transgenic reporter assays with either human or mouse sequences surrounding the ultraconserved core show the same effect on the enhancer activity.
The sequences surrounding the ultraconserved parts of the (a) hs122 (uc468+uc469) and (b) hs121 (uc467) enhancers tested in transgenic assays differ between the human and mouse genomes (mismatches shown in green). To make sure that mouse regions flanking the ultraconserved sequences (shown in red) will not compensate for mutations introduced into the endogenous mouse alleles of the enhancers, we tested the activity of the mouse sequence in transgenic assays for both the reference alleles and the alleles with 5% of base pairs mutated. Regions to test were selected to span the hs122 and hs121 sequences deleted from the mouse genome previously.
Extended Data Fig. 8
Extended Data Fig. 8. Arx expression in mice with mutated endogenous hs121 and hs122 enhancers.
In situ hybridization for Arx expression (purple staining) performed on coronal cross-sections of e12.5 forebrains from hemizygous knock-in males shown alongside wild-type littermate controls from three knock-in lines: (a) hs122mut (allele with 5% of base pairs mutated that eliminated enhancer activity in mouse transgenic assay), (b) hs121mut1 (allele with 5% of base pairs mutated that did not affect enhancer activity in mouse transgenic assay), and (c) hs121mut2 (allele with 5% of base pairs mutated that eliminated enhancer activity in mouse transgenic assay). Arrows point to a loss of Arx signal in the caudal cortical regions of hs122mut/Y sections. We did not detect changes in Arx expression in hemizygous knock-in male embryos for either of the hs121 enhancer mutant alleles (hs121mut1/Y and hs121mut2/Y). However, this is consistent with the data from hs121-null embryos, and is likely due to tissue heterogeneity and the presence of another Arx enhancer (hs119) with a similar activity domain. Scale bars, 200 μm.
Extended Data Fig. 9
Extended Data Fig. 9. Mutagenesis of the endogenous hs122 enhancer results in dentate gyrus abnormalities (a smaller dentate gyrus with disorganized appearance).
Rostral (a) and caudal (b) coronal cross-sections of postnatal hippocampus from all phenotyped animals: three wild-type littermate male controls and four hemizygous knock-in males shown side-by-side for comparison. Numbers represent unique identifiers for each mouse examined (details in Table S6). Scale bars, 500 μm. c, Bar graph showing quantification of dentate gyrus length for wild-type mice in (a) (n=3) and knock-in mice in (b) (n=4). Bars indicate mean densities, with individual biological replicates represented by dots. Error bars, mean ± s.d. Difference in length between wild-type and knock-in mice assessed by a two-tailed paired t-test.
Extended Data Fig. 10
Extended Data Fig. 10. Mutagenesis of the endogenous hs121 enhancer results in abnormalities in the number of vasointestinal peptide (VIP+) interneurons in adult mice brains only for the allele that abolished hs121 enhancer activity in transgenic reporter assay.
Coronal cross-sections through cortex from two knock-in lines generated for mutant alleles of the hs121 enhancer: one that was active (a) in the transgenic reporter assay and one that was inactive (c). Representative images shown from all phenotyped animals: three wild-type littermate male controls and four hemizygous knock-in males for each allele, displayed side-by-side for comparison. Numbers represent unique identifiers for each mouse examined (details in Table S7). Scale bars, 1 mm. b, d, Bar graphs showing quantification of VIP+ interneuron densities (cells/mm2) between wild-type (n=3) and knock-in (n=4) mice. Bars indicate mean densities, with individual biological replicates represented by dots. Error bars, mean ± s.d. Differences between wild-type and knock-in mice assessed by two-tailed paired t-tests.
Fig. 1.
Fig. 1.. Study overview.
a, Human-rodent ultraconserved elements show a high degree of conservation across other sequenced vertebrate genomes. UCE, ultraconserved element. b, Study design for mouse transgenic reporter assays to reveal whether mutations in ultraconserved enhancers impact their activity. P, promoter. c, Activity of the human reference allele of 23 ultraconserved enhancers selected for mutagenesis. All elements were tested with a CRISPR-assisted site-specific mouse transgenic reporter assay at mouse embryonic day 11.5 (e11.5) except hs124, which was tested at e12.5. d, Conservation of all human-rodent ultraconserved base pairs within the selected 23 ultraconserved enhancers across 100 sequenced vertebrate genomes (phyloP score obtained from UCSC phyloP100way track). Base pairs selected for mutagenesis are highlighted in red. More details on selecting base pairs for mutagenesis can be found in Extended Data Figure 1a and Supplementary Figure 2.
Fig. 2.
Fig. 2.. Ultraconserved enhancers are mostly robust to mutagenesis.
a, Schematic of the possible functional outcomes of enhancer mutagenesis. b, Distribution of 23 ultraconserved enhancers among the three bins of enhancer mutagenesis outcomes. Representative embryo images are shown for each tested allele of three example enhancers (boxes in shades of green). In one case (hs111, bottom right), residual enhancer activity was still observed after mutating 20% of ultraconserved base pairs. Data for all 23 enhancers are provided in Extended Data Figure 3a, with P values in Supplementary Table 1. Examples of scoring guidelines are described in Extended Data Figure 2, with scoring data for all 23 enhancers in Supplementary Figure 1. e11.5 embryos have a crown-rump length of 6 mm on average. * indicates a loss of LacZ staining in the mutant allele, FB – forebrain, HB – hindbrain.
Fig. 3.
Fig. 3.. Gain-of-function is uncommon among mutated alleles of ultraconserved enhancers.
a, Proportion of gain-of-function alleles detected among all different mutant alleles of 23 ultraconserved enhancers. b, Images of representative transgenic embryos from four gain-of-function alleles resulting from ultraconserved enhancer mutagenesis. P values are provided in Supplementary Table 2. e11.5 embryos have a crown-rump length of 6 mm on average. FB – forebrain, MB – midbrain, HB – hindbrain, NT – neural tube.
Fig. 4.
Fig. 4.. Mutagenesis of ultraconserved enhancers at a later stage of development recapitulates earlier results for a majority of tested enhancers but exposes susceptibility to mutations for some.
a, Schematic of experimental design to test ultraconserved enhancers shown to be robust to 5% mutagenesis at e11.5, at a later developmental stage of e14.5 and the possible functional outcomes. b, Transgenic assay results for nine ultraconserved enhancers at e14.5. See Supplementary Figure 1 for reproducibility of LacZ staining among individual transgenic embryos from each enhancer allele. * indicates a loss of LacZ staining in the mutant allele. c, Transgenic assays results for hs111 at e14.5. FB – forebrain, MB – midbrain, HB – hindbrain, NT – neural tube.
Fig. 5.
Fig. 5.. Mutagenesis of endogenous ultraconserved enhancer hs122 causes brain phenotypes.
a, Schematic of the knock-in strategy used to replace the endogenous mouse allele of ultraconserved enhancer hs122 with an allele in which 5% of base pairs were mutated. b, Left: Transgenic assay results for hs122 reference and mutated enhancer alleles. Middle: Replacement of the endogenous mouse hs122 allele with a mutagenesis allele that inactivated enhancer activity in the transgenic assay results in a smaller dentate gyrus (DG) with disorganized appearance (white arrowhead). Left: Rostral coronal cross-sections of postnatal hippocampus from a wildtype male control (hs122+/Y) and a hemizygous mutant knock-in littermate (hs122mut/Y). CA1/3: Cornu Ammonis areas 1 and 3. Scale bars, 500 μm. Right: Dentate gyrus length for knock-in allele normalized to wild-type littermate controls. Bars indicate group means, with individual points showing biological replicates (n = 3 for wild-type, n = 4 for knock-in). Error bars, mean ± s.d. Two-tailed paired t-test. Images for all replicates in Extended Data Figure 9, and measurements in Supplementary Table 3.
Fig. 6.
Fig. 6.. Mutagenesis of endogenous ultraconserved enhancer hs121 corroborates transgenic assay results.
a, Schematic of the knock-in strategy used to replace the endogenous mouse allele of ultraconserved enhancer hs121 with alleles in which 5% of all base pairs were mutated. b, Left: Transgenic assay results for hs121 reference and mutated enhancer alleles. Middle: Mutagenesis of hs121 results in a higher density of vasointestinal peptide (VIP) positive cells in the brain only for mutations that abolished enhancer activity in the transgenic assay. Left: Coronal sections through the cortex of postnatal wild-type control (hs121+/Y) and hemizygous mutant knock-in males (hs121mut1/Y and hs121mut2/Y) labeled for VIP. The rectangle shown in the image of the hs121+/Y brain marks the area used to count the cells. Scale bars, 1 mm. Right: Density of VIP+ neurons (cells/mm2) for the two knock-in alleles normalized to wild-type littermate controls. Bars indicate group means, with individual points showing biological replicates (n = 3 for wild-type, n = 4 for knock-in). Error bars, mean ± s.d. Two-tailed paired t-test. Images for all replicates in Extended Data Figure 10, and measurements in Supplementary Table 4.

Comment in

References

    1. Bejerano G et al. Ultraconserved elements in the human genome. Science 304, 1321–5 (2004). - PubMed
    1. Hecker N & Hiller M A genome alignment of 120 mammals highlights ultraconserved element variability and placenta-associated enhancers. Gigascience 9(2020). - PMC - PubMed
    1. Katzman S et al. Human genome ultraconserved elements are ultraselected. Science 317, 915 (2007). - PubMed
    1. Drake JA et al. Conserved noncoding sequences are selectively constrained and not mutation cold spots. Nat Genet 38, 223–7 (2006). - PubMed
    1. Ovcharenko I Widespread ultraconservation divergence in primates. Mol Biol Evol 25, 1668–76 (2008). - PMC - PubMed

Publication types

Substances