. 2021 Apr;53(4):500-510.
doi: 10.1038/s41588-021-00803-4. Epub 2021 Mar 29.

Gain-of-function variants in SYK cause immune dysregulation and systemic inflammation in humans and mice

Collaborators, Affiliations

Gain-of-function variants in SYK cause immune dysregulation and systemic inflammation in humans and mice

Lin Wang et al. Nat Genet. 2021 Apr.

Erratum in

  • Author Correction: Gain-of-function variants in SYK cause immune dysregulation and systemic inflammation in humans and mice.
    Wang L, Aschenbrenner D, Zeng Z, Cao X, Mayr D, Mehta M, Capitani M, Warner N, Pan J, Wang L, Li Q, Zuo T, Cohen-Kedar S, Lu J, Ardy RC, Mulder DJ, Dissanayake D, Peng K, Huang Z, Li X, Wang Y, Wang X, Li S, Bullers S, Gammage AN, Warnatz K, Schiefer AI, Krivan G, Goda V, Kahr WHA, Lemaire M; Genomics England Research Consortium; Lu CY, Siddiqui I, Surette MG, Kotlarz D, Engelhardt KR, Griffin HR, Rottapel R, Decaluwe H, Laxer RM, Proietti M, Hambleton S, Elcombe S, Guo CH, Grimbacher B, Dotan I, Ng SC, Freeman SA, Snapper SB, Klein C, Boztug K, Huang Y, Li D, Uhlig HH, Muise AM. Wang L, et al. Nat Genet. 2022 Feb;54(2):213. doi: 10.1038/s41588-021-00998-6. Nat Genet. 2022. PMID: 34987219 No abstract available.

Abstract

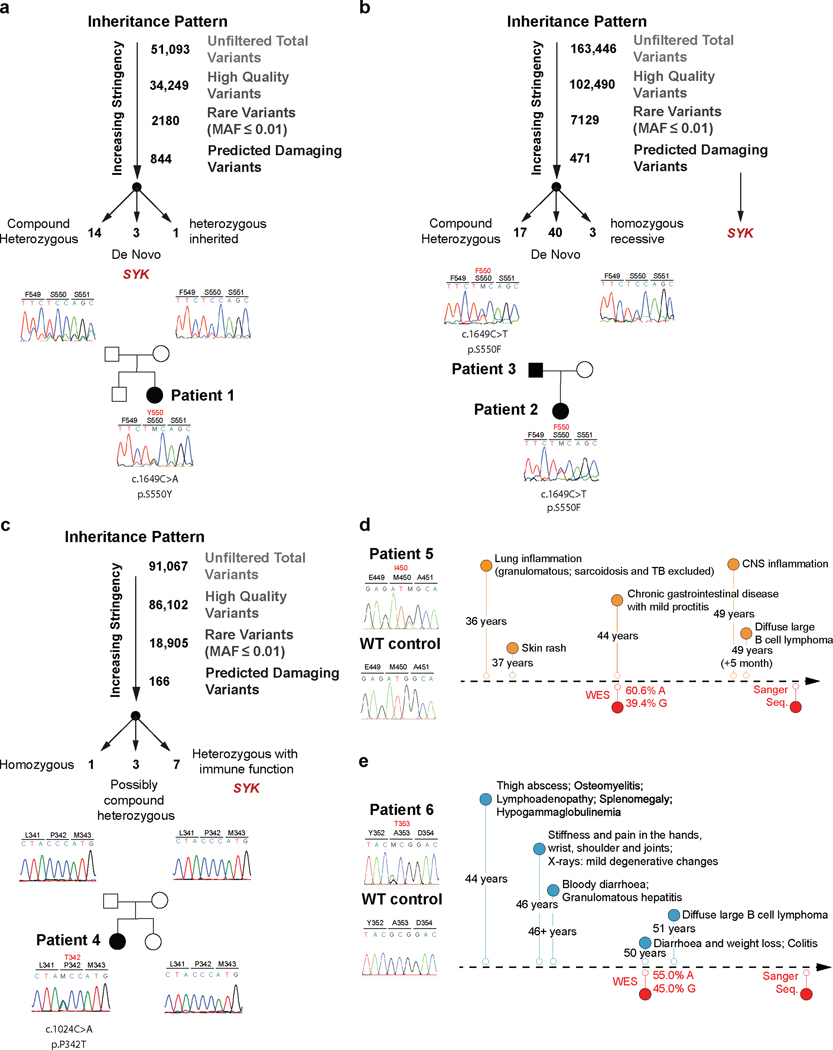
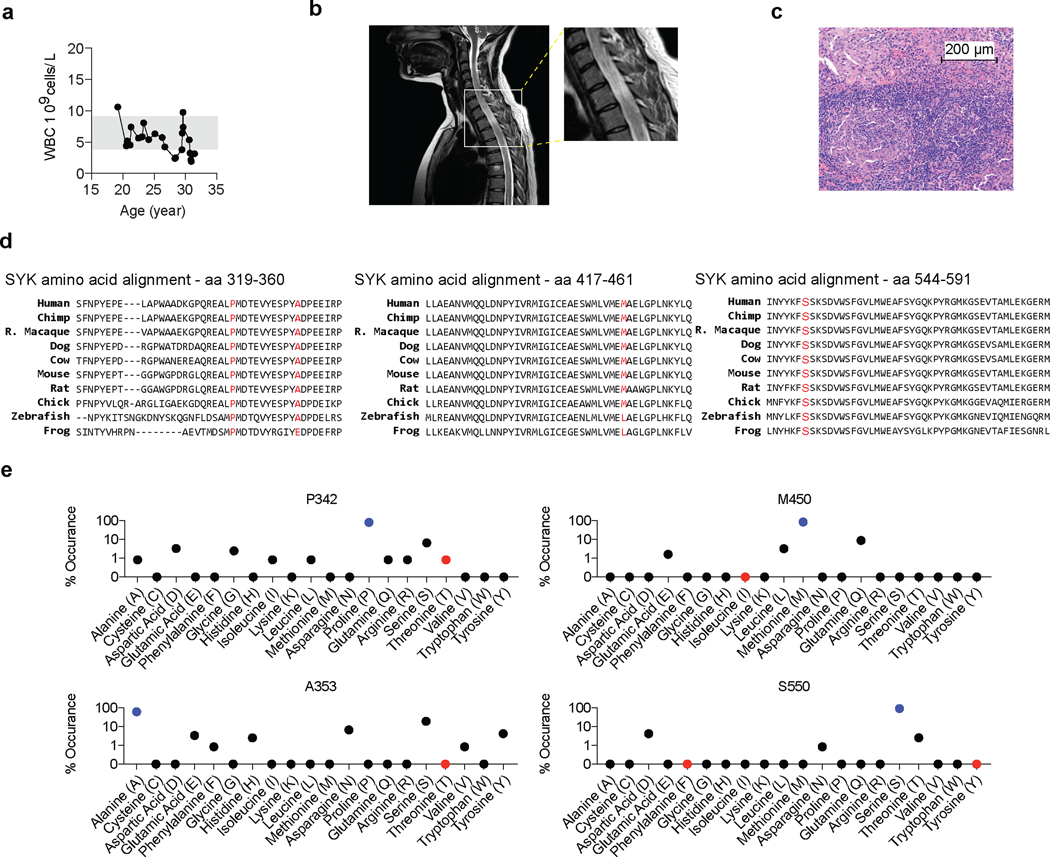
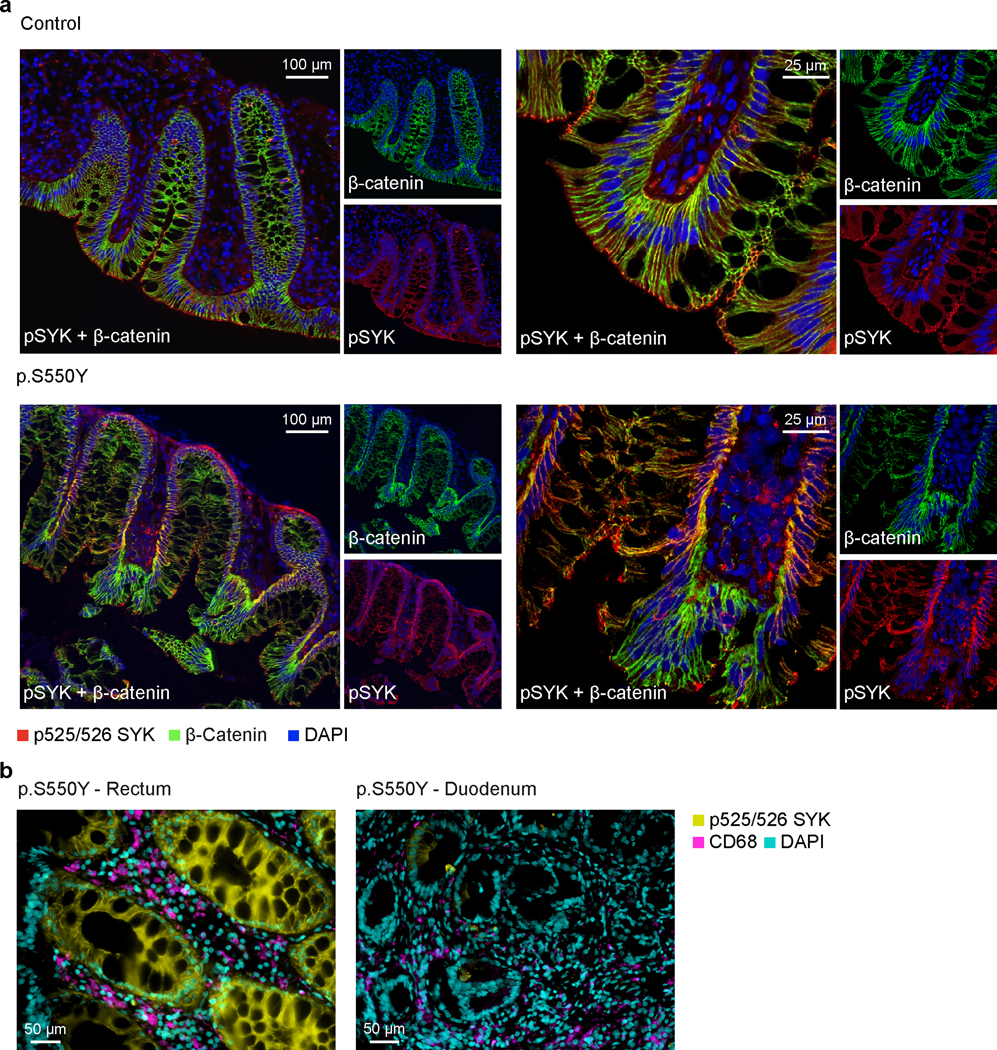
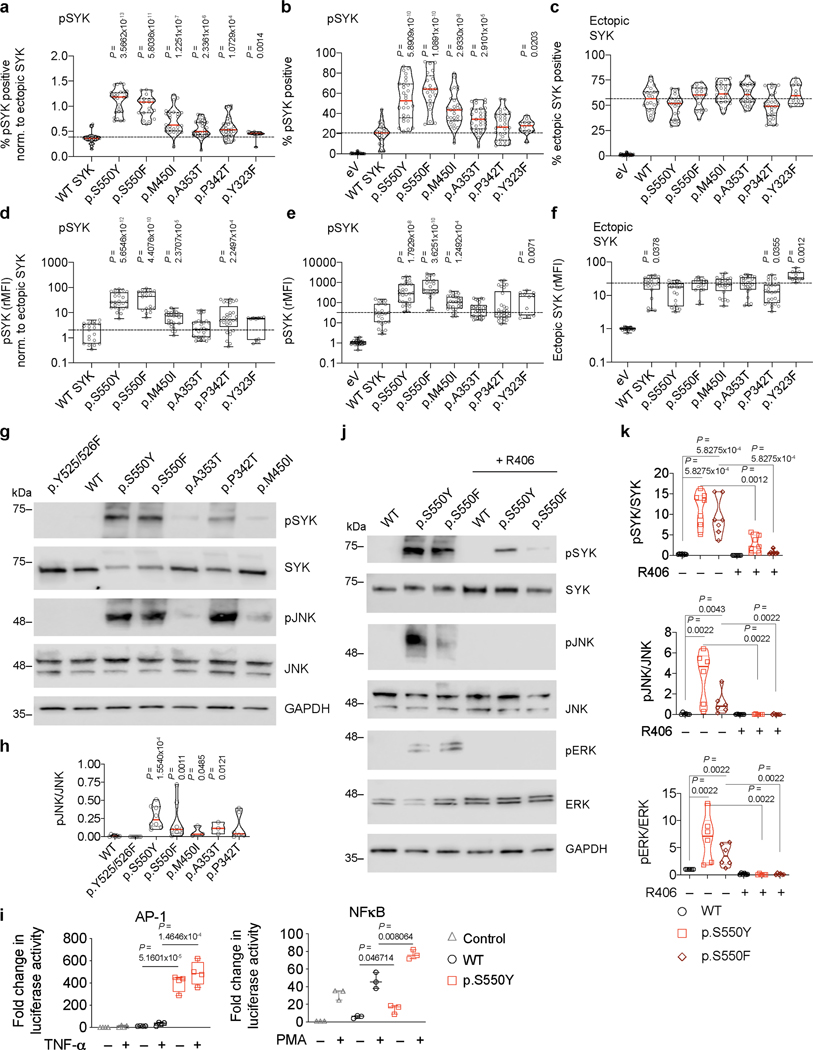
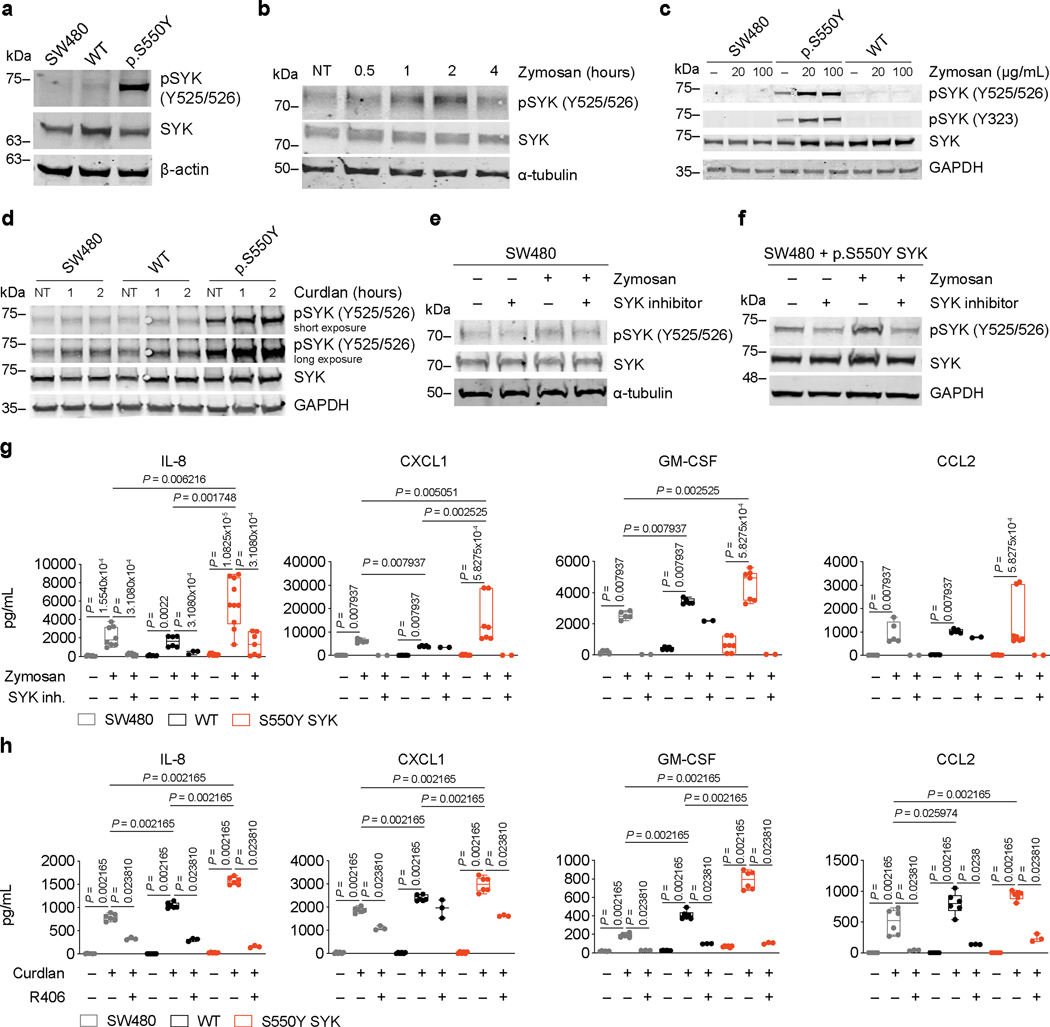
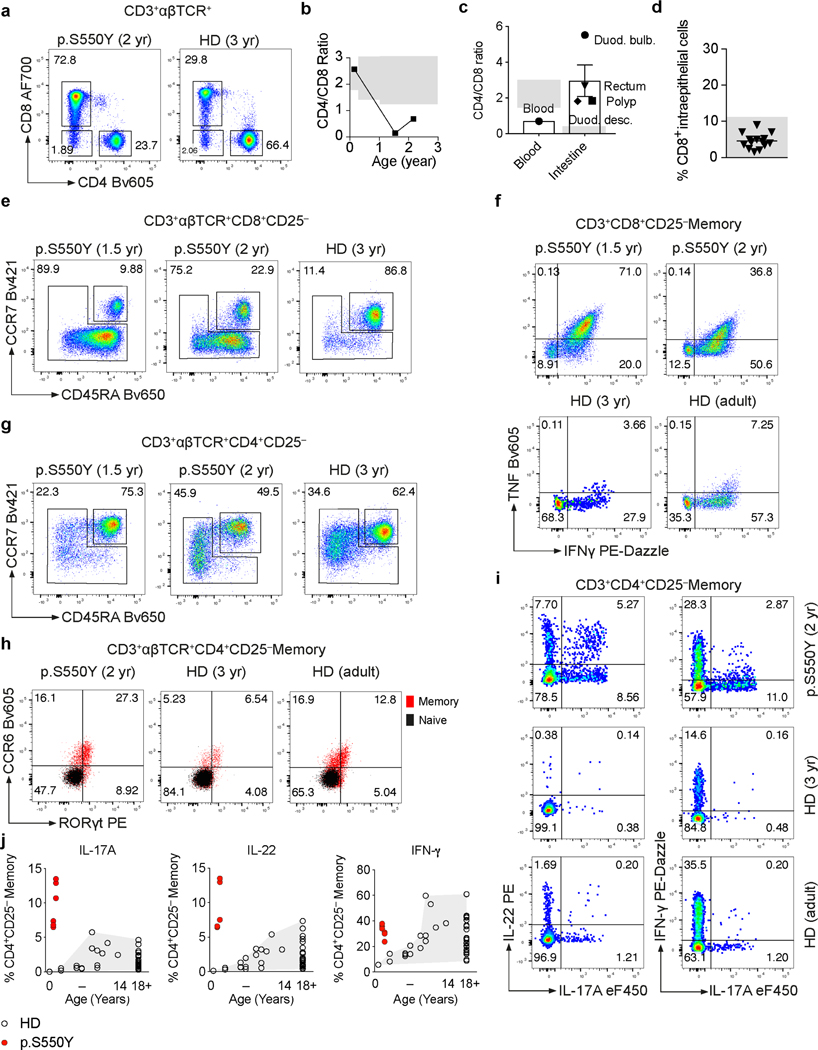
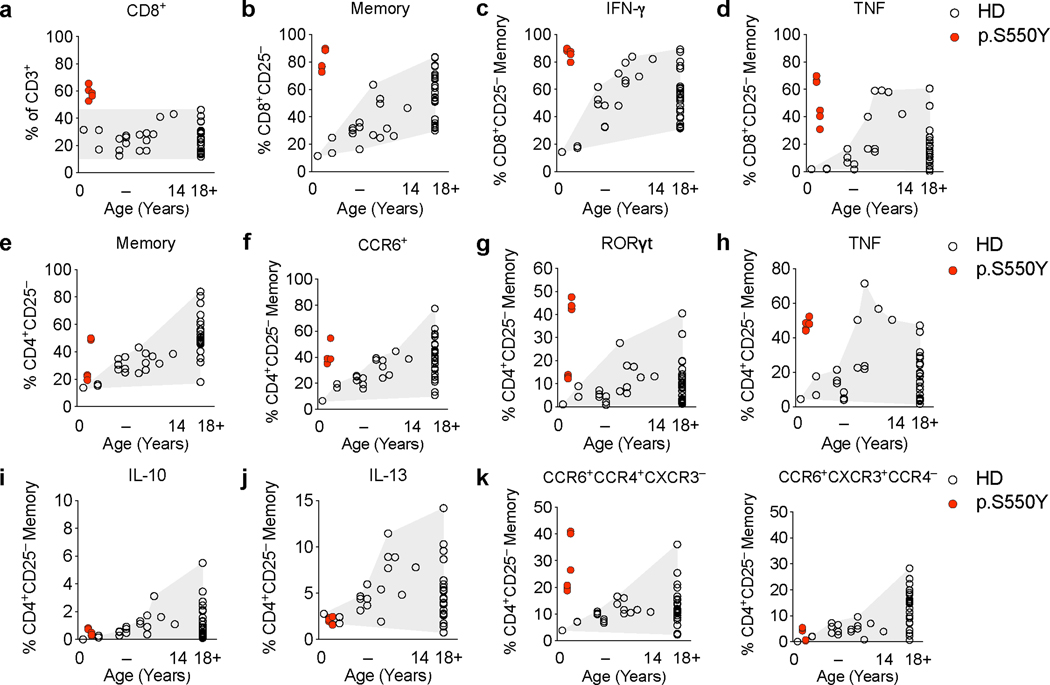
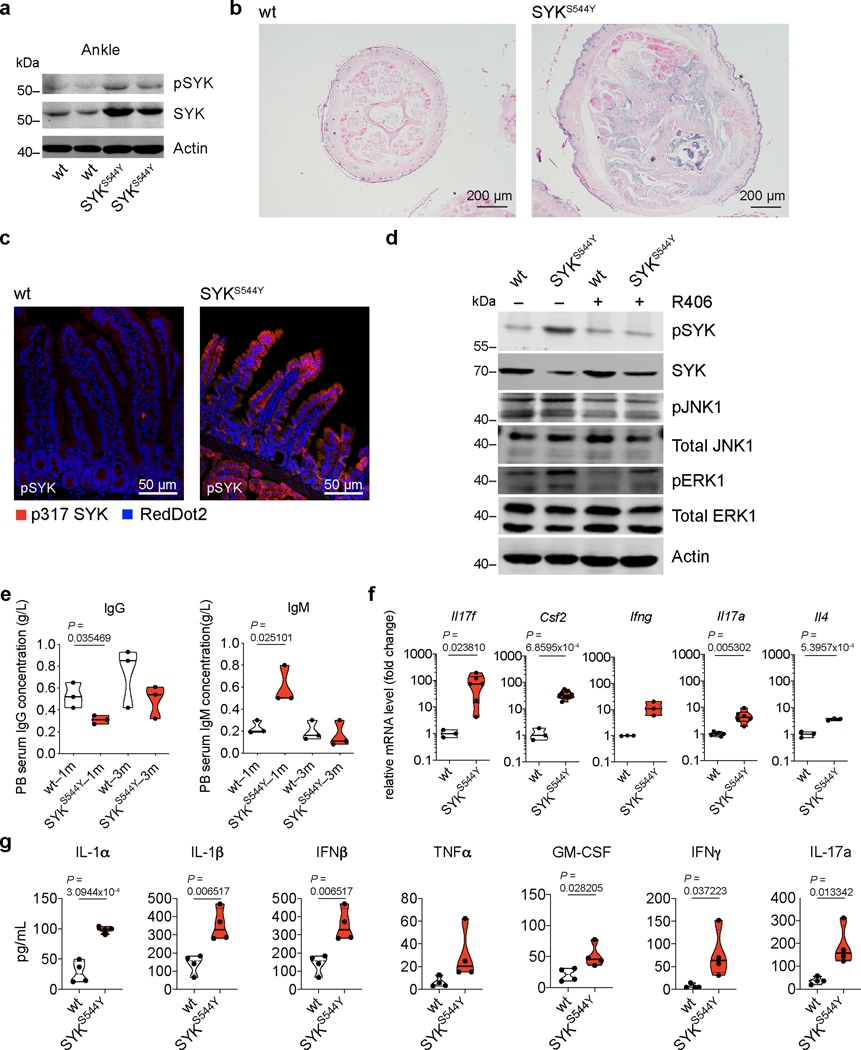
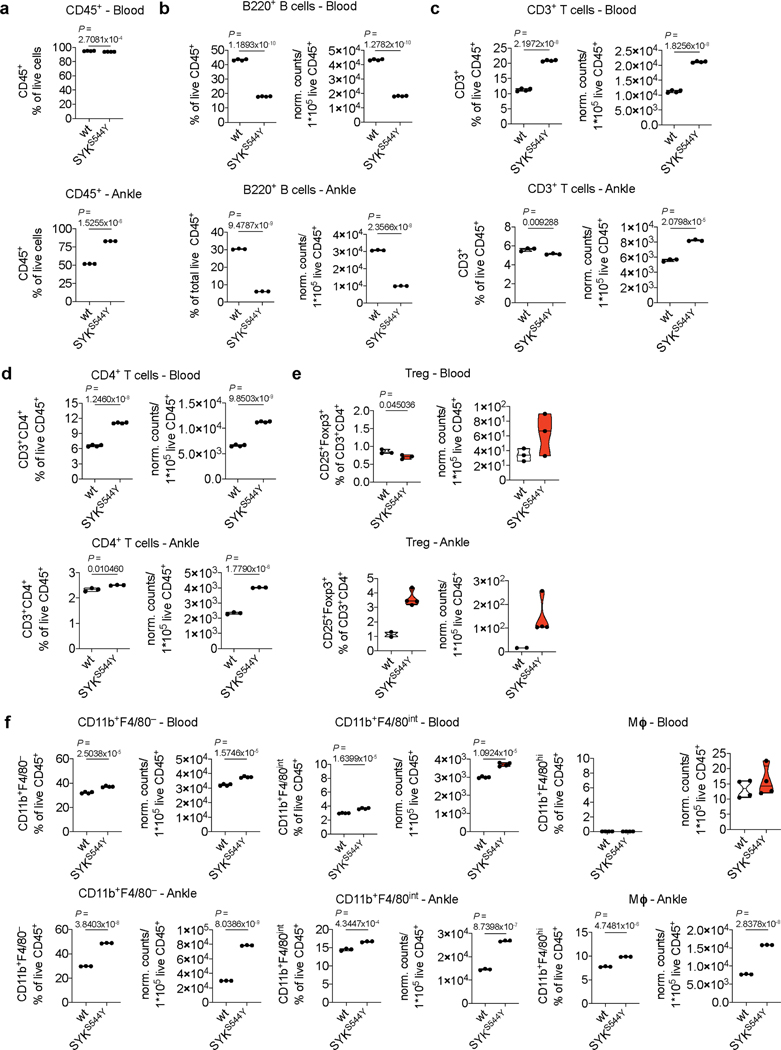
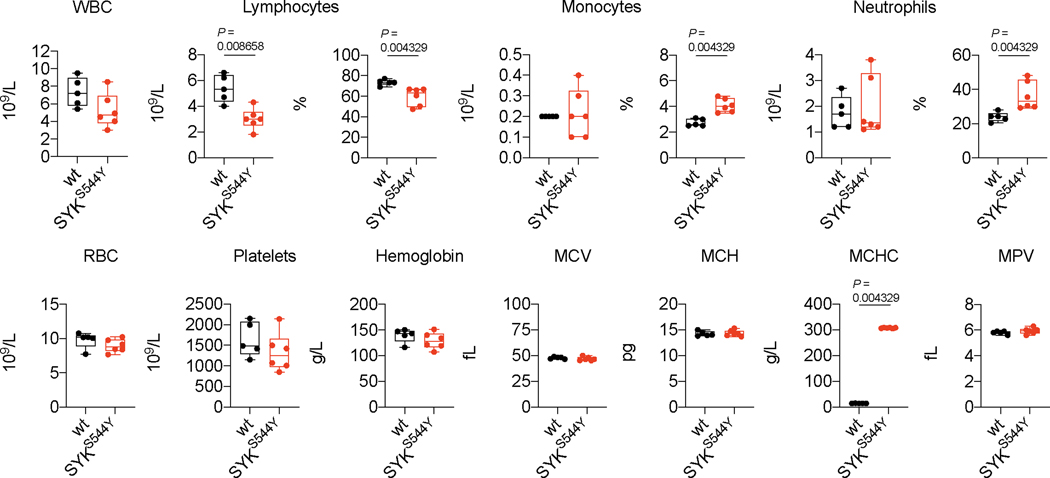
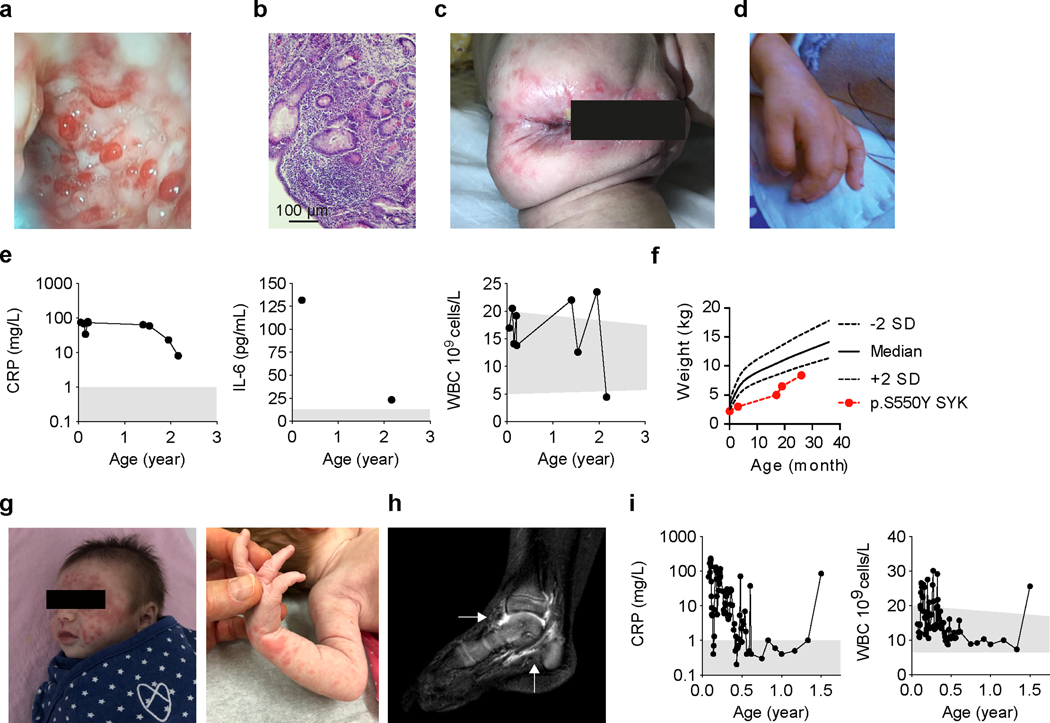
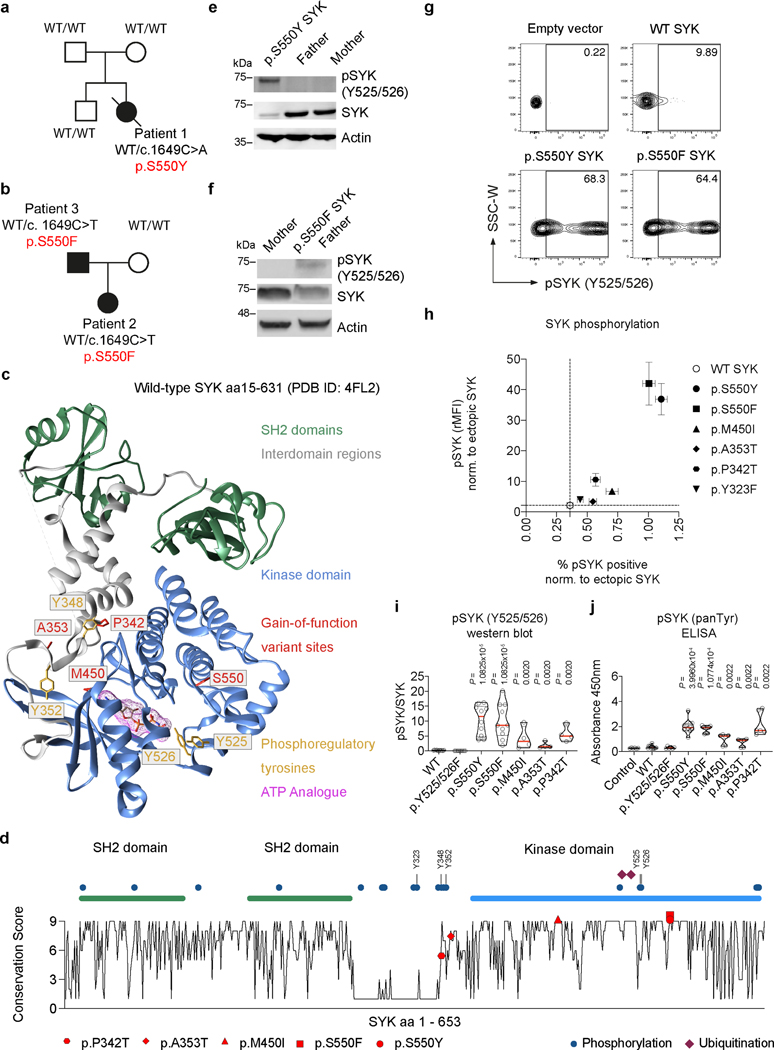
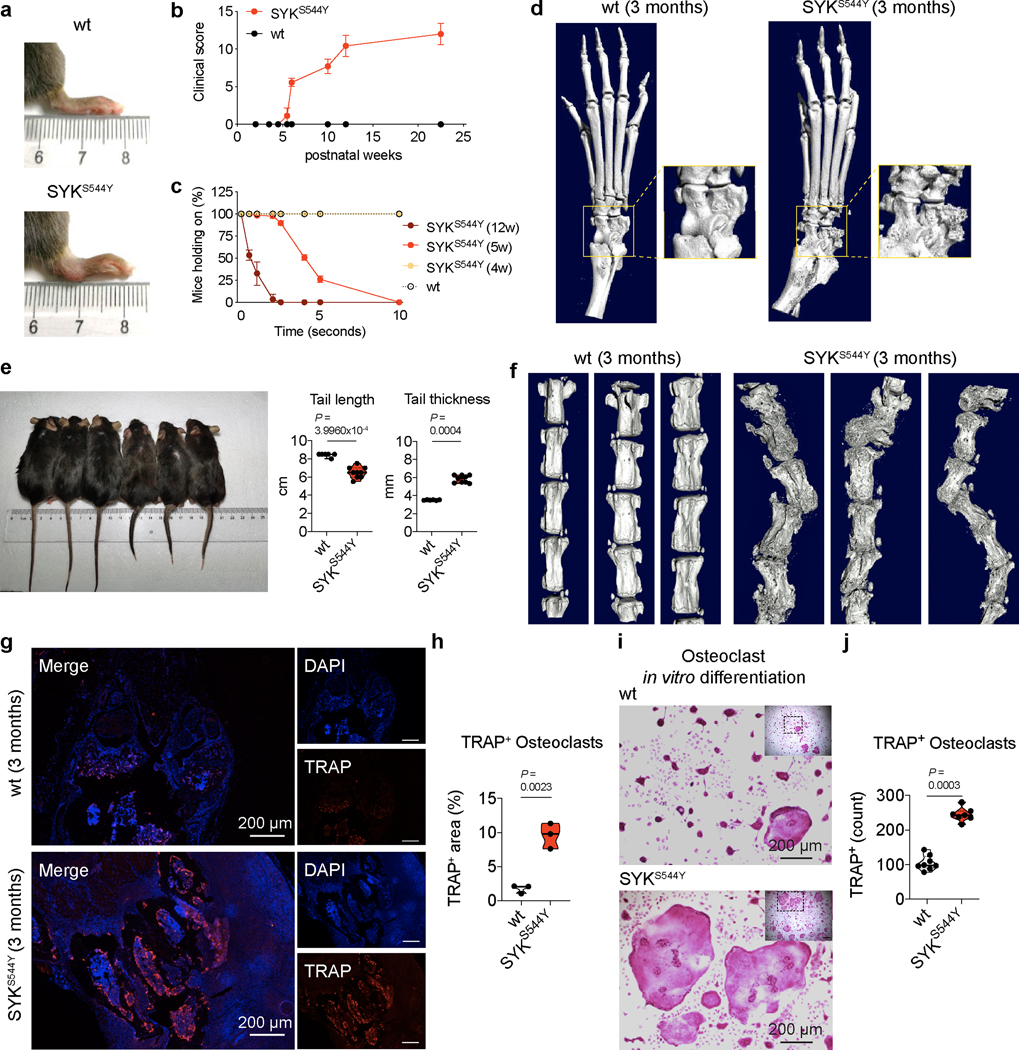
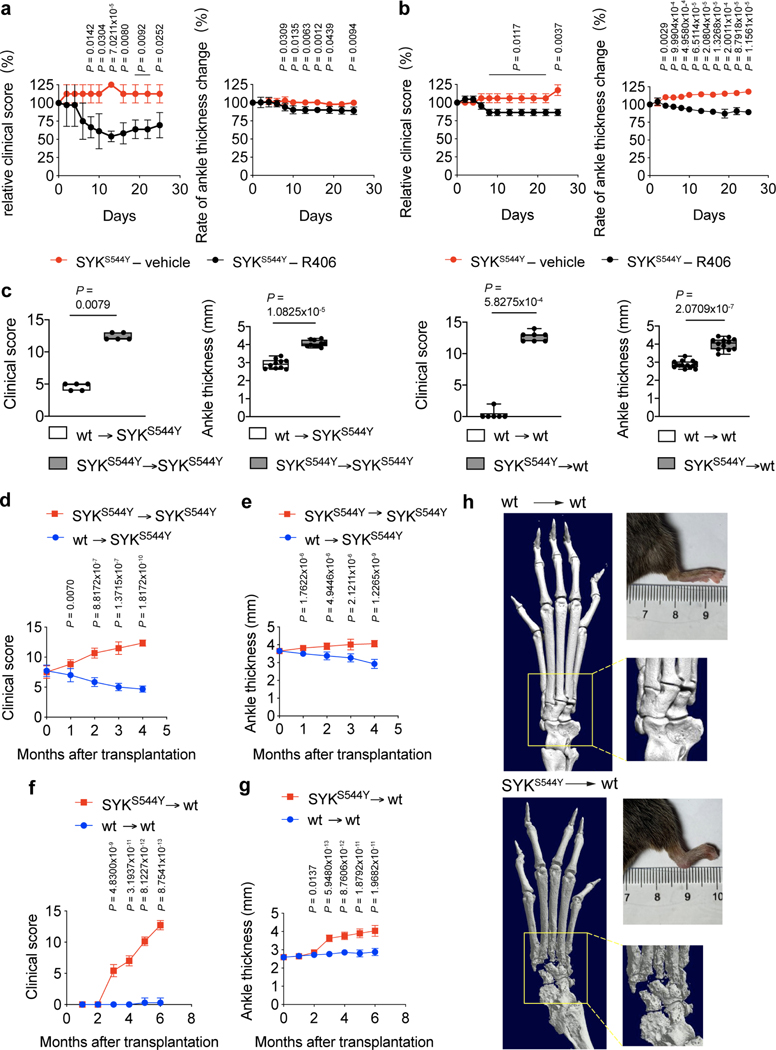
Spleen tyrosine kinase (SYK) is a critical immune signaling molecule and therapeutic target. We identified damaging monoallelic SYK variants in six patients with immune deficiency, multi-organ inflammatory disease such as colitis, arthritis and dermatitis, and diffuse large B cell lymphomas. The SYK variants increased phosphorylation and enhanced downstream signaling, indicating gain of function. A knock-in (SYK-Ser544Tyr) mouse model of a patient variant (p.Ser550Tyr) recapitulated aspects of the human disease that could be partially treated with a SYK inhibitor or transplantation of bone marrow from wild-type mice. Our studies demonstrate that SYK gain-of-function variants result in a potentially treatable form of inflammatory disease.


Figures

Extended Data Fig. 1
Extended Data Fig. 1. Genetic analysis pipeline and validation of heterozygous variants by sanger sequencing.
Variant identification pipeline and Sanger sequencing validation of WES data for (a) Patient 1 (p.S550Y), (b) Patient 2 (p.S550F) and Patient 3 (p.S550F) and (c) Patient 4 (p.P342T). (d) Chronologic disease course and Sanger sequencing validation for Patient 5 (p.M450I) and (e) Patient 6 (p.A353T).
Extended Data Fig. 2
Extended Data Fig. 2. Patient 4 phenotype summary and SYK variants conservation analyses.
(a) Patient 4’s laboratory tests revealed normal white blood cell (WBC) counts. (b) Cervical and thoracic spine MRI of Patient 4 taken at 26 years of age showing a signal enhancing intramedullary space-occupying lesion through nearly the entire length of the cervical and thoracic spinal cord. One representative image out of 6 acquired images is shown. All images revealed signs of inflammation. (c) Spinal cord biopsy with prominent granulomatous inflammation (clinical data, n=1). (d) Species conservation of SYK amino acids p.P342, p.A353, p.M450, and p.S550. (e) Summary of the residue variety in % for each identified variant in SYK across 124 homologues across species following ClustalW-based multiple sequence alignment using the ConSurf server (see Methods). Human wild-type SYK residues are indicated in blue and human SYK variants in red.
Extended Data Fig. 3
Extended Data Fig. 3. SYK hyperphosphorylation in human epithelial cells.
(a) SYK hyper-phosphorylation in intestinal tissue from Patient 1 compared to healthy controls. Double immunostaining of normal and p.S550Y SYK variant colon biopsy sections for pSYK (red), β-catenin (green) and merged dual labeling (yellow). The normal case demonstrated a distinctive glandular apical expression of pSYK. The fine apical signal almost reaches to the microvilli. Scattered infiltrated cells show pSYK staining in lamina propria. Unstained patches of glandular epithelium represent goblet cells. Immunostaining of β-catenin as a structural membrane marker indicates an organized glandular architecture in the normal colon section. Staining for pSYK was evident at the glandular epithelial base (membrane and cytoplasm) in colon sections of the patient. The β-catenin labeling in patient 1 intestinal biopsies presented a disorganized glandular architecture compared to the normal control. One representative image is shown out of 3 total images acquired. (b) Double immunostaining of pSYK and the myeloid marker CD68 in rectal and duodenal biopsy sections of Patient 1 illustrating strong pSYK expression in intestinal epithelial cells with moderate overlap with CD68+ myeloid cells. One representative image is shown out of 6 total images acquired from rectal biopsies and 4 images acquired from duodenal biopsies.
Extended Data Fig. 4
Extended Data Fig. 4. Comparative assays of human SYK variants and reduction of SYK phosphorylation by R406 SYK inhibitor treatment.
(a) Flow cytometry comparison of percent phosphorylated SYK (Y525/526) normalised to ectopic SYK expression in HEK293 cells. (b) Non-normalised data presentation of percent phosphorylated SYK (Y525/526). (c) Percent ectopic SYK expression in HEK293 cells following transfection. (d) Relative mean fluorescence intensity (rMFI) of phosphorylated SYK(Y525/526) normalised to ectopic SYK expression. (e) Non-normalised rMFI of phosphorylated SYK(Y525/526) and (f) rMFI of ectopic SYK (a-f: the dotted line indicates WT median; a-c: quartiles and median; d-f: median and interquartile range and minimum to maximum range; n of independent experiments/n of cell culture replicates: eV(8/30), WT(8/24), p.S550Y(8/28), p.S550F(6/21), p.M450I(8/28), p.A353T(8/30), p.P342T(8/30), p.Y323F(3/12); Mann-Whitney test). (g) Western blot analysis of SYK phosphorylation (Y525/526), total SYK expression, JNK phosphorylation (T183/Y185), total JNK expression and GAPDH expression in HEK293 cells after transfection with control, p.Y525F/Y526F mutated SYK, wild-type SYK and the range of different identified variants in SYK (p.S550Y, p.S550F, p.A353T, p.P342T and p.M450I). (h) Quantification of pJNK normalised to total JNK according to (g) (quartiles and median; n of independent experiments: WT(8), p.Y525/526F(8) p.S550Y(8), p.S550F(8), p.M450I(3), p.A353T(3), p.P342T(6); Mann-Whitney test). (i) Analysis of AP-1 (n=4) or NF-κB (n=3) activity by luciferase reporter assay in HEK293 cells following co-transfection with reporter plasmids and empty vector (Control), WT SYK or p.S550Y SYK and 24 hours stimulation with TNF (20 ng/ml) or PMA (20 ng/ml) (Min-max and median; unpaired t-test). (j) Western blot analysis of SYK phosphorylation (Y525/526), total SYK expression, JNK phosphorylation (T183/Y185), total JNK expression, ERK phosphorylation (T202/Y204), total ERK expression and GAPDH expression in HEK293 cells after transfection with wild-type SYK, p.S550Y SYK and p.S550F SYK in presence or absence of R406 SYK inhibitor (2 μM). (k) Quantification of pSYK (Y525/526) (n=7), pJNK (T183/Y185) (n=6), pERK (T202/Y204) (n=6) western blot signals normalised to the respective total protein expression according to (j) (quartiles and median; Mann-Whitney test).
Extended Data Fig. 5
Extended Data Fig. 5. SYK response to stimulation in intestinal epithelial cells.
(a) Western blot analysis of SYK and pSYK (Y525/526) in SW480 cells transfected with plasmid expressing p.S550Y SYK or WT SYK. (b) Time-course of SYK phosphorylation upon zymosan (200 μg/mL) stimulation by Western blot analysis of SYK and pSYK (Y525/526) in SW480 cells for the indicated time (NT = untreated cells). (c) Western blot analysis of SYK, pSYK (Y525/526) and pSYK (323) in SW480 cells transfected with plasmid expressing p.S550Y SYK or WT SYK left either untreated (–) or stimulated with 20 μg/mL or 100 μg/mL zymosan. (d) Western blot analysis of SYK and pSYK (Y525/526) SW480 cells transfected with plasmid expressing p.S550Y SYK or WT SYK left either untreated (NT) or stimulated with curdlan (100 μg/mL) for the indicated time. (e and f) Western blot analysis of SYK and pSYK (Y525/526) in SW480 (e) or in SW480 cells transfected with plasmid expressing p.S550Y SYK (f), upon stimulation with zymosan (200 μg/mL) for 1 hour, in the presence or absence of SYK inhibitor (5 μM, Calbiochem, #574711) added 1 hour prior to zymosan stimulation. (g) IL-8, CXCL1, GM-CSF and CCL2 secretion by 20 hours zymosan-stimulated SW480 cells expressing WT SYK or p.S550Y SYK. SYK inhibitor (5 μM, Calbiochem, #574711) was added 1 hour prior to zymosan stimulation and analysis performed by ELISA. Median and interquartile range and minimum to maximum range; n of independent experiments/n of cell culture replicates: IL-8: (3/3–10); CXCL1, GM-CSF, CCL2: (2–3/2–7); Mann-Whitney test. (h) IL-8, CXCL1, GM-CSF and CCL2 secretion by SW480 cells expressing WT SYK or p.S550Y SYK cells incubated with/without R406 (5 μM) for 60 mins prior to the addition of curdlan and analyzed by ELISA 20 hours following stimulation. Median and interquartile range and minimum to maximum range; n of independent experiments/n of cell culture replicates: 3/3–6; Mann-Whitney test.
Extended Data Fig. 6
Extended Data Fig. 6. Phenotypic and functional analysis of Patient 1 T cells.
(a) Dot plot presentation of CD4+, CD8+ and double negative (DN) T cell frequencies among CD3+αβTCR+ cells as determined by surface staining and flow cytometry of PBMC from Patient 1 at 2 years of age and a 3 year-old healthy donor (HD). (b) Kinetics of CD4/CD8 ratio based on clinical laboratory measurements. (c) CD4/CD8 ratio as estimated from patient intestinal biopsy sections stained for CD3 and CD8 by immunohistochemistry. (d) Intraepithelial CD8+ T cell counts in patient intestinal tissue sections manually counted based on CD4 and CD8 immunofluorescence staining. (e) Dot plot presentation of CD3+αβTCR+CD8+CD25 naïve and memory T cell frequencies as assessed by surface staining of CD45RA and CCR7. (f) Dot plot presentation of TNF and IFN-γ producing CD3+αβTCR+CD8+CD25 memory T cell frequencies as assessed by intracellular cytokine staining. (g) CD3+αβTCR+CD4+CD25 naïve and memory T cell frequencies as assessed by surface staining of CD45RA and CCR7 and flow cytometry analysis. (h) Dot plot presentation of CD3+αβTCR+CD4+CD25 memory CCR6+RORγt+ T cell frequencies as assessed by combined surface and intracellular staining. (i) Presentation of IL-17A, IL-22 and IFN-γ producing CD3+CD4+CD25 memory T cell frequencies. (j) Summary of IL-17A-, IL-22- and IFN-γ-producing CD3+CD4+CD25 memory T cell frequencies as assessed by intracellular cytokine staining following 5 hrs PMA (0.2 μM) and Ionomycin (1 μg/mL) stimulation. Grey areas indicate healthy donor control ranges.
Extended Data Fig. 7
Extended Data Fig. 7. Phenotypic and functional analysis of Patient 1 T cells.
(a) Summary of CD3+CD8+ T cell frequencies of adult healthy donors (HD) (HD adult: n = 26) and 9 months to 14 years old HD (HD 9 month to 14 years: n = 17) and of Patient 1 at 1.5 years and 2 years of age (n = 2, each 3 technical replicates) expressed as percent of live CD3+ T cells. (b) Summary of CD3+CD8+CD25 memory T cell frequencies as assessed by surface staining of CD45RA and CCR7. (c and d) Summary of IFN-γ- (c) and TNF-producing (d) CD3+CD8+CD25 memory T cell frequencies as assessed by intracellular cytokine staining following 5 hours PMA (0.2 μM) and Ionomycin (1 μg/mL) stimulation. (e) Summary of CD3+CD4+CD25 memory T cell frequencies as assessed by surface staining of CD45RA and CCR7. (f) Summary of CD3+CD4+CD25CCR6+ memory T cell frequencies as assessed by surface staining. (g) Summary of CD3+CD4+CD25RORγt+ memory T cell frequencies as assessed by combined surface and intracellular staining. (h, i and j) Summary of TNF- (h), IL-10- (i) and IL-13-producing (j) CD3+CD4+CD25 memory T cell frequencies as assessed by intracellular cytokine staining following 5 hours PMA (0.2 μM) and Ionomycin (1 μg/mL) stimulation. (k) CCR6+CCR4+CXCR3 (Th17-enriched) and CCR6+CXCR3+ CCR4 (Th1/Th17-enriched) CD3+CD4+CD25 memory T cell frequencies as assessed by surface staining and flow cytometry.
Extended Data Fig. 8
Extended Data Fig. 8. Phenotypic and functional characterization of SYKS544 mice.
(a) Immunoblot analysis of SYK and pSYK protein levels in ankle of 3 months old mice (wt: n=3; SYKS544Y: n=3). (b) Hematoxylin and eosin stain of tail tissue sections from 3 months old wild-type and SYKS544 mice showing bone erosion and immune cell infiltration (wt: n=3; SYKS544Y: n=3). (c) Hyper-phosphorylation of SYK in intestinal tissue from SYKS544 mice compared to wild-type mice (wt: n=3; SYKS544Y: n=3). (d) Western blot analysis of wild-type and SYKS544 bone marrow derived dendritic cells SYK phosphorylation (Y519/520), total SYK expression, JNK1 (T183/Y185) phosphorylation, total JNK1 expression, ERK1 phosphorylation (T203/Y205) and total ERK1 expression treated or not treated with R406 SYK inhibitor (2 μM, R406 was added 30 minutes prior to LPS (200 ng/mL) stimulation and samples collected after 24 hours) (wt: n=3; SYKS544Y: n=3). (e) Analysis of IgG and IgM in serum from wild-type and SYKS544Y mice by ELISA at indicated age (n=3; Unpaired t-test). (f) RT–qPCR analysis of Il17f (wt: n=3; SYKS544Y: n=6), Csf2 (wt: n=3; SYKS544Y: n=9), Ifng (wt: n=3; SYKS544Y: n=3), Il17a (wt: n=6; SYKS544Y: n=6) and Il4 (wt: n=3; SYKS544Y: n=3) expression in blood at the age of 3 months. Unpaired t-test. (g) Serum cytokine concentrations in wild-type and SYKS544Y mice at 3 months of age measured by ELISA (n=4; unpaired t-test). Violin plots indicate quartiles and median.
Extended Data Fig. 9
Extended Data Fig. 9. Phenotype of immune cells in circulation and tissue of a CRISPR-Cas9-knock-in SYKS544Y mouse model.
(a) Frequencies of live CD45+ cells in blood (top) and ankles (bottom) of wild-type and SYKS544Y mice (blood: n=4, ankle: n=3; unpaired t-test) at the age of 3 months. (b-f) Frequencies and normalised counts of B220+ B cells, CD3+ T cells, CD4+ T cells, Foxp3+CD25+ regulatory T cells (Treg), CD11b+F4/80 mononuclear phagocytes, CD11b+F4/80int mononuclear phagocytes and CD11b+F4/80+ macrophages (Mɸ) in blood (top) and ankles (bottom) of wild-type and SYKS544Y mice at the age of 3 months (blood: n=4, ankle: n=3; Treg-blood: n=3, Treg-ankle (wt): n=2, Treg-ankle (SYKS544Y): n=4; unpaired t-test). Normalised counts were calculated as counts/1*105 live CD45+ cells relative to the average change in live CD45+ cells comparing wild-type and SYKS544Y mice. Violin plots indicate quartiles and median.
Extended Data Fig. 10
Extended Data Fig. 10. Full blood counts of wild-type and CRISPR-Cas9-knock-in SYKS544Y mice.
Full blood counts of wild-type (n=5) and SYKS544Y (n=6) mice; Mann-Whitney test. Box plots and whiskers indicate median and interquartile range and minimum to maximum range. MCV: mean corpuscular volume; MCH: mean corpuscular haemoglobin; MCHC: mean corpuscular haemoglobin concentration; MPV: mean platelet volume.
Figure 1.
Figure 1.. Clinical phenotype and identification of variants in SYK.
(a) Colonoscopy of Patient 1 showed multiple ulcers in the colon at 17 months of age. (b) Histological analysis showing active intestinal inflammation including focal distortions of crypts and increased cellular infiltration in the lamina propria (clinical data, n=1). Clinical features in Patient 1 included (c) perianal disease and (d) edematous hand swelling (n=1). (e) Patient 1 laboratory tests showed elevated CRP, WBC counts and elevated serum IL-6. (f) Growth chart at different ages using weight versus age percentile based on World Health Organization criteria . (g) Vasculitis rash observed in Patient 2. (h) Sagittal post-gadolinium T1-weighted fat-suppression magnetic resonance imaging of the right ankle demonstrating synovitis of the tibiotalar and subtalar joints (indicated by white arrows) of Patient 2. (i) Patient 2 laboratory tests showed episodes of increased CRP and WBC counts. Grey areas indicate healthy donor control ranges.
Figure 2.
Figure 2.. Functional characterization of SYK variants
(a and b) Pedigree and SYK variant in Patients 1 to 3. (c) Structural model of wild-type human SYK (PDB ID: 4FL2), highlighting the sites of SYK gain-of-function variants (p.P342T, p.A353T, p.M450I, p.S550F and p.S550Y), the ATP binding pocket (occupied by an ATP analogue), and key phosphoregulatory tyrosine residues that determine SYK activity. (d) Graphical illustration of SYK sequence conservation (black line) based on ConSurf conservation score (see Methods). Domain structure, phosphorylation sites (blue dots), ubiquitination sites (dark red squares) and positions of identified patient variants (coloured triangles) are indicated. (e and f) Total and phosphorylated SYK expression in PBMC from family 1 and 2 by western blot (representative blots are shown of 3 independent repeats). (g) Contour plot presentation of pSYK (Y525/526) expression in HEK293 cells transfected with an empty vector, wild-type SYK or mutated p.S550Y or p.S550F SYK assessed by intracellular staining and flow cytometry. (h) SYK phosphorylation in wild-type SYK or mutated SYK assessed by intracellular staining and flow cytometry. Data are shown as normalised relative mean fluorescence intensity (rMFI) of pSYK (Y525/526) to ectopically expressed SYK (y-axis) and normalised % of pSYK positive cells (x-axis) to ectopically expressed SYK; (mean±SD; n of independent experiments/n of cell culture replicates: eV(8/30), WT(8/24), p.S550Y(8/28), p.S550F(6/21), p.M450I(8/28), p.A353T(8/30), p.P342T(8/30), p.Y323F(3/12)). (i) Quantification of western blot analysis of total and phosphorylated levels of SYK (Y525/526) in HEK293 cells according to Extended Data Fig. 4g. (j) SYK phosphorylation (panTyr) in HEK293 cells expressing an empty vector (Control), wild-type SYK (WT) or the diverse range of SYK variants identified in patients as measured by ELISA. i and j: quartiles and median; n of independent experiments: WT(10), p.Y525/526F(10) p.S550Y(10), p.S550F(10), p.M450I(4), p.A353T(4), p.P342T(4). Mann-Whitney test.
Figure 3.
Figure 3.. Phenotype of SYKS544Y mouse model
(a) Photographs of the hind limb of wild-type (top, n=6) and SYKS544Y (bottom, n=6) mice at the age of 3 months. (b) Quantification of arthritis severity by clinical score at the indicated age (n=7). (c) Percentages of mice that were able to hold on to the grid at the indicated time points after the grid was flipped over. The experiment was repeated 15–20 times per mouse (n=5). (d) Representative micro-CT images of the ankle joints of wild-type (left, n=6) and SYKS544Y (right, n=6) mice at the age of 3 months. Boxed areas show higher digital magnifications. (e) Photograph and quantification of wild-type (left) and SYKS544Y (right) mice tails at the age of 3 months. Wild-type: n=6; SYKS544Y n=9. Mann-Whitney test. (f) Micro-CT image of the tails of wild-type (left, n=3) and SYKS544Y (right, n=3) mice at the age of 3 months. (g) Representative image of immunofluorescence-based analysis of Tartrate-resistant acid phosphatase (TRAP) expression in wild-type (top) and SYKS544Y (bottom) mice ankle tissue. (h) Quantification of the TRAP+ area in wild-type (top) and SYKS544Y (bottom) mice ankle tissue according to (g) (n=3; unpaired t-test). (i) Representative TRAP staining of bone marrow derived macrophages wild-type and SYKS544Y mice cultured with M-CSF (10 ng/mL) and RANKL(50 ng/mL)for 8 days. (j) Quantification of counts of in vitro generated TRAP+ osteoclasts according to (i). Mature osteoclasts were identified as multinucleated (>3 nuclei) TRAP+ cells. Wild-type: n=8; SYKS544Y n=7. Mann-Whitney test. b and c: mean±SD. e, h and j: quartiles and median.
Figure 4.
Figure 4.. Treatment and bone marrow transplant experiments in SYKS544Y mice
(a and b) Relative change of clinical score (left) and ankle thickness (right) of SYK inhibitor-treated (R406) (a) 1-month-old mice (n=3) and (b) 3-months-old mice (n=3). Unpaired t-test. (c) Change of clinical score and ankle thickness in 10-weeks-old irradiated (7.5 Gy) wild-type or SYKS544 mice transplanted with SYKS544 bone marrow or wild-type (age=4 months) bone marrow. Numbers of mice from left to right: n=5; n=10; n=6; n=12. Mann-Whitney test. (d and e) Change of (d) clinical score (n=6) and (e) ankle thickness (n=10) in 10-weeks-old irradiated (7.5 Gy) SYKS544 mice transplanted with SYKS544 bone marrow or wild-type (age=4 months) bone marrow over time. (f and g) Change of (f) clinical score (n=7) and (g) ankle thickness (n=12) in 10-weeks-old irradiated (7.5 Gy) wild-type mice transplanted with wild-type or SYKS544 bone marrow (age = 4 months). Unpaired t-test. (h) Micro-CT image of the ankle joints of wild-type (left) and SYKS544Y (right) mice 6 months after bone marrow transplantation (boxed areas show higher digital magnifications), and photographs of the hind limb of wild-type (left panel upper right) and SYKS544Y (right panel upper right) mice 6 months after bone marrow transplantation. Line plots indicate mean±SD. Box and whiskers plots indicate median and interquartile range and minimum to maximum range.

Comment in

Similar articles

Cited by

References

    1. Mocsai A, Ruland J & Tybulewicz VL The SYK tyrosine kinase: a crucial player in diverse biological functions. Nat Rev Immunol 10, 387–402 (2010). - PMC - PubMed
    1. Dennehy KM et al. Syk kinase is required for collaborative cytokine production induced through Dectin-1 and Toll-like receptors. Eur J Immunol 38, 500–6 (2008). - PMC - PubMed
    1. Turner M. et al. Perinatal lethality and blocked B-cell development in mice lacking the tyrosine kinase Syk. Nature 378, 298–302 (1995). - PubMed
    1. Cheng AM et al. Syk tyrosine kinase required for mouse viability and B-cell development. Nature 378, 303–6 (1995). - PubMed
    1. Jakus Z, Simon E, Balazs B & Mocsai A. Genetic deficiency of Syk protects mice from autoantibody-induced arthritis. Arthritis Rheum 62, 1899–910 (2010). - PMC - PubMed

Publication types

MeSH terms