. 2021 Apr;28(4):388-397.
doi: 10.1038/s41594-021-00575-9. Epub 2021 Mar 29.

A chemical genetics approach to examine the functions of AAA proteins

Affiliations

A chemical genetics approach to examine the functions of AAA proteins

Tommaso Cupido et al. Nat Struct Mol Biol. 2021 Apr.

Abstract

The structural conservation across the AAA (ATPases associated with diverse cellular activities) protein family makes designing selective chemical inhibitors challenging. Here, we identify a triazolopyridine-based fragment that binds the AAA domain of human katanin, a microtubule-severing protein. We have developed a model for compound binding and designed ASPIR-1 (allele-specific, proximity-induced reactivity-based inhibitor-1), a cell-permeable compound that selectively inhibits katanin with an engineered cysteine mutation. Only in cells expressing mutant katanin does ASPIR-1 treatment increase the accumulation of CAMSAP2 at microtubule minus ends, confirming specific on-target cellular activity. Importantly, ASPIR-1 also selectively inhibits engineered cysteine mutants of human VPS4B and FIGL1-AAA proteins, involved in organelle dynamics and genome stability, respectively. Structural studies confirm our model for compound binding at the AAA ATPase site and the proximity-induced reactivity-based inhibition. Together, our findings suggest a chemical genetics approach to decipher AAA protein functions across essential cellular processes and to test hypotheses for developing therapeutics.


Figures
Extended Data Fig. 1
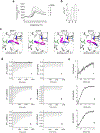
Extended Data Fig. 1. Characterizing the binding mode of triazolopyridinebased compounds to katanin
(a-b) DSF traces (a) and changes in melting temperatures (ΔTm, b) for katanin AAA domain wild type in the presence of compounds 14 (500 μM, n = 2). As a reference, the corresponding trace for control is shown (5% DMSO, dashed line, analogous to data in Fig. 1d). (c) Four computational docking models for compound 1 (purple and blue, stick representation) bound to the katanin nucleotidebinding site (gray, ribbon representation). Variability hotspot residues are shown (stick representation, color-coded as in Fig. 1a). Other key amino acids in the katanin ATP-binding site are also shown (gray, stick representation). Pose 1 corresponds to the one in Fig. 2e. (d) Isothermal Titration Calorimetry (ITC)-based analyses of kata-AAA-WT in the presence of compounds 1–3. Raw injection heats are shown for titrations of compounds 1–3 against kata-AAA-WT (left panels), or blank titrations into buffer (right panels). Compound 4 could not be analyzed under similar conditions due to limited solubility. (e) Integrated data points and fitted binding curves used to determine Kd values. Data for graphs in (a-b) and (d-e) are available as source data.
Extended Data Fig. 2
Extended Data Fig. 2. Engineering the active site of katanin to obtain an allele sensitized to covalent inhibitors
(a) Primary sequence of the katanin N-loop motif, which contains D210. (b) Partial sequence alignment of AAA proteins showing the residues in the N-loop motif (D210 is indicated by the arrow, alignment generated using Clustal Omega). (c) Schematic showing the AAA domain (light gray box, not to scale), and the first and last residues of the ATPase active human katanin construct. The position of the D210C mutation is indicated by the red bar. (d) Differential scanning fluorimetry of kataninWT and katanin-D210C in the absence and presence of ADP (1 mM) (n = 2 independent experiments). One representative experiment is shown. (e) SDS-PAGE gels of purified recombinant L211C and T250C X. laevis katanin mutant constructs (Coomassie blue staining). Data for the graph in (d) and the unmodified gel picture for (e) are available as source data.
Extended Data Fig. 3
Extended Data Fig. 3. Characterization of kata-WT and kata-D210C cell lines and additional analyses of ASPIR-1
(a) Full blots for Fig. 4a. Doxycycline (10 ng/mL, 14 hours) was used to induce expression and blot was stained for katanin (left panel) and GAPDH (right panel) as a loading control. The positions of the bands expected for the EGFPkatanin construct and the endogenous katanin (black and gray arrows, respectively), or GAPDH (black dotted arrow) are indicated. A representative blot is shown (n = 2 independent cell cultures per cell line). (b-c) Maximum intensity confocal projections show EGFP distribution in interphase (b) and dividing (c) HeLa cells expressing WT or D210C EGFPkatanin. Representative images are shown (n = 2 independent experiments, 10 images acquired per experiment). (d) Kata-WT cells were incubated with different concentrations of ASPIR-1 for 24 h and viability was measured using a CellTiter-Glo Luminescent Cell Viability Assay. Data are mean ± s.d., n = 3 independent experiments. (e) Microtubule organization in fixed kata-WT cells treated for 4 hours with ASPIR-1 (1.25 μM) or control (DMSO, 0.1%) and stained for α-tubulin. Representative images, identically contrasted maximum intensity projections are shown (n = 3 independent experiments, 10 images acquired per condition per experiment, scale bar =10 μm). The uncropped blots for (a) and data for the graph in (d) are available as source data.
Extended Data Fig. 4
Extended Data Fig. 4. Effect of the inhibitorsensitizing Aspto-Cys mutation on the AAA proteins VPS4B and FIGL1
(a) SDS-PAGE analysis of purified recombinant human wild type (WT) and mutant (D135C) HSVPS4B constructs, and wild type and mutant (D402C) FIGL1 constructs (Coomassie blue staining). (b) Percentage steady-state ATPase activity of FIGL1 and HS-VPS4B (WT) in the presence of ASPIR-1 (5 μM, 1 mM MgATP, 30 min incubation; data represent mean ± s.d., n = 3 independent experiments). (c-d) ATP-concentration dependence of the steady-state activity of WT and D135C HS-VPS4B (c), and WT and D402C FIGL1 (d) analyzed using an NADH-coupled assay. Rates were fit to the Michaelis–Menten equation for cooperative enzymes (mean ± range, n = 2 independent experiments for HS-VPS4B-WT and HS-VPS4B-D135C; mean ± s.d., n = 5 independent experiments for FIGL1-WT, n = 7 independent experiments for FIGL1-D402C). Kinetic parameters were determined: kcat = 1.7 ± 0.1 s−1, K1/2 = 0.12 ± 0.07 mM for HS-VPS4B-WT; kcat = 0.5 ± 0.1 s−1, K1/2 = 0.15 ± 0.01 mM for HS-VPS4B-D135C; kcat = 3.4 ± 0.4 s−1, K1/2 = 0.2 ± 0.1 mM for FIGL1-WT; kcat = 2.3 ± 0.5 s−1, K1/2 = 0.3 ± 0.1 mM for FIGL1-D402C. (e-f) Differential scanning fluorimetry of WT and D135C HS-VPS4B (e) and WT and D402C FIGL1 (f) in the absence and presence of ADP (1 mM) (5% DMSO for both conditions). One representative experiment is shown (n = 2 independent experiments). The unmodified gel images for (a) and data for the graphs in (b-f) are available as source data.
Extended Data Fig. 5
Extended Data Fig. 5. Inhibition of VPS4B-D135C by ASPIR-2
(a) SDS-PAGE analysis of purified recombinant human wild type (WT) and mutant (D135C) VPS4B (tagless), and VTA1 constructs (Coomassie blue staining). (b) ATPconcentration dependence of the steady-state activity of VPS4B-WT and VPS4B-D135C in the presence of 2-fold excess VTA1, analyzed using an NADH-coupled assay. Rates were fit to the Michaelis–Menten equation for cooperative enzymes (mean ± range, n = 2 independent experiments). (c) Chemical structure of ASPIR-2, analog used for x-ray crystallography studies. (d) Time-dependent inhibition of the ATPase activity of VPS4B-D135C by ASPIR-2. Graph shows percentage residual ATPase activity (mean ± range, n = 2 independent experiments). (e) Concentrationdependent inhibition of the VTA1-stimulated, steady-state ATPase activity of WT and D135C VPS4B after 30 min incubation with ASPIR-2 (1 mM MgATP; data represent mean ± range, n = 2 independent experiments). (f) 2Fo-Fc electron density map of the crystal structure of VPS4B-D135C bound to ASPIR-2, contoured at 2.0 σ. (g) Overlay of the structure of VPS4BD135C in complex with ASPIR-2 with the binding model for compound 1 bound to katanin, at the nucleotide binding site (ASPIR-2: purple and blue, compound 1: pink and blue, stick representation; VPS4B-D135C: gray, katanin: white, ribbon representation; VPS4B residue Cys-135 is also shown). The unmodified gel image for (a) and data for the graphs in (b) and (d-e) are available as source data.
Figure 1:
Figure 1:. Engineering biochemically silent mutations in the ATP-binding site of katanin.
(a) Schematic showing variability hot-spot residues in the katanin nucleotide-binding site. (b) Schematic showing the AAA domain (light gray box, not to scale), the first and last residues, and the residues that were mutated in katanin’s AAA domain (bars, colored as in (a)). (c) SDS-PAGE gel of purified wild type and mutant human katanin AAA domain (aa 171–491, Coomassie blue staining). (d) Differential scanning fluorimetry (DSF) traces for katanin AAA domain wild type in the presence or absence of ADP (1 mM). (5% DMSO in both conditions). Dashed lines indicate inflection points. (e) Thermal stability of wild type (WT) and mutant katanin AAA domain constructs analyzed using differential scanning fluorimetry (DSF). The graph shows melting temperatures (Tm) (colored as in a, with WT in gray) in the absence (triangles) and presence (circles) of ADP (1 mM), with mean values indicated by black bars (n ≥ 3 independent experiments). Mean Tm values for WT are indicated by dashed lines (red, control; gray, ADP; n = 3 independent experiments). The unprocessed gel image for (c) and data for graphs in (d-e) are available as source data.
Figure 2:
Figure 2:. Using RADD to analyze the binding of triazolopyridine-based compounds to katanin.
(a) Chemical structures of compounds 1 – 4. (b) Graph shows the difference in Tm values (ΔTm) in the presence of compound 1 (500 μM) vs. control (DMSO) for katanin AAA domain wild type (WT) and four mutants (n=3 independent experiments, black bar indicates mean). (c) Relation between ΔTm and dissociation constants (KD) measured by isothermal titration calorimetry (ITC) for compounds 1–3 (500 μM). For compound 4 KD could not be measured and the dashed line indicates ΔTm. For ΔTm, data represent mean ± s.d. for compound 1 (n = 3 independent experiments) and mean ± range for compounds 2 and 3 (n = 2 independent experiments). For KD, data represent fitted values and error bars denote fitting error (one experiment). (d) Effect of katanin AAA domain mutations on the structure-activity relationship of triazolopyridine-based compounds. The heat map was built using the difference value between the average ΔTm for compound 1 and that for analogs 24, determined for each indicated construct. (e) RADD model for compound 1 (purple and blue, stick representation) bound to katanin (gray, ribbon representation). Variability hotspot residues are shown (stick representation, color-coded as in Fig. 1a). Other key amino acids in katanin nucleotide-binding site are also shown (gray, stick representation). Image was generated using UCSF Chimera. Additional models are shown in Extended Data Fig. 2c. The data for graphs in (b-d) are available as source data.
Figure 3:
Figure 3:. Design of an allele-specific covalent inhibitor of katanin.
(a) RADD model for compound 1 (purple and blue, stick representation) bound to katanin (ribbon and stick representation), indicating the distance between the 2-nitrogen atom of compound 1 and the β-carbon of residue D210. (b) SDS-PAGE gel of purified recombinant human katanin-WT and katanin-D210C (aa 111–491) (Coomassie blue staining). (c) ATP-concentration dependence of the steady-state activity of WT and D210C mutant katanin, analyzed using an NADH-coupled assay. Rates were fit to the Michaelis–Menten equation for cooperative enzymes (mean ± range, n=2 independent experiments). (d) Structure of compound 5 (ASPIR-1). (e) Differential scanning fluorimetry analysis of compound 5-dependent changes in the melting temperatures of katanin-WT and katanin-D210C (50 μM compound 5, n = 2 independent experiments). One representative experiment is shown. (f) Time-dependent inhibition of the steady-state ATPase activity of katanin-D210C by compound 5. Graph shows percentage residual ATPase activity (mean ± range, n = 2 independent experiments). (g) Concentration-dependent inhibition of the steady-state ATPase activity of WT and D210C katanin by compound 5 (1 mM ATP, 20 min incubation). Graph shows percentage residual ATPase activity values relative to DMSO control fit to a sigmoidal dose-response equation (mean ± s.d., n = 3 independent experiments for katanin-D210C; mean ± range, n=2 independent experiments for katanin-WT). (h) Percentage residual ATPase activity of VCP/p97 (wild type) and X. laevis katanin (L211C and T250C mutants) in the presence of compound 5 (mean ± range, n = 2 independent experiments for VCP/p97 and X. laevis katanin T250C; mean ± s.d., n = 3 independent experiments for X. laevis katanin L211C). The unprocessed gel image for (b) and data for graphs in (c) and (e-h) are available as source data.
Figure 4:
Figure 4:. Probing katanin function using a covalent inhibitor and a sensitized allele pair.
(a) Immunoblot analysis of HeLa cells expressing wild type (WT) or mutant (D210C) N-terminal EGFP-tagged katanin constructs. (b) CAMSAP2 decorates microtubule minus ends. (c) Immunostaining for CAMSAP2 (magenta) and ɑ-tubulin (green) in kata-WT cells (scale bars, 10 μm). Enlarged portions of the areas in the yellow boxes are shown in the insets (scale bars, 1 μm). Representative images are shown (n = 3 independent experiments, 10 images acquired per experiment). (d-g) Effect of ASPIR-1 treatment on CAMSAP2 stretch length. Images show kata-WT and kata-D210C cells treated with DMSO (control, d) or ASPIR-1 (1.25 μM, e) and stained for CAMSAP2 (scale bars, 10 μm in primary images and 1 μm in insets). Representative images are shown (n = 3 independent experiments, 10 images acquired per condition per experiment). The graphs show the length distribution (relative frequency) of CAMSAP2 stretches in control and ASPIR-1-treated kata-WT (f) and kata-D210C cells (g) (0–2.5 μM ASPIR-1). The unprocessed gel image for (a) and data for graphs in (f-g) are available as source data.
Figure 5:
Figure 5:. Allele-specific inhibition of the AAA proteins VPS4B and FIGL1.
(a-d) Effect of the inhibitor-sensitizing mutation on the enzymatic activities of HS-VPS4B and FIGL1. Graphs show values for the ATP concentration required for half-maximal velocity (K1/2; a-b), and catalytic efficiency (kcat/K1/2; c-d), of wild type (WT) and D-to-C mutant HS-VPS4B and FIGL1 constructs, analyzed by measuring the steady-state ATPase rate at a range of ATP concentrations using an NADH-coupled assay (mean ± s.d. n = 3 for HS-VPS4B-WT and HS-VPS4B-D135C, n = 5 for FIGL1-WT, n = 7 for FIGL1-D402C, independent experiments). (e-f) Concentration-dependent inhibition of the steady-state ATPase activity of WT and D135C HS-VPS4B (e) or WT and D402C FIGL1 (f) by ASPIR-1 (1 mM ATP, 30’ min incubation). Graphs show percentage residual ATPase activity values relative to DMSO control (mean ± s.d., n = 3 for HS-VPS4B-WT, HS-VPS4B-D135C, and FIGL1-WT, n = 5 for FIGL1-D402C, independent experiments). Data for HS-VPS4B-D135C and FIGL1-D402C were fit to a sigmoidal dose-response equation. (g-h) Differential scanning fluorimetry analysis of ASPIR-1-dependent changes in the melting temperatures of WT and D135C HS-VPS4B (g) or WT and D402C FIGL1 (h). Melting temperatures in the presence of ASPIR-1 (50 μM), are HS-VPS4B-WT: DMSO = 45.1 °C (range 45.0–45.3); ASPIR-1 = 49.0 (no range) °C; HS-VPS4B-D135C: DMSO = 42.5 (no range); ASPIR-1 = 54.0 (no range) °C; FIGL1-WT: DMSO = 42.8 (range 42.5–43.0) °C; ASPIR-1 = 44.5 (no range); FIGL1-D402C: DMSO = 39 °C (no range); ASPIR-1 = 45.0 °C (no range) (n = 2 independent experiments). One representative experiment is shown. (i). Crystal structure of ASPIR-2 (stick representation) bound to VPS4B-D135C (ribbon and stick representation). A simulated annealing omit map of ASPIR-2 and Cys-135 contoured to 3.0 σ is shown (green mesh). The data for graphs in (a-h) are available as source data.
Figure 6.
Figure 6.. An approach for developing allele-specific covalent inhibitors for proteins in the AAA family.
Schematic for the approach. 1) RADD is used to generate a binding model of a low-affinity fragment that binds conserved motifs in the AAA protein family. 2) This model guides the introduction of a biochemically silent cysteine mutation and 3) a functional group with proximity-induced reactivity is incorporated to generate a potent and selective covalent inhibitor for the engineered target protein allele.

References

    1. Puchades C, Sandate CR & Lander GC The molecular principles governing the activity and functional diversity of AAA proteins. Nature Reviews Molecular Cell Biology vol. 21 43–58 (2020). - PMC - PubMed
    1. Seraphim TV & Houry WA AAA proteins. Current Biology vol. 30 R251–R257 (2020). - PubMed
    1. Gates SN & Martin A. Stairway to translocation: AAA+ motor structures reveal the mechanisms of ATP‐dependent substrate translocation. Protein Sci. 29, 407–419 (2020). - PMC - PubMed
    1. Wendler P, Ciniawsky S, Kock M. & Kube S. Structure and function of the AAA nucleotide binding pocket. Biochimica et Biophysica Acta (BBA) - Molecular Cell Research vol. 1823 2–14 (2012). - PubMed
    1. McCullough J, Frost A. & Sundquist WI Structures, Functions, and Dynamics of ESCRT-III/Vps4 Membrane Remodeling and Fission Complexes. Annu. Rev. Cell Dev. Biol. 34, 85–109 (2018). - PMC - PubMed

Publication types

MeSH terms