

A reduction of the number of assays and turnaround time by optimizing polymerase chain reaction (PCR) pooled testing for SARS-CoV-2
- PMID: 33783005
- PMCID: PMC8250672
- DOI: 10.1002/jmv.26972
A reduction of the number of assays and turnaround time by optimizing polymerase chain reaction (PCR) pooled testing for SARS-CoV-2
Abstract
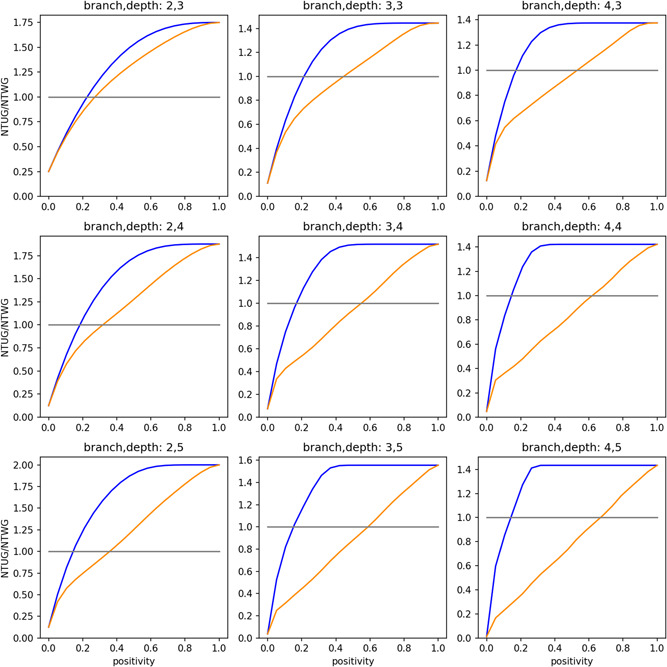
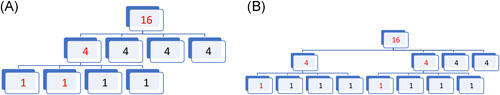
Early detection of the severe acute respiratory syndrome coronavirus 2 infection can decrease the spread of the disease and provide therapeutic options promptly in affected individuals. However, the diagnosis by reverse-transcription polymerase chain reaction is costly and time-consuming. Several methods of group testing have been developed to overcome this problem. The proposed strategy offers optimization of group testing according to the available resources by decreasing not only the number of the assays but also the turnaround time. The initial classification of the samples would be done according to the intention of testing defined as diagnostic or screening/surveillance, achieving the best possible homogeneity. The proposed stratification of pooling is based on branching (divisions) and depth (levels of re-pooling) of the original group in association with the estimated probability of a positive sample. The dilutional effect of the grouped samples has also been considered. The margins of minimum and maximum conservation of assays of pooled specimens are calculated and the optimum strategy can be selected in association with the probability of positive samples in the original group. This algorithm intends to be a useful tool for group testing offering a choice of strategies according to the requirements.
Keywords: COVID-19; RT-PCR; SARS-CoV-2; group testing; pooled analysis; sample pooling; sensitivity; turnaround time.
© 2021 Wiley Periodicals LLC.
Conflict of interest statement
The authors declare that there are no conflict of interests.
Figures


Similar articles
-
Implementation of a Sample Pooling Strategy for the Direct Detection of SARS-CoV-2 by Real-Time Polymerase Chain Reaction During the COVID-19 Pandemic.Am J Clin Pathol. 2021 Jun 17;156(1):15-23. doi: 10.1093/ajcp/aqab035. Am J Clin Pathol. 2021. PMID: 33978164 Free PMC article.
-
Comparing two sample pooling strategies for SARS-CoV-2 RNA detection for efficient screening of COVID-19.J Med Virol. 2021 May;93(5):2805-2809. doi: 10.1002/jmv.26632. Epub 2021 Mar 11. J Med Virol. 2021. PMID: 33107614
-
Self-collection and pooling of samples as resources-saving strategies for RT-PCR-based SARS-CoV-2 surveillance, the example of travelers in French Polynesia.PLoS One. 2021 Sep 2;16(9):e0256877. doi: 10.1371/journal.pone.0256877. eCollection 2021. PLoS One. 2021. PMID: 34473769 Free PMC article.
-
Diagnostic accuracy of the Cepheid Xpert Xpress and the Abbott ID NOW assay for rapid detection of SARS-CoV-2: A systematic review and meta-analysis.J Med Virol. 2021 Jul;93(7):4523-4531. doi: 10.1002/jmv.26994. Epub 2021 May 3. J Med Virol. 2021. PMID: 33913533 Free PMC article.
-
COVID-19 testing and diagnosis: A comparison of current approaches.Malays J Pathol. 2021 Apr;43(1):3-8. Malays J Pathol. 2021. PMID: 33903299 Review.
Cited by
-
Utilizing nanozymes for combating COVID-19: advancements in diagnostics, treatments, and preventative measures.J Nanobiotechnology. 2023 Jun 21;21(1):200. doi: 10.1186/s12951-023-01945-9. J Nanobiotechnology. 2023. PMID: 37344839 Free PMC article. Review.
-
Updates on the Biofunctionalization of Gold Nanoparticles for the Rapid and Sensitive Multiplatform Diagnosis of SARS-CoV-2 Virus and Its Proteins: From Computational Models to Validation in Human Samples.Int J Mol Sci. 2023 May 25;24(11):9249. doi: 10.3390/ijms24119249. Int J Mol Sci. 2023. PMID: 37298201 Free PMC article. Review.
-
Optimization of Screening Strategies for COVID-19: Scoping Review.JMIR Public Health Surveill. 2024 Feb 27;10:e44349. doi: 10.2196/44349. JMIR Public Health Surveill. 2024. PMID: 38412011 Free PMC article.
References
MeSH terms
LinkOut - more resources
Full Text Sources
Other Literature Sources
Medical
Miscellaneous
