. 2021 Apr 13;93(14):5897-5905.
doi: 10.1021/acs.analchem.1c00253. Epub 2021 Mar 30.

Sizing Extracellular Vesicles Using Membrane Dyes and a Single Molecule-Sensitive Flow Analyzer

Affiliations

Sizing Extracellular Vesicles Using Membrane Dyes and a Single Molecule-Sensitive Flow Analyzer

Luca A Andronico et al. Anal Chem. .

Abstract

Extracellular vesicles (EVs) are membranous particles released by most cells in our body, which are involved in many cell-to-cell signaling processes. Given the nanometer sizes and heterogeneity of EVs, highly sensitive methods with single-molecule resolution are fundamental to investigating their biophysical properties. Here, we demonstrate the sizing of EVs using a fluorescence-based flow analyzer with single-molecule sensitivity. Using a dye that selectively partitions into the vesicle's membrane, we show that the fluorescence intensity of a vesicle is proportional to its diameter. We discuss the constraints in sample preparation which are inherent to sizing nanoscale vesicles with a fluorescent membrane dye and propose several guidelines to improve data consistency. After optimizing staining conditions, we were able to measure the size of vesicles in the range ∼35-300 nm, covering the spectrum of EV sizes. Lastly, we developed a method to correct the signal intensity from each vesicle based on its traveling speed inside the microfluidic channel, by operating at a high sampling rate (10 kHz) and measuring the time required for the particle to cross the laser beam. Using this correction, we obtained a threefold greater accuracy in EV sizing, with a precision of ±15-25%.


Figures
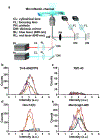
Figure 1.
Figure 1.. Selection of organic dyes for EV staining.
a, Schematic of a single molecule-sensitive flow analyzer. b-e, Intensity distributions of liposomes labeled using four dyes at different dye concentrations: 5 nM (violet), 20 nM (orange), 50 nM (red), 100 nM (blue), and 250 nM (black). The x-axis is in logarithmic scale, and counts (vesicle detection events) are plotted against fluorescence intensity (a.u.).
Figure 2.
Figure 2.. Extracting vesicle velocity for correction of flow data.
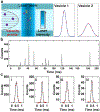
a, Schematic of EVs flowing in a microchannel in laminar flow. Vesicle peaks are narrower at higher flow speeds (vesicle 1), broader at lower flow speeds (vesicle 2). b, Segment of flow data showing broadening of peaks. A high sampling rate (10 kHz) was used. c, Fitting of peaks to a bell-shaped function to assess vesicle passing time (PT), calculated using 6σ. The four peaks illustrate large vesicles (I, II) and small vesicles (III, IV) flowing at low speeds (PTI = 0.542 ms, PTIII = 0.544 ms) and high speeds (PTII = 0.382 ms, PTIV = 0.371 ms).
Figure 3.
Figure 3.. Estimation of EV sizes by correlation with cryo-EM data.
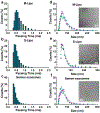
a-c, Vesicle PT distributions. d-f, Overlap of size distributions derived from flow analysis (violet) and from Cryo-EM data (green). The dashed lines represent the best fit to a log-normal distribution. Size distributions from Cryo-EM were centered (median ± SD) at 80.0 ± 46.7 nm (M-Lipo), 47.4 ± 20.2 nm (S-Lipo) and 70.2 ± 36.1 nm (SE), whereas flow-derived size distributions were centered at 79.9 ± 35.5 nm (M-Lipo), 48.2 ± 17.8 nm (S-Lipo) and 70.0 ± 44.0 nm (SE). The insets in Fig. 3d–f show a typical Cryo-EM image for each vesicles sample.
Figure 4.
Figure 4.. Accuracy of EV size estimates.
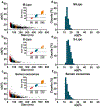
a-c, Scatter plots showing u(s)% as a function of vesicle size for the three samples. The colored dots indicate three distinct subpopulations of vesicles centered at 40 nm (red), 80 nm (blue) and 130 nm (orange). Each subpopulation span ± 10 nm around the corresponding center. The insert shows the three subpopulations along with the absolute uncertainty (error bars in light colors) associated with each single vesicle. d-f, Distribution of u(s)%
Figure 5.
Figure 5.. Screening of experimental parameters for staining EVs with Di-8-ANEPPS.
a, Bulk emission intensity (λem = 588 nm) over time of SEs stained with different concentrations of Di-8-ANEPPS. b-f, Flow-derived size distributions obtained during the screening of optimal conditions for SEs staining. The figures legends correspond to a specific dye/vesicle ratio (b and c), concentration of EtOH (v/v%) (d), the reaction volume (e) and the dilution factor applied to the initial optimal concentration for staining C (f). Size distributions in panel f were centered at ~72 nm (black), ~61 nm (green), ~47 nm (red), ~37 nm (blue), and ~28 nm (orange), whereas all distributions in panels b-e were centered at ~70 ± 5 nm (except for the distributions represented by the black solid lines in panel b and c, which were centered at ~58 nm and ~45 nm, respectively). g, Center-of-sizes distribution against the corresponding average PT of vesicles, obtained from samples under optimal staining conditions. The blue and green dots refer to sizes obtained with or without correction of each individual vesicle by the corresponding speed. h, Representative distribution of the distance in time (Δt) between two consecutive peaks for low (pink), medium (green) and high (blue) density of vesicles (i.e. events counted). The median of Δt distribution is 40 ms (pink), 15 ms (green) and 6 ms (blue) and the events were acquired over a period of 3 min.

References

    1. Margolis L; Sadovsky Y PLOS Biology 2019, 17, e3000363. - PMC - PubMed
    1. Théry C, et al. Journal of Extracellular Vesicles 2018, 7, 1535750. - PMC - PubMed
    1. Greening DW; Xu R; Ji H; Tauro BJ; Simpson RJ (2015) A Protocol for Exosome Isolation and Characterization: Evaluation of Ultracentrifugation, Density-Gradient Separation, and Immunoaffinity Capture Methods. In: Posch A (eds) Proteomic Profiling. Methods in Molecular Biology, vol 1295. Humana Press, New York, NY. - PubMed
    1. Patel GK; Khan MA; Zubair H; et al. Sci. Rep 2019, 9, 5335. - PMC - PubMed
    1. Mutch SA; et al. Biophysical Journal 2007, 92, 2926–2943. - PMC - PubMed

Publication types

Substances