

Spatial-Temporal Relationship Between Population Mobility and COVID-19 Outbreaks in South Carolina: Time Series Forecasting Analysis
- PMID: 33784239
- PMCID: PMC8045774
- DOI: 10.2196/27045
Spatial-Temporal Relationship Between Population Mobility and COVID-19 Outbreaks in South Carolina: Time Series Forecasting Analysis
Abstract
Background: Population mobility is closely associated with COVID-19 transmission, and it could be used as a proximal indicator to predict future outbreaks, which could inform proactive nonpharmaceutical interventions for disease control. South Carolina is one of the US states that reopened early, following which it experienced a sharp increase in COVID-19 cases.
Objective: The aims of this study are to examine the spatial-temporal relationship between population mobility and COVID-19 outbreaks and use population mobility data to predict daily new cases at both the state and county level in South Carolina.
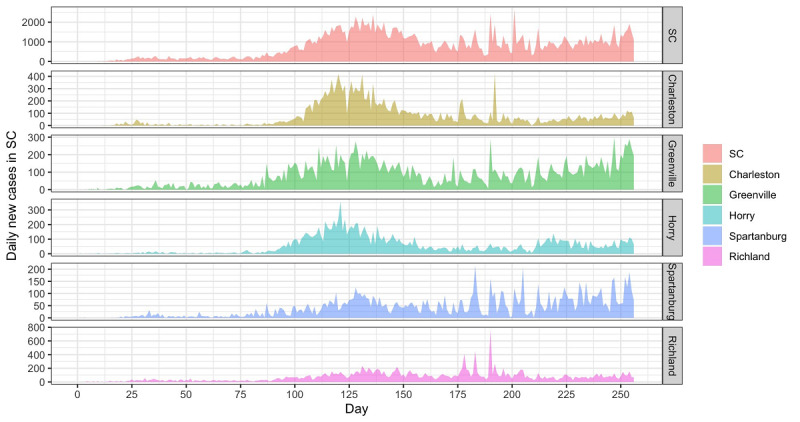
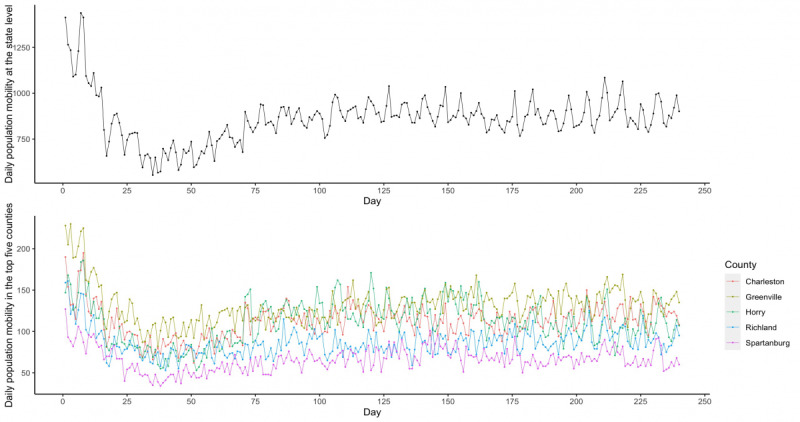
Methods: This longitudinal study used disease surveillance data and Twitter-based population mobility data from March 6 to November 11, 2020, in South Carolina and its five counties with the largest number of cumulative confirmed COVID-19 cases. Population mobility was assessed based on the number of Twitter users with a travel distance greater than 0.5 miles. A Poisson count time series model was employed for COVID-19 forecasting.
Results: Population mobility was positively associated with state-level daily COVID-19 incidence as well as incidence in the top five counties (ie, Charleston, Greenville, Horry, Spartanburg, and Richland). At the state level, the final model with a time window within the last 7 days had the smallest prediction error, and the prediction accuracy was as high as 98.7%, 90.9%, and 81.6% for the next 3, 7, and 14 days, respectively. Among Charleston, Greenville, Horry, Spartanburg, and Richland counties, the best predictive models were established based on their observations in the last 9, 14, 28, 20, and 9 days, respectively. The 14-day prediction accuracy ranged from 60.3%-74.5%.
Conclusions: Using Twitter-based population mobility data could provide acceptable predictions of COVID-19 daily new cases at both the state and county level in South Carolina. Population mobility measured via social media data could inform proactive measures and resource relocations to curb disease outbreaks and their negative influences.
Keywords: COVID-19; South Carolina; incidence; mobility.
©Chengbo Zeng, Jiajia Zhang, Zhenlong Li, Xiaowen Sun, Bankole Olatosi, Sharon Weissman, Xiaoming Li. Originally published in the Journal of Medical Internet Research (http://www.jmir.org), 13.04.2021.
Conflict of interest statement
Conflicts of Interest: None declared.
Figures
Update of
-
Spatial-temporal relationship between population mobility and COVID-19 outbreaks in South Carolina: A time series forecasting analysis.medRxiv [Preprint]. 2021 Jan 8:2021.01.02.21249119. doi: 10.1101/2021.01.02.21249119. medRxiv. 2021. Update in: J Med Internet Res. 2021 Apr 13;23(4):e27045. doi: 10.2196/27045. PMID: 33442704 Free PMC article. Updated. Preprint.
References
-
- Centers for Disease Control and Prevention Coronavirus Disease 2019 (COVID-19): Cases & Deaths in the US. 2021. [2021-04-06]. https://www.cdc.gov/coronavirus/2019-ncov/index.html.
-
- Bohatch E. SC sees more than 2,200 coronavirus cases, second highest increase in one day. The State. 2020. Jul 14, [2021-04-06]. https://www.thestate.com/news/coronavirus/article244215817.html.
-
- South Carolina Department of Health and Environmental Control SC Demographic Data (COVID-19) 2021. [2021-04-06]. https://scdhec.gov/covid19#coviddata.
-
- National Center for Immunization and Respiratory Diseases (NCIRD), Division of Viral Diseases COVID-19 Forecasting: Background Information. 2020. Oct 06, [2021-04-06]. https://www.cdc.gov/coronavirus/2019-ncov/cases-updates/forecasting.html.
-
- IHME COVID-19 Forecasting Team Modeling COVID-19 scenarios for the United States. Nat Med. 2021 Jan 23;27(1):94–105. doi: 10.1038/s41591-020-1132-9. http://europepmc.org/abstract/MED/33097835 - DOI - PMC - PubMed
MeSH terms
Grants and funding
LinkOut - more resources
Full Text Sources
Other Literature Sources
Medical
