. 2021 May 14;161(6):681-696.
doi: 10.1530/REP-20-0483.

Implications for preeclampsia: hypoxia-induced Notch promotes trophoblast migration

Affiliations

Implications for preeclampsia: hypoxia-induced Notch promotes trophoblast migration

Barry E Perlman et al. Reproduction. .

Abstract

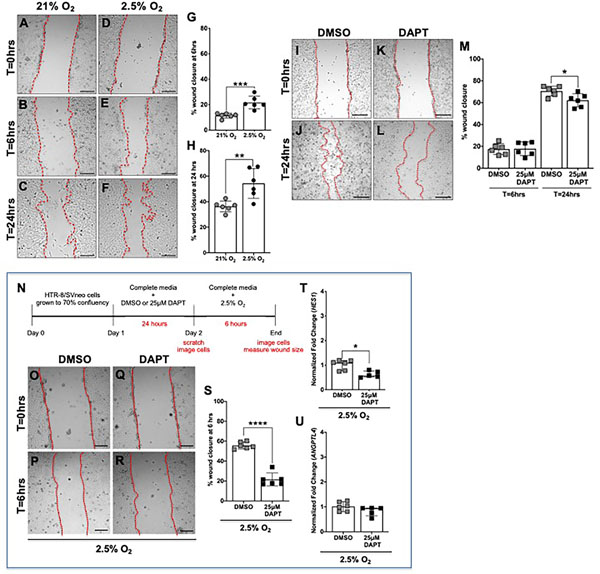
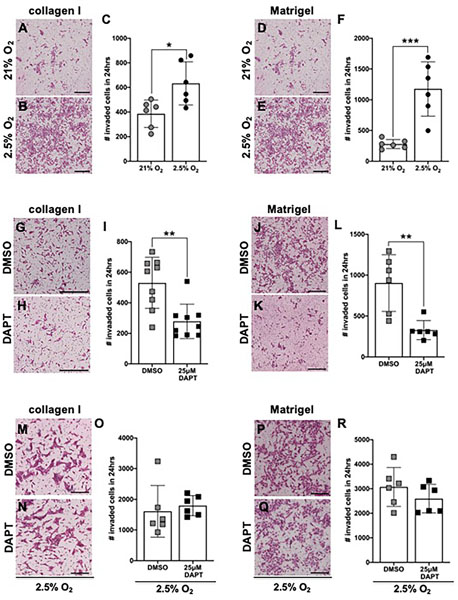
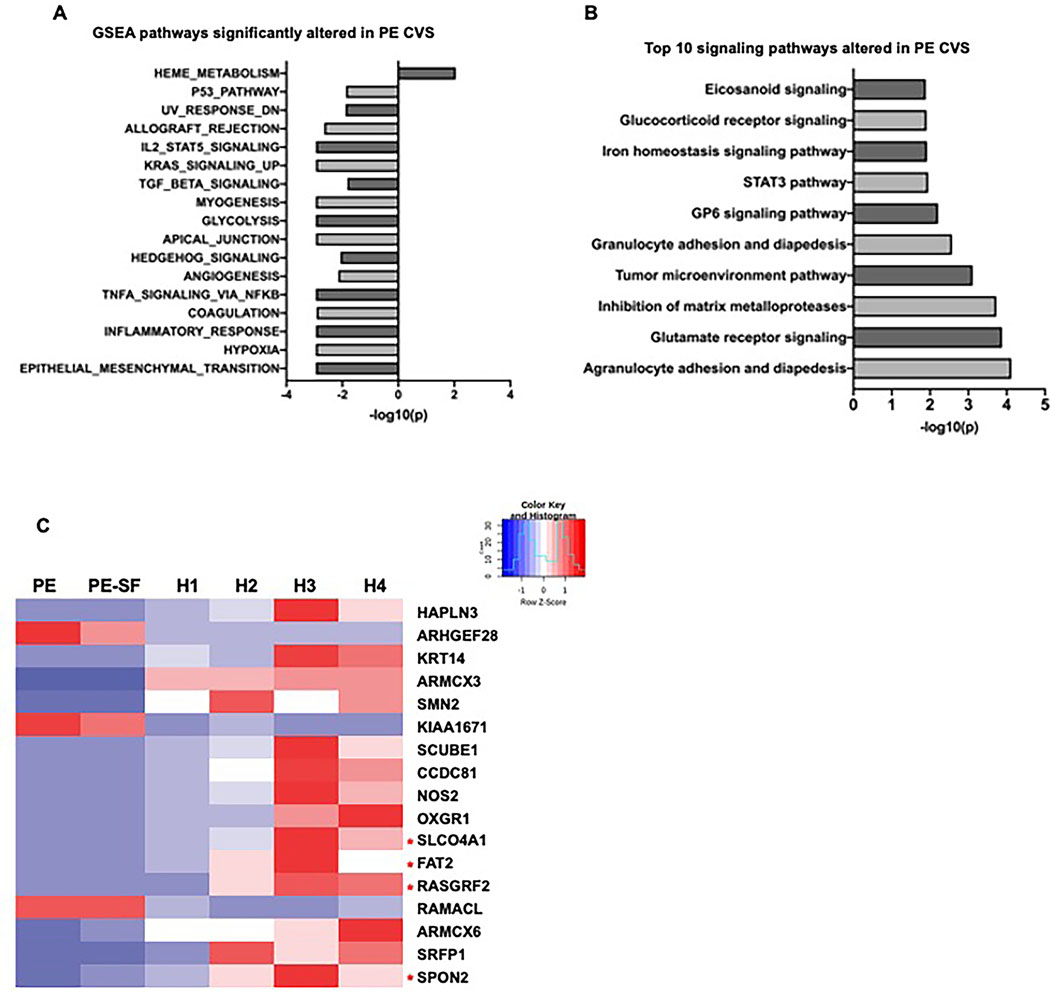
In the first trimester of human pregnancy, low oxygen tension or hypoxia is essential for proper placentation and placenta function. Low oxygen levels and activation of signaling pathways have been implicated as critical mediators in the promotion of trophoblast differentiation, migration, and invasion with inappropriate changes in oxygen tension and aberrant Notch signaling both individually reported as causative to abnormal placentation. Despite crosstalk between hypoxia and Notch signaling in multiple cell types, the relationship between hypoxia and Notch in first trimester trophoblast function is not understood. To determine how a low oxygen environment impacts Notch signaling and cellular motility, we utilized the human first trimester trophoblast cell line, HTR-8/SVneo. Gene set enrichment and ontology analyses identified pathways involved in angiogenesis, Notch and cellular migration as upregulated in HTR-8/SVneo cells exposed to hypoxic conditions. DAPT, a γ-secretase inhibitor that inhibits Notch activation, was used to interrogate the crosstalk between Notch and hypoxia pathways in HTR-8/SVneo cells. We found that hypoxia requires Notch activation to mediate HTR-8/SVneo cell migration, but not invasion. To determine if our in vitro findings were associated with preeclampsia, we analyzed the second trimester chorionic villous sampling (CVS) samples and third trimester placentas. We found a significant decrease in expression of migration and invasion genes in CVS from preeclamptic pregnancies and significantly lower levels of JAG1 in placentas from pregnancies with early-onset preeclampsia with severe features. Our data support a role for Notch in mediating hypoxia-induced trophoblast migration, which may contribute to preeclampsia development.


Conflict of interest statement

Declaration of interest

The authors declare there is no conflict of interest that could be perceived as prejudicing the impartiality of the research reported.

Figures

Figure 1.
Figure 1.. Exposure of HTR-8/Svneo cells to hypoxic (2.5% O2) conditions induces expression of genes involved in hypoxia signaling and alters multiple biological pathways.
HTR-8/SVneo cells were exposed to normoxic (21% O2) or hypoxic (2.5% O2) conditions for 6 hours. qRT-PCR was used to determine expression of hypoxia responsive genes, ANGPTL4 (A) and VEGFA (B). The relative level of expression was compared to 18s rRNA. Expression of ANGPTL4 (A) and VEGFA (B) was significantly increased in HTR-8/SVneo cells exposed to hypoxia as compared to cells exposed to normoxia (n = 5 – 6 per condition; **p<0.01). Data are represented as median + IQR. (C-E) mRNA-seq was used to identify differentially expressed genes, altered signaling pathways and altered biological processes. (C) Volcano plot of differentially expressed genes in HTR-8/SVneo cells after 6 hours exposure to hypoxia compared to normoxia. A total of 8353 genes are differently expressed based on an adjusted p<0.05, with 4184 upregulated and 4169 downregulated. ANGPTL4 and VEGFA are labeled. (D) Gene Ontology (GO) enrichment identified biological processes related to placentation. Left panel shows biological processes altered by upregulated genes. Right panel shows biological processes altered by downregulated genes. (E) Top 10 canonical, non-disease specific signaling pathways from Ingenuity Pathway Analysis.
Figure 2.
Figure 2.. Notch signaling is active in HTR-8/SVneo cells in normoxic (21% O2) conditions.
(A) RT-PCR and normalized hit counts from DESeq2 output were utilized to detect Notch family gene expression in untreated HTR-8/SVneo grown under normoxic conditions. Expression of receptors, NOTCH1 (N1), NOTCH2 (N2), NOTCH3 (N3) and NOTCH4 (N4); ligands, DLL4, JAG1 and JAG2; and effectors, HES1, HEY1 and HEY2 is shown. (B, C) Representative images of phase contrast and H&E stained HTR-8/SVneo cells. (D-H) Representative images of immunostained HTR-8/SVneo cells. IF identifies expression of NOTCH1, NOTCH2, NOTCH3, JAG1 and HES1 in HTR-8/SVneo cells. Scale bars = 100 μm in A and 50 μm in B, D-G.
Figure 3.
Figure 3.. Exposure to hypoxia alters expression of genes in the Notch signaling pathway in HTR-8/SVneo cells.
HTR-8/SVneo cells were exposed to normoxic (21% O2) or hypoxic (2.5% O2) conditions for 6 hours and mRNA-seq was used to determine differentially expressed genes in the Notch signaling pathway. (A) Heatmap of normalized hit counts shows 36 differentially expressed genes in the Notch signaling pathway in HTR-8/SVneo cells after 6 hours exposure to hypoxia compared to normoxia. Columns represent individual samples (n=3) per condition and rows represent each gene. Color intensity represents gene expression, with blue indicating low expression levels and red indicating high expression levels. Red asterisks indicate the 23 Notch pathway genes that were significantly differentially expressed with FDR p-value < 0.05. (B-E) qRT-PCR was used to confirm hypoxia-induced Notch pathway gene expression changes identified by mRNA-seq. Expression of NOTCH1 (B), JAG1 (C), and effectors, HEY2 (D) and NRARP (E) was significantly increased in HTR-8/SVneo cells exposed to hypoxia (n = 4 – 9 per condition; *p <0.05, **p<0.01). Data are represented as median + IQR. (F, G) Representative IF images of HES1 protein expression in HTR-8/SVneo cells exposed to normoxia and hypoxia. (H) Expression of nuclear HES1 per total number of cells in 3 high powered fields was determined. Exposure to hypoxia for 6 hours significantly increased expression of HES1 protein in HTR-8/SVneo cells (n = 3 per condition; ****p<0.0001). Data are represented as mean ± SD. Scale bars = 50 μm in F and G.
Figure 4.
Figure 4.. Inhibition of γ-secretase in normoxic (21% O2) and hypoxic (2.5% O2) conditions reduces Notch signaling activity in HTR-8/SVneo cells.
(A) HTR-8/SVneo cells exposed to DMSO (vehicle control), 25μM DAPT or 50μM DAPT in normoxia for 24hrs were analyzed for viability by a MTT assay. Relative cell viability, normalized to viability in cells exposed to DMSO, was significantly decreased after exposure to 50μM DAPT, but did not differ after exposure to 25μM DAPT (n = 6 per condition, *p<0.05). (B) HTR-8/SVneo cells exposed to DMSO or 25μM DAPT in normoxia for 24hrs were analyzed for proliferation by Ki67 IF. Expression of nuclear Ki67 per total number of cells in 3 high powered fields was determined. Exposure to DAPT did not impact cellular proliferation, (n = 6 per condition). (C-E) HTR-8/SVneo cells exposed to DMSO or 25μM DAPT in normoxia were analyzed for expression of cleaved NOTCH1 (N1) and alpha tubulin by western blot and expression of HES1 by qRT-PCR. (C) Representative Western blots of cleaved NOTCH1 and alpha tubulin. (D) Expression of cleaved NOTCH1, relative to alpha tubulin, was decreased in HTR-8/SVneo cells treated with 25μM DAPT treated as compared to DMSO, (n = 4 per condition, **p<0.01). (E) HES1 expression was significantly decreased in cells treated with 25μM DAPT as compared to DMSO, (n = 6 per condition, **p<0.01). (F-J) HTR-8/SVneo cells grown in hypoxic conditions (2.5% O2) were exposed to DMSO or 25μM DAPT for 24hrs. (F) Exposure to 25μM DAPT in hypoxia did not impact cell viability. (G) Expression of nuclear Ki67 per total number of cells in 3 high powered fields was determined. Exposure to DAPT in hypoxia did not impact cellular proliferation, (n = 6 per condition). (H) Representative western blots of cleaved NOTCH1 and alpha tubulin. (I) Expression of cleaved NOTCH1, relative to alpha tubulin, was decreased in HTR-8/SVneo cells treated with 25μM DAPT in hypoxic conditions as compared to DMSO (n=6 per condition, **p<0.01). (J) Expression of HES1 was significantly decreased in cells treated with 25μM DAPT in hypoxic conditions as compared to DMSO (n=6 per condition, **p<0.01). All data are represented as median + IQR.
Figure 5.
Figure 5.. Hypoxia increases and inhibition of γ-secretase decreases HTR-8/Svneo migration in both normoxia and hypoxia.
(A-F) Representative images of the scratch migration assay at time (T) = 0 hours, T=6 hours, T=24 hours after exposure to normoxia (21% O2). or hypoxia (2.5% O2). HTR-8/SVneo cell migration was significantly increased with exposure to hypoxia for 6 hours (G) and 24 hours (H), (n = 6 per condition, **p <0.01, *** p<0.001). Data are represented as mean ± SD. (I-L) Representative images of the scratch migration assay at T=0 hours and T=24 hours after exposure to DMSO or 25μM DAPT. (M) HTR-8/SVneo cell migration was unchanged with exposure to 25μM DAPT for 6 hours and significantly decreased with exposure to 25μM DAPT for 24 hours in normoxic conditions (n = 6 per condition, *p <0.05). Data are represented as mean ± SD. (N) Timeline representing experimental design. HTR-8/SVneo cells were grown to 70% confluency and then DMSO or DAPT was added to the culture media. After 24 hours of exposure to 0.1% DMSO or 25μM DAPT, the treated media was removed and replaced with complete media. Scratches were made and cells were imaged at T=0 hours. HTR-8/SVneo cells were exposed to hypoxia (2.5% O2) for 6 hours and then imaged again. (O-R) Representative images of the scratch migration assay at time (T) =0 hours and T=6 hours. (S) Compared to pretreatment with DMSO, pretreatment with DAPT significantly decreased migration of cells exposed to hypoxic conditions (n = 6 per condition, ****p<0.0001). Data are represented as mean ± SD. (T, U) Expression of HES1 and ANGPTL4 in DAPT and DMSO pretreated cells was determined by qRT-PCR. HES1 (T) expression was significantly decreased and ANGPTL4 (U) was similar in HTR-8/SVneo cells that were pretreated with DAPT and then exposed to 2.5% O2 (n = 5–6 per condition, *p <0.05). Data are represented as median + IQR. Scale bars = 250 μm.
Figure 6.
Figure 6.. Growth factor induced migration of HTR-8/SVneo cells is increased by exposure to hypoxia and decreased by inhibition of γ-secretase in normoxia and hypoxia.
(A, B) Representative images of H&E-stained cells that migrated at T=24 hours after exposure to normoxic (21% O2) or hypoxic (2.5% O2) conditions. (C) HTR-8/SVneo cell transwell migration was unchanged with exposure to hypoxia for 6 hours. After 24 hours of exposure to hypoxia, HTR-8/SVneo cell transwell migration was significantly increased (n = 6 per condition, *p <0.05). (D, E) Representative images of H&E-stained cells that migrated at T=24 hours after exposure to DMSO or 25μM DAPT in normoxic conditions. (F) HTR-8/SVneo cell transwell migration was unchanged with exposure to 25μM DAPT for 6 hours and significantly decreased with exposure to 25μM DAPT for 24 hours (n = 6 per condition, ****p <0.0001). (G, H) Representative images of H&E-stained cells that migrated at T=24 hours after exposure DMSO or 25μM DAPT in hypoxic conditions. (I) HTR-8/SVneo cell transwell migration was significantly decreased with exposure to 25μM DAPT in hypoxic for 24 hours (n = 6 per condition, **** p<0.0001). All data are represented as mean ± SD. Scale bars = 250 μm.
Figure 7.
Figure 7.. Inhibition of γ-secretase blocks HTR-8/SVneo cell invasion in normoxic, but not hypoxic, conditions.
(A, B) Representative images of the H&E-stained cells that invaded through collagen I at T=24hrs after exposure to normoxic (21% O2) or hypoxic (2.5% O2) conditions. (C) HTR-8/SVneo cell invasion through collagen I was increased by exposure to hypoxia for 24 hours (n = 6 per condition, *p <0.05). (D, E) Representative images of the H&E-stained cells that invaded through Matrigel at T=24 hours after exposure to normoxic or hypoxic conditions. (F) HTR-8/SVneo cell invasion through Matrigel was increased by exposure to hypoxia for 24 hours (n = 6 per condition, ***p <0.001). (G, H) Representative images of the H&E-stained cells that invaded through collagen I at T=24 hours after exposure to DMSO or 25μM DAPT in normoxic conditions. (I) HTR-8/SVneo cell invasion through collagen I was decreased by exposure to 25μM DAPT in normoxia for 24 hours (n = 6 per condition, **p <0.01). (J, K) Representative images of the H&E-stained cells that invaded through Matrigel at T=24 hours after exposure to DMSO or 25μM DAPT in normoxic conditions. (L) HTR-8/SVneo cell invasion through Matrigel was decreased by exposure to 25μM DAPT in normoxia for 24 hours (n = 6 per condition, **p <0.01). (M, N) Representative images of the H&E-stained cells that invaded through collagen I at T=24 hours after exposure to DMSO or 25μM DAPT in hypoxic conditions. (O) HTR-8/SVneo cell invasion through collagen I was similar after exposure to 25μM DAPT and DMSO in hypoxia for 24 hours (n = 6 per condition). (P, Q) Representative images of the H&E-stained cells that invaded through Matrigel at T=24 hours after exposure to DMSO or 25μM DAPT in hypoxic conditions. (R) HTR-8/SVneo cell invasion through Matrigel was similar after exposure to 25μM DAPT and DMSO in hypoxia for 24 hours (n = 6 per condition). Scale bars = 500 μm. All data are represented as mean ± SD.
Figure 8.
Figure 8.. Cellular motility gene expression is altered in CVS samples from preeclamptic pregnancies.
mRNA-seq analysis of CVS samples from PE pregnancies (n=2, PE and PE-SF) and healthy pregnancies (n=4, H1-H4) identified 396 differentially expressed genes with p < 0.05. Gene set enrichment analysis hallmark pathways (A) and significant canonical non-disease specific signaling pathways from Ingenuity Pathway Analysis (B) from differentially expressed genes with p < 0.05. mRNA-seq analysis of the CVS samples was used to determine differentially expressed genes, with FDR p-value < 0.05. (B) Heatmap of normalized hit counts shows the 17 significant differentially expressed genes in 2nd trimester CVS samples from PE versus healthy pregnancies, 4 of 17 differentially expressed genes (red asterisks) are involved in cellular migration and invasion. Expression of FAT2, SPON2, RASGRF2, and SCLO4A1 is decreased in CVS samples from PE pregnancies.
Figure 9.
Figure 9.. Expression of Notch proteins is decreased in placentas from pregnancies with preterm, preeclampsia with severe features.
Expression of Notch proteins was determined by western blot. Representative western blots of NOTCH1 and GAPDH (A), NOTCH2 and GAPDH (B), NOTCH3 and GAPDH (C), and JAG1 and GAPDH (D) from placenta samples from healthy pregnancies delivered at term, ≥37 weeks of gestation (n=4) and pregnancies complicated by preeclampsia with severe features (PE-SF) delivered preterm, < 37 weeks of gestation (n=4). (E-G) Expression of NOTCH1, NOTCH2 and NOTCH3 was not statistically different in healthy and PE-SF placentas (n=4 per condition). (H) Expression of JAG1 is significantly lower in placenta samples from PE-SF pregnancies (n=4 per condition, *p =0.03). Data are represented as median + IQR.

References

    1. Artavanis-Tsakonas S, Rand MD & Lake RJ 1999. Notch signaling: cell fate control and signal integration in development. Science, 284, 770–776. - PubMed
    1. Bilban M, Tauber S, Haslinger P, Pollheimer J, Saleh L, Pehamberger H, Wagner O & Knofler M 2010. Trophoblast invasion: assessment of cellular models using gene expression signatures. Placenta, 31, 989–996. - PubMed
    1. Borggrefe T, Lauth M, Zwijsen A, Huylebroeck D, Oswald F & Giaimo BD 2016. The Notch intracellular domain integrates signals from Wnt, Hedgehog, TGFbeta/BMP and hypoxia pathways. Biochimica et Biophysica Acta, 1863, 303–313. - PubMed
    1. Burton GJ, Cindrova-Davies T, Yung HW & Jauniaux E 2021. Hypoxia and Reproductive Health: Oxygen and development of the human placenta. Reproduction, 161, F53–F65. - PubMed
    1. Burton GJ & Jauniaux E 2018. Pathophysiology of placental-derived fetal growth restriction. American Journal of Obstetrics and Gynecology, 218, S745–S761. - PubMed

Publication types

MeSH terms