

Ciclopirox olamine induces ferritinophagy and reduces cyst burden in polycystic kidney disease
- PMID: 33784251
- PMCID: PMC8119220
- DOI: 10.1172/jci.insight.141299
Ciclopirox olamine induces ferritinophagy and reduces cyst burden in polycystic kidney disease
Abstract
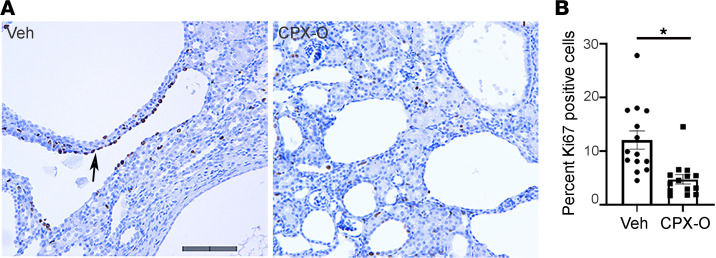
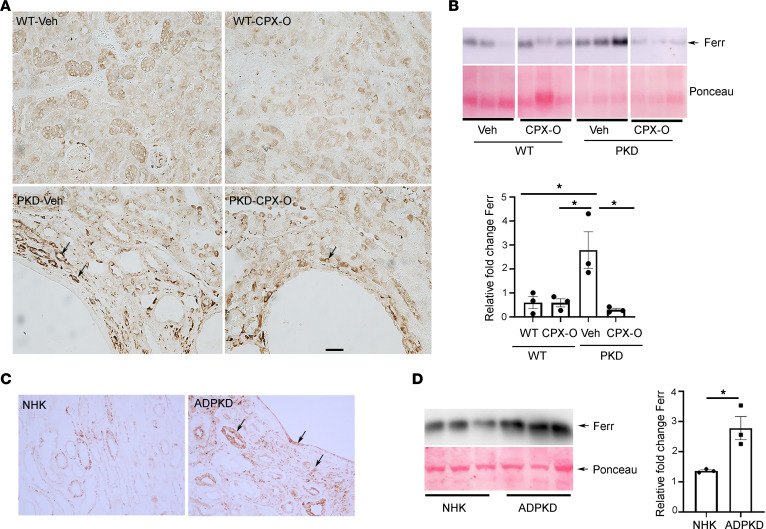
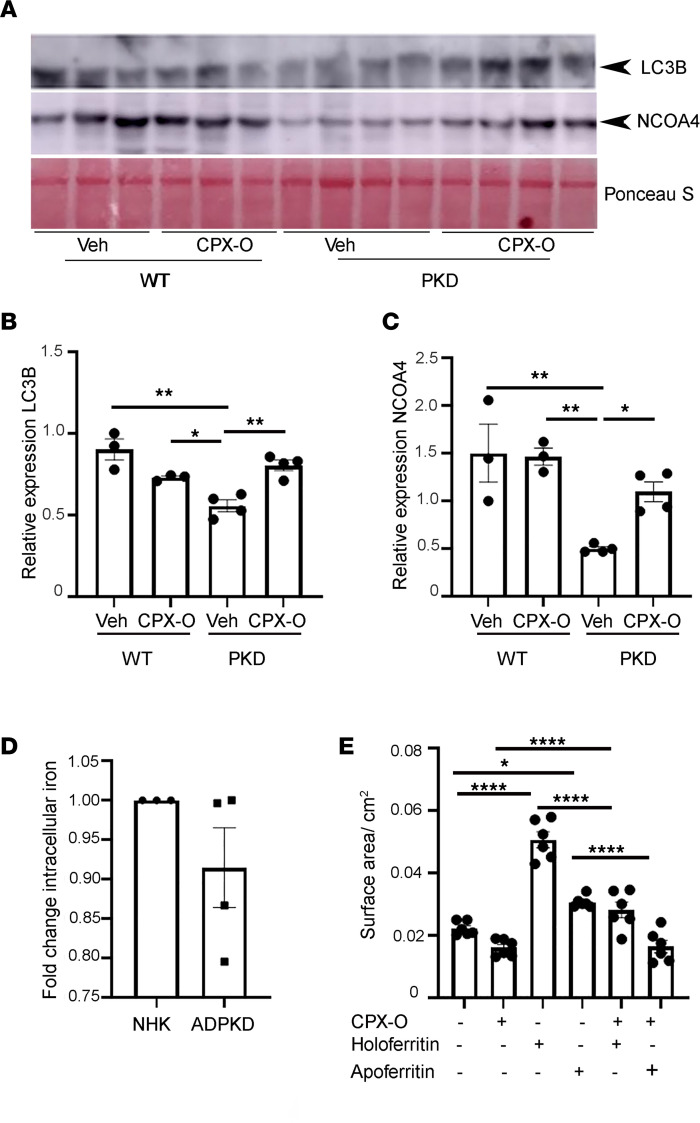
Despite the recent launch of tolvaptan, the search for safer polycystic kidney disease (PKD) drugs continues. Ciclopirox (CPX) or its olamine salt (CPX-O) is contained in a number of commercially available antifungal agents. CPX is also reported to possess anticancer activity. Several mechanisms of action have been proposed, including chelation of iron and inhibition of iron-dependent enzymes. Here, we show that CPX-O inhibited in vitro cystogenesis of primary human PKD cyst-lining epithelial cells cultured in a 3D collagen matrix. To assess the in vivo role of CPX-O, we treated PKD mice with CPX-O. CPX-O reduced the kidney-to-body weight ratios of PKD mice. The CPX-O treatment was also associated with decreased cell proliferation, decreased cystic area, and improved renal function. Ferritin levels were markedly elevated in cystic kidneys of PKD mice, and CPX-O treatment reduced renal ferritin levels. The reduction in ferritin was associated with increased ferritinophagy marker nuclear receptor coactivator 4, which reversed upon CPX-O treatment in PKD mice. Interestingly, these effects on ferritin appeared independent of iron. These data suggest that CPX-O can induce ferritin degradation via ferritinophagy, which is associated with decreased cyst growth progression in PKD mice. Most importantly these data indicate that CPX-O has the potential to treat autosomal dominant PKD.
Keywords: Chronic kidney disease; Nephrology.
Conflict of interest statement
Figures


Similar articles
-
Pharmacological Effects of Panduratin A on Renal Cyst Development in In Vitro and In Vivo Models of Polycystic Kidney Disease.Int J Mol Sci. 2022 Apr 14;23(8):4328. doi: 10.3390/ijms23084328. Int J Mol Sci. 2022. PMID: 35457146 Free PMC article.
-
Rosiglitazone inhibits insulin-like growth factor‑1-induced polycystic kidney disease cell growth and p70S6 kinase activation.Mol Med Rep. 2013 Sep;8(3):861-4. doi: 10.3892/mmr.2013.1588. Epub 2013 Jul 16. Mol Med Rep. 2013. PMID: 23864113
-
Chelation of intracellular iron with the antifungal agent ciclopirox olamine induces cell death in leukemia and myeloma cells.Blood. 2009 Oct 1;114(14):3064-73. doi: 10.1182/blood-2009-03-209965. Epub 2009 Jul 9. Blood. 2009. PMID: 19589922
-
Reposition of the Fungicide Ciclopirox for Cancer Treatment.Recent Pat Anticancer Drug Discov. 2021;16(2):122-135. doi: 10.2174/1574892816666210211090845. Recent Pat Anticancer Drug Discov. 2021. PMID: 33573561 Free PMC article. Review.
-
What is the role of tubular epithelial cell apoptosis in polycystic kidney disease (PKD)?Cell Cycle. 2005 Nov;4(11):1550-4. doi: 10.4161/cc.4.11.2185. Epub 2005 Nov 17. Cell Cycle. 2005. PMID: 16258272 Review.
Cited by
-
The mechanism of ferroptosis and its related diseases.Mol Biomed. 2023 Oct 16;4(1):33. doi: 10.1186/s43556-023-00142-2. Mol Biomed. 2023. PMID: 37840106 Free PMC article. Review.
-
Abnormal Iron and Lipid Metabolism Mediated Ferroptosis in Kidney Diseases and Its Therapeutic Potential.Metabolites. 2022 Jan 10;12(1):58. doi: 10.3390/metabo12010058. Metabolites. 2022. PMID: 35050181 Free PMC article. Review.
-
Interactions between ferroptosis and tumour development mechanisms: Implications for gynaecological cancer therapy (Review).Oncol Rep. 2025 Feb;53(2):18. doi: 10.3892/or.2024.8851. Epub 2024 Dec 5. Oncol Rep. 2025. PMID: 39635847 Free PMC article. Review.
-
Advancing preclinical drug evaluation through automated 3D imaging for high-throughput screening with kidney organoids.Biofabrication. 2024 Apr 8;16(3):10.1088/1758-5090/ad38df. doi: 10.1088/1758-5090/ad38df. Biofabrication. 2024. PMID: 38547531 Free PMC article.
-
Recent progress in ferroptosis: inducers and inhibitors.Cell Death Discov. 2022 Dec 29;8(1):501. doi: 10.1038/s41420-022-01297-7. Cell Death Discov. 2022. PMID: 36581640 Free PMC article. Review.
References
-
- Mangoo-Karim R, et al. Anion secretion drives fluid secretion by monolayers of cultured human polycystic cells. Am J Physiol. 1995;269(3 pt 2):F381–F388. - PubMed
Publication types
MeSH terms
Substances
Grants and funding
LinkOut - more resources
Full Text Sources
Other Literature Sources
