. 2021 Mar 30;16(3):e0245178.
doi: 10.1371/journal.pone.0245178. eCollection 2021.

How array design creates SNP ascertainment bias

Affiliations

How array design creates SNP ascertainment bias

Johannes Geibel et al. PLoS One. .

Abstract

Single nucleotide polymorphisms (SNPs), genotyped with arrays, have become a widely used marker type in population genetic analyses over the last 10 years. However, compared to whole genome re-sequencing data, arrays are known to lack a substantial proportion of globally rare variants and tend to be biased towards variants present in populations involved in the development process of the respective array. This affects population genetic estimators and is known as SNP ascertainment bias. We investigated factors contributing to ascertainment bias in array development by redesigning the Axiom™ Genome-Wide Chicken Array in silico and evaluating changes in allele frequency spectra and heterozygosity estimates in a stepwise manner. A sequential reduction of rare alleles during the development process was shown. This was mainly caused by the identification of SNPs in a limited set of populations and a within-population selection of common SNPs when aiming for equidistant spacing. These effects were shown to be less severe with a larger discovery panel. Additionally, a generally massive overestimation of expected heterozygosity for the ascertained SNP sets was shown. This overestimation was 24% higher for populations involved in the discovery process than not involved populations in case of the original array. The same was observed after the SNP discovery step in the redesign. However, an unequal contribution of populations during the SNP selection can mask this effect but also adds uncertainty. Finally, we make suggestions for the design of specialized arrays for large scale projects where whole genome re-sequencing techniques are still too expensive.


Conflict of interest statement

The authors have declared that no competing interests exist.

Figures

Fig 1
Fig 1. Flow chart of the array redesign process.
The steps of redesigning the array (blue) are described in more detail in the text. Application of the array (red) was done after each subsequent step to assess the effects of the according step on the frequency spectrum.
Fig 2
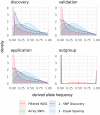
Fig 2. Derived allele frequency spectra for the different SNP sets.
For the remodeled sets, areas show the modelling according to the original array [21] while grey lines represent the 50 random population groupings.
Fig 3
Fig 3. Derived allele frequency spectra within the population groups.
Fig 4
Fig 4. Impact of a varying number of discovery populations (A) or target density (B) on the derived allele frequency spectrum.
For A, blue indicates the spectra after the discovery step and red after the equal spacing step. For B, only the equal spacing step is shown and blue indicates that the algorithm including the initial backbone, while red shows the results without the backbone included in the algorithm. Different numbers of populations in the discovery set (4 to 40) or the increase in the target density are indicated by an intensifying color gradient and only one representative and randomly picked run per population number/ target density is shown. As the differences in the color gradients are hard to distinguish, arrows in the respective color are indicating the shift of the spectra with increasing numbers of discovery populations.
Fig 5
Fig 5. Expected Heterozygosity (Hexp) by population and SNP set.
Populations are ordered by the Hexp of the unfiltered WGS SNP set. Only the reference sets and relevant steps of the array design are shown. Discovery populations are shaded with a darker background.
Fig 6
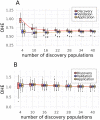
Fig 6. Relation of the OHE as a function of the number of discovery populations.
A—discovery, B—equal spacing. While the number of discovery populations was varied from 4 to 40 by increments of one, the Boxplots are only shown for a subset of the number of discovery populations to avoid a crowded figure. The smoothing lines, which show the trend, are calculated from all observations. Plots for all five steps can be found in S9 Fig.
Fig 7
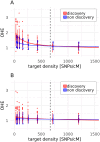
Fig 7. OHE after equal spacing (step 3) by target density in SNPs/cM and population group.
The smoothing lines show the trend and the dashed lines the target density of 667 SNPs/cM, used for the remodeling according to the original array [21]. The algorithm was run including the initial backbone SNPs (A) or not including them (B). Gallus varius is not included, as it is constantly underestimated.

Similar articles

Cited by

References

    1. Novembre J, Johnson T, Bryc K, Kutalik Z, Boyko AR, Auton A, et al.. Genes mirror geography within Europe. Nature. 2008; 456:98. 10.1038/nature07331 - DOI - PMC - PubMed
    1. Patterson N, Moorjani P, Luo Y, Mallick S, Rohland N, Zhan Y, et al.. Ancient admixture in human history. Genetics. 2012; 192:1065–93. 10.1534/genetics.112.145037 . - DOI - PMC - PubMed
    1. Laurie CC, Nickerson DA, Anderson AD, Weir BS, Livingston RJ, Dean MD, et al.. Linkage Disequilibrium in Wild Mice. PLoS Genet. 2007; 3:e144. 10.1371/journal.pgen.0030144 - DOI - PMC - PubMed
    1. Platt A, Horton M, Huang YS, Li Y, Anastasio AE, Mulyati NW, et al.. The Scale of Population Structure in Arabidopsis thaliana. PLoS Genet. 2010; 6:e1000843. 10.1371/journal.pgen.1000843 - DOI - PMC - PubMed
    1. Travis AJ, Norton GJ, Datta S, Sarma R, Dasgupta T, Savio FL, et al.. Assessing the genetic diversity of rice originating from Bangladesh, Assam and West Bengal. Rice. 2015; 8:35. 10.1186/s12284-015-0068-z - DOI - PMC - PubMed

Publication types

LinkOut - more resources