. 2021 Mar 30;16(3):e0245675.
doi: 10.1371/journal.pone.0245675. eCollection 2021.

POT1 stability and binding measured by fluorescence thermal shift assays

Affiliations

POT1 stability and binding measured by fluorescence thermal shift assays

Lynn W DeLeeuw et al. PLoS One. .

Abstract

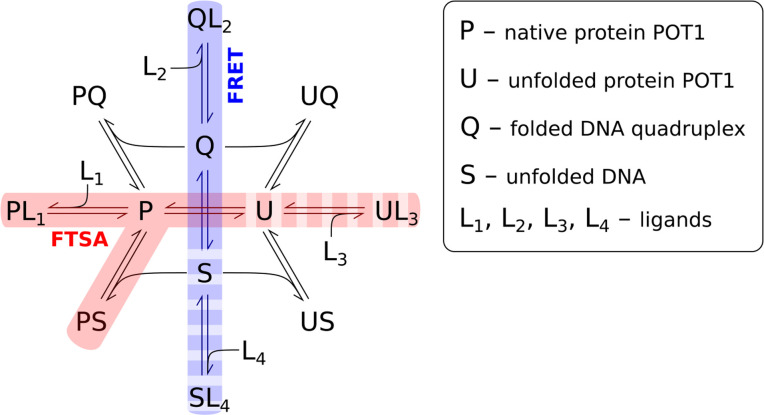
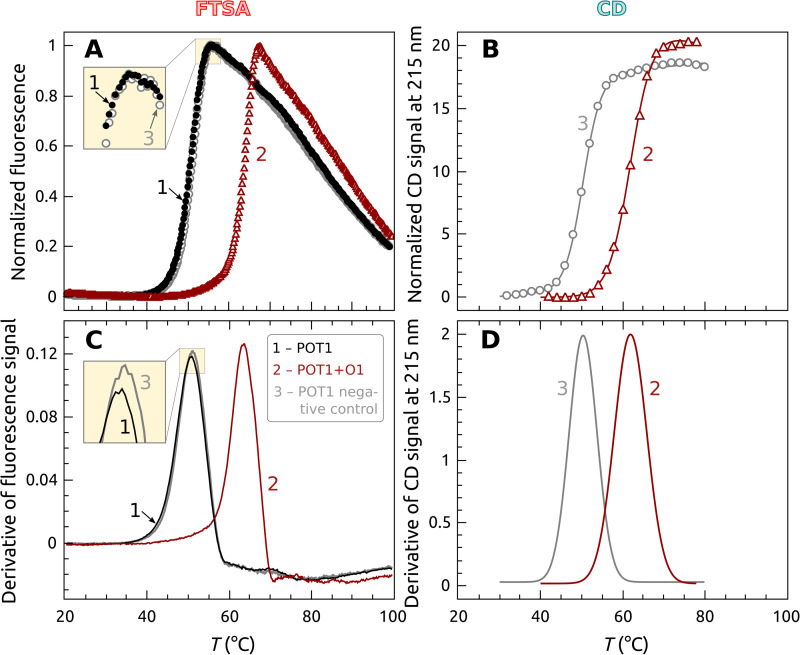
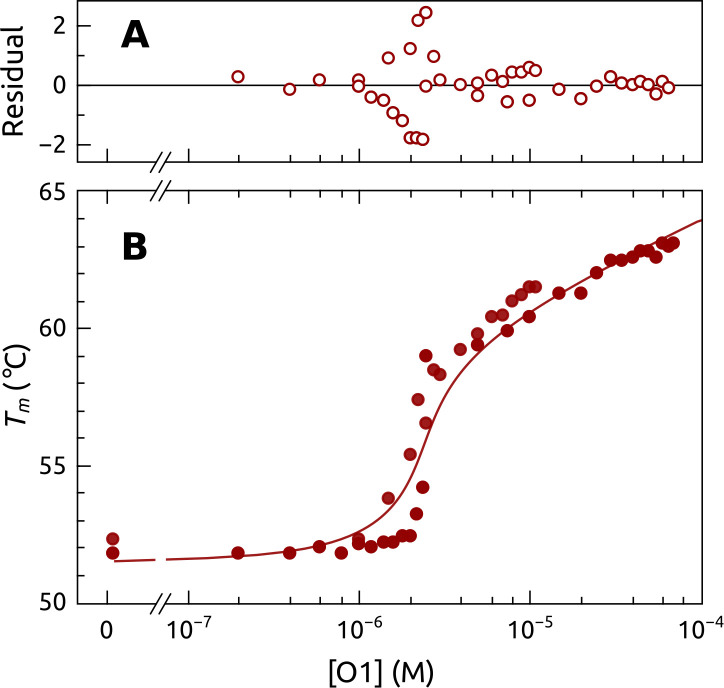
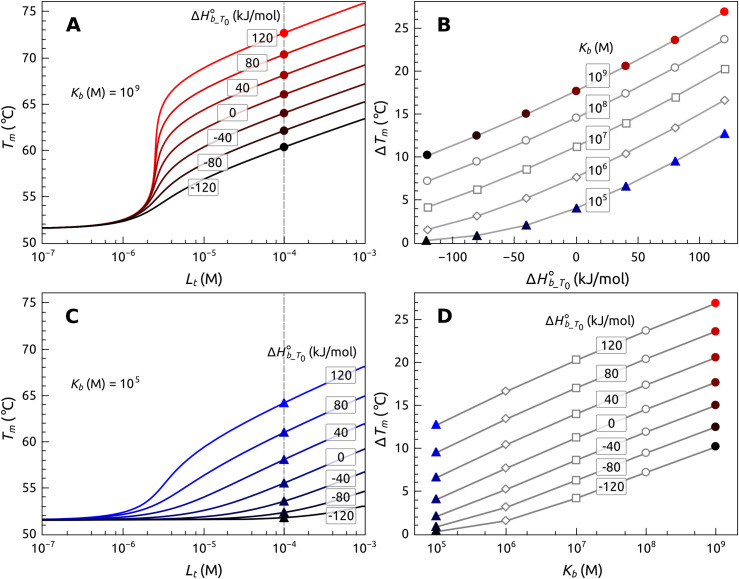
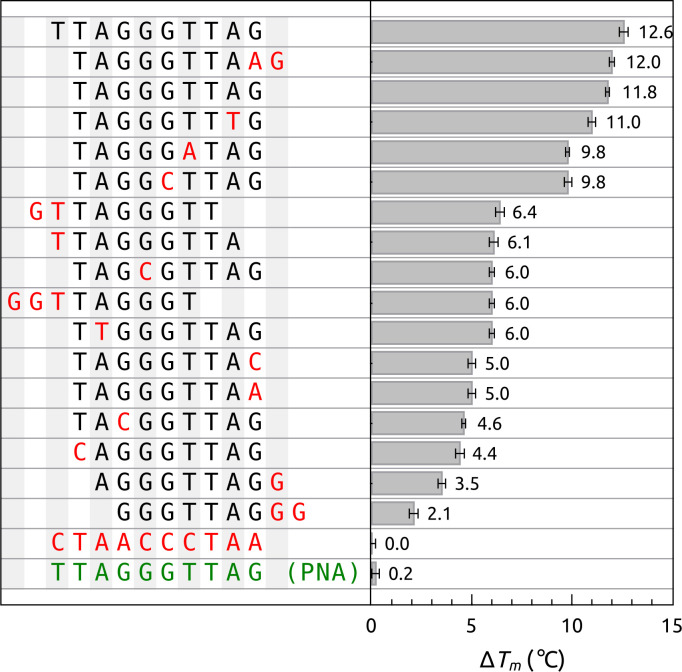
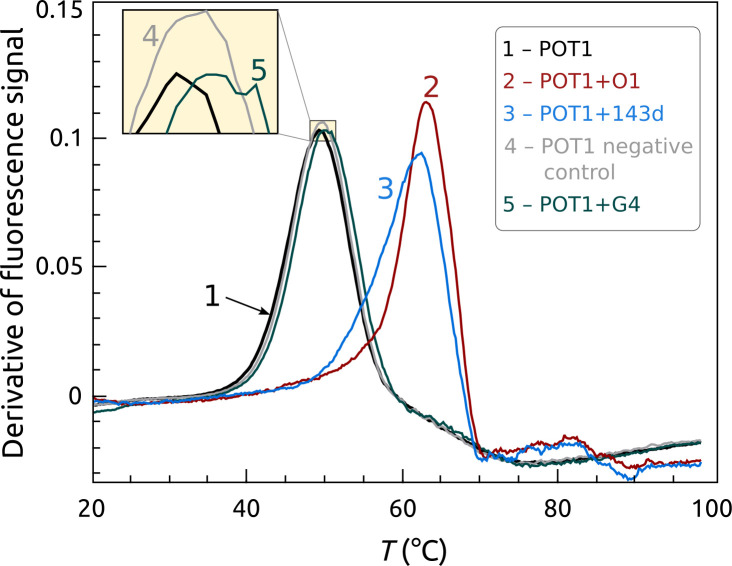
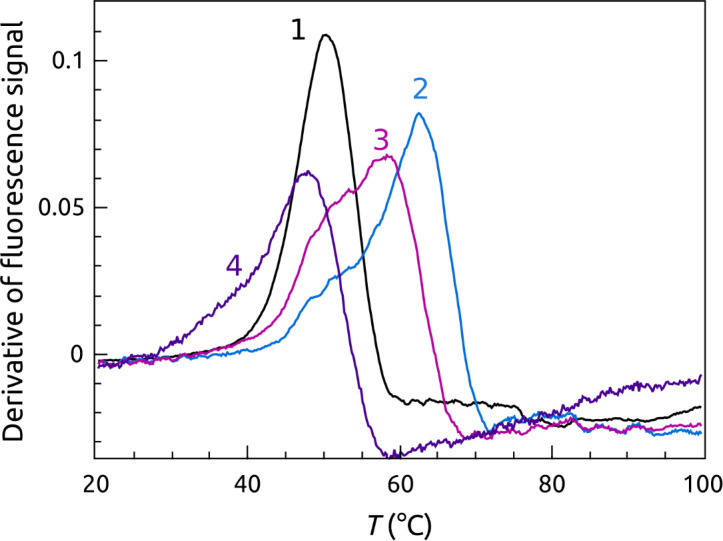
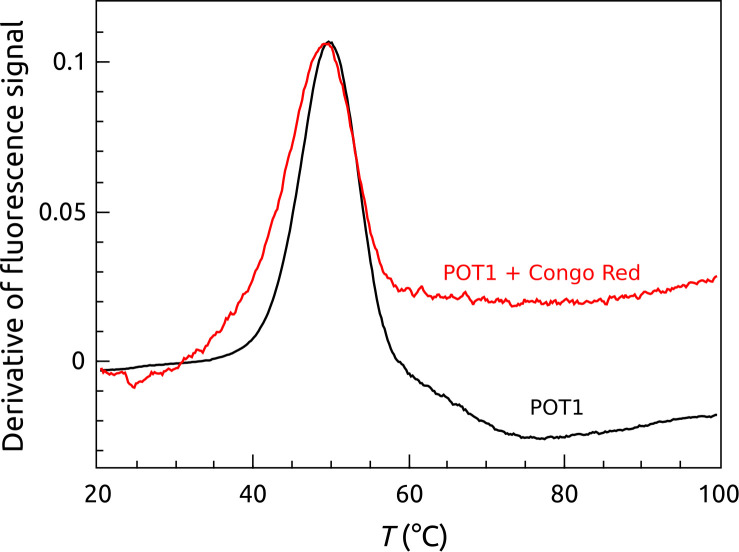
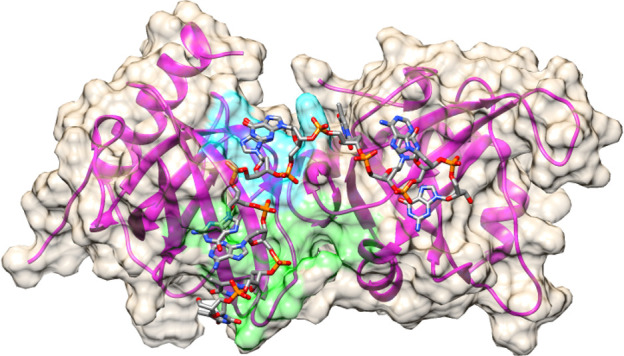
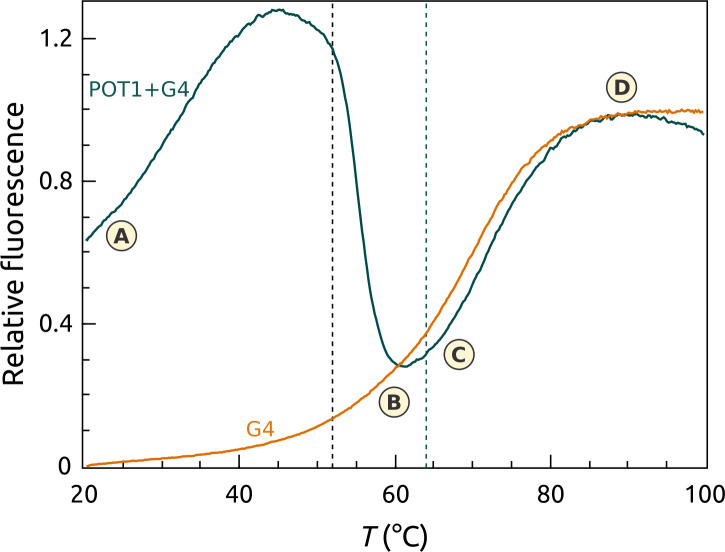
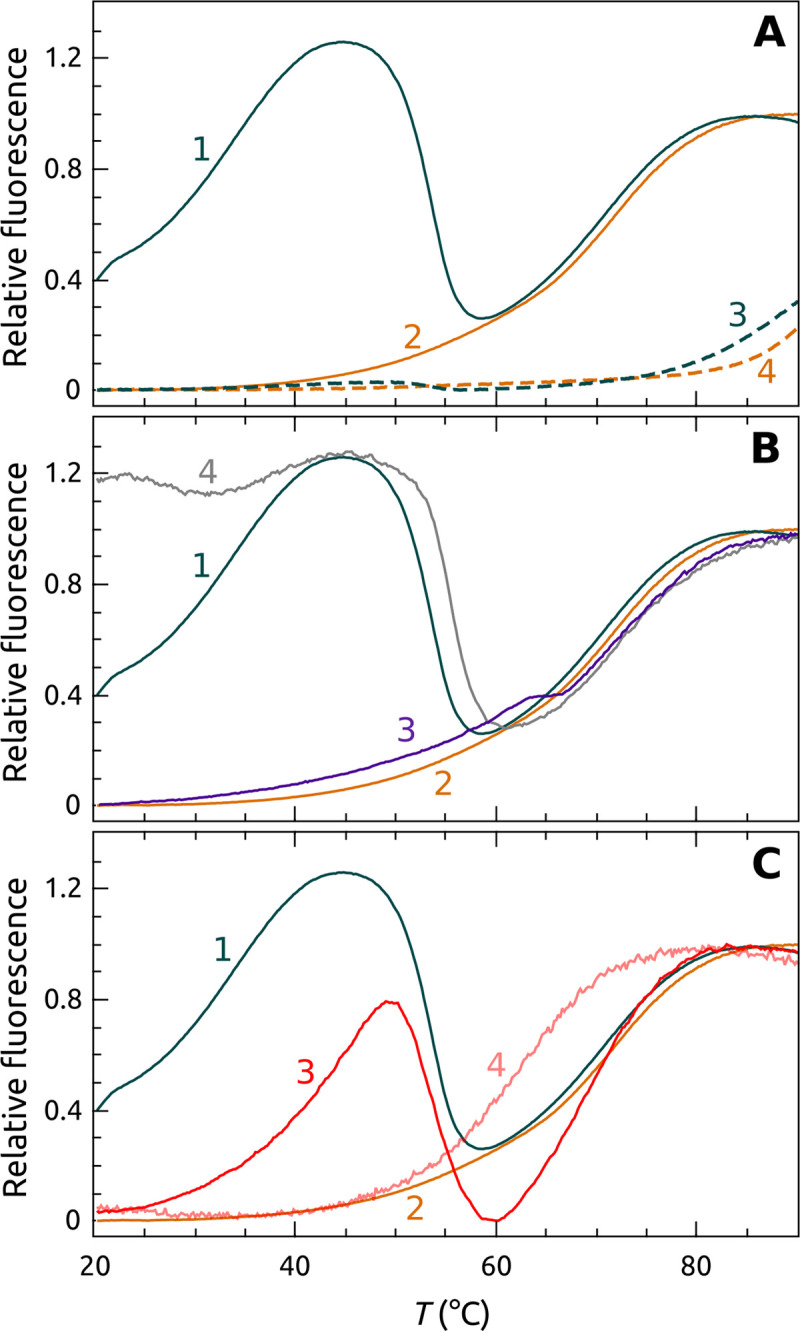
The protein POT1 (Protection of Telomeres 1) is an integral part of the shelterin complex that protects the ends of human chromosomes from degradation or end fusions. It is the only component of shelterin that binds single-stranded DNA. We describe here the application of two separate fluorescent thermal shift assays (FTSA) that provide quantitative biophysical characterization of POT1 stability and its interactions. The first assay uses Sypro Orange™ and monitors the thermal stability of POT1 and its binding under a variety of conditions. This assay is useful for the quality control of POT1 preparations, for biophysical characterization of its DNA binding and, potentially, as an efficient screening tool for binding of small molecule drug candidates. The second assay uses a FRET-labeled human telomeric G-quadruplex structure that reveals the effects of POT1 binding on thermal stability from the DNA frame of reference. These complementary assays provide efficient biophysical approaches for the quantitative characterization of multiple aspects of POT1 structure and function. The results from these assays provide thermodynamics details of POT1 folding, the sequence selectivity of its DNA binding and the thermodynamic profile for its binding to its preferred DNA binding sequence. Most significantly, results from these assays elucidate two mechanisms for the inhibition of POT1 -DNA interactions. The first is by competitive inhibition at the POT1 DNA binding site. The second is indirect and is by stabilization of G-quadruplex formation within the normal POT1 single-stranded DNA sequence to prevent POT1 binding.


Conflict of interest statement

The authors have declared that no competing interests exist.

Figures

Scheme 1
Scheme 1. POT1 (P) binding equilibria and possible inhibition pathways.
U is unfolded POT1, Q represents folded G4 structures, S is unfolded (or single-stranded) G4 structures and L is a small molecule binding ligand. By using different detection probes, FTSA can monitor the fate of different reactants. Sypro Orange (SO) allows POT1 to be monitored, while the G4 is “invisible”. Conversely, FRET-labeled G4 allows the G-quadruplex to be monitored, while POT1 is “invisible”. Sypro Orange would be sensitive to POT1 denaturation, to stabilization by interactions with ssDNA and small molecule ligands FRET labeled G4 would directly sense G-quadruplex unfolding and stabilizing interactions arising from ligand binding or destabilizing interactions with POT1.
Fig 1
Fig 1. Thermal denaturation of POT1 protein in the presence and absence of oligonucleotide O1 (5’TTAGGGTTAG).
(A) Primary FTSA data using Sypro Orange. The black curve is POT1 alone, the red curve is POT1 with added O1 and the blue curve is POT1 with an added negative control oligonucleotide 5’CTAACCCTAA. (B) Data obtained independently by circular dichroism to validate the FTSA. (C) The first derivatives (divided by 10−3) of the curves shown in panel A. (D) Derivative melting curves of the CD denaturation experiment from panel B. The black curve is POT1 alone, the red curve is for POT1 in the presence of excess O1. Conditions: [POT1] = 0.35 μM, [O1] = 0.5 μM.
Fig 2
Fig 2. Titration of POT1 with O1 measured by FTSA.
Tm was measured as a function of added O1 concentration with constant [POT1] = 5 μM. The solid line shows the computed model using the parameters shown in Table 1. The residuals from the “best fit” model are shown in the top panel.
Fig 3
Fig 3. Simulations of expected Tm changes as a function of ligand binding enthalpy (ΔHb_T00) and association constant (Kb).
(A) Simulated titration curves for Kb = 109 M-1 with enthalpy values varied from -120 to 120 kJ mol-1. (C) Simulated titration curves for Kb = 105 M-1 with enthalpy values varied from -120 to 120 kJ mol-1. (B) Tm shifts as a function of enthalpy ([POT1] = 5 μM; [Lt] = 50 μM). (C) The same Tm shift can arise from many combinations of Kb and ΔHb_T00. These simulations used: ΔHU_Tr0 = 44200 J/mol, ΔCp_U = 15000 J/mol-K, ΔSU_Tr0 = 1361.5 J/mol-K, Tm = 51.5°C, ΔCp_b = -500 J/mol-K and [POT1] = 5 μM. Other parameters were varied as indicated.
Fig 4
Fig 4. Screening of the binding of oligonucleotide sequence variants to POT1 by FTSA.
The Δ Tm for POT1 binding to O1 (5’-TTAGGGTTAG) and several sequence variants is shown. Conditions: [POT1] = 5 μM and [DNA] = 50 μM. The PNA sequence shows a Δ Tm of only +1°C with [POT1] = 5 μM and [PNA] = 125 μM.
Fig 5
Fig 5. Binding of POT1 to a human telomeric G4 structure.
POT1 binds to the initially folded telomeric sequence 5’AGGG(TTAGGG)3 (143D) in a coupled reaction to form a single-stranded DNA-POT1 complex. The G4 is initially in a hybrid (“3+1”) conformation under these conditions. FTSA monitors the Tm shift resulting from the stabilization of POT1 upon complex formation. POT1 will not unfold, or bind to, a non-telomeric G4 structure. The curves are: POT1 alone (black), POT1+O1 (red), POT1+143D (blue), POT1 negative control (gray), POT1+G4 1XAV (green). POT1 = 5 μM and DNA = 50 μM.
Fig 6
Fig 6. Inhibition of POT1 binding to telomeric G4 structure by TmPyP4, a G4 binding small molecule.
The curves are: POT1 (1), POT1+143D (2), POT1+143D+ 50 μM TmPyP4 (3) and POT1+143D+ 250 μM TmPyP4 (4).
Fig 7
Fig 7. Effect of Congo Red on the thermal denaturation of POT1.
There is no appreciable shift in the Tm between POT1 (black curve) and POT1 + Congo Red (red curve). Conditions: [POT1] = 5 μM and [Congo Red] = 50 μM.
Fig 8
Fig 8. Target sites on POT1 for virtual screening.
Initially two sites were chosen due to the size of the DNA binding area. POT1A site is shown in green on the surface and encompassed the oligonucleotide residues T1, T2, A3, and G4. POT1B site is shown in cyan on the surface and encompassed residue G5 from the crystal structure (PDB ID: 1XJV) deposited by the Cech laboratory [48]. Details of residue-based protomol generation in Surflex-Dock are provided in Methods.
Fig 9
Fig 9. FTSA using FRET-labeled G4 DNA in the presence (green) and absence (orange) of POT1.
This approach monitors the transition from the frame of reference of the G4 DNA. POT1 transitions would be invisible. The melting of the POT1-G4 complex is explained in the text. The dashed black vertical line shows the transition midpoint of POT1 from the protein frame of reference (Fig 1). The dashed green vertical line shows the transition midpoint of the POT1-G4 complex from the protein frame of reference (Fig 1).
Fig 10
Fig 10. Three ways to inhibit POT1-G4 unfolding.
(A) Inhibition of POT1 binding and unfolding by stabilizing G4 by ligand binding. The orange curve shows denaturation of G4 alone. The curve 1 shows the complicated melting of the POT1-G4 complex. Curve 2 shows melting of the G4 alone. Curves 3 and 4 show the denaturation of POT1 + G4 and G4 alone, respectively, in the presence of the G4 stabilizing ligand BRACO 19 at 1:100 (G4:BRACO 19). (B) Inhibition of POT1 by addition of 5’TTAGGGTTAG (O1), which binds competitively to POT1 to prevent G4 binding and unfolding. The curves 1 and 2 are the same as panel A. The curve 3 shows the denaturation curve for G4 + POT1+O1 at a ratio 1:10. The l curve 4 is a control using the oligonucleotide 5’CTAACCCTAA which does not bind to POT1. (C) Inhibition of POT1 by Congo Red (CR). The curves 3 and 4 show mixtures of G4+POT1+Congo Red. at 1:100 (POT1:CR) and1:10 (POT1:CR), respectively. Curve 1 is the POT1 control; curve 2 is the G4 alone control.

Similar articles

Cited by

References

    1. Baumann P, Cech TR. Pot1, the putative telomere end-binding protein in fission yeast and humans. Science. 2001;292(5519):1171–5. Epub 2001/05/12. 10.1126/science.1060036 . - DOI - PubMed
    1. de Lange T. Shelterin: the protein complex that shapes and safeguards human telomeres. Genes Dev. 2005;19(18):2100–10. Epub 2005/09/17. 10.1101/gad.1346005 . - DOI - PubMed
    1. de Lange T. Shelterin-Mediated Telomere Protection. Annu Rev Genet. 2018;52:223–47. Epub 2018/09/13. 10.1146/annurev-genet-032918-021921 . - DOI - PubMed
    1. Wu Y, Poulos RC, Reddel RR. Role of POT1 in Human Cancer. Cancers. 2020;12(10):2739. 10.3390/cancers12102739 - DOI - PMC - PubMed
    1. Lim CJ, Zaug AJ, Kim HJ, Cech TR. Reconstitution of human shelterin complexes reveals unexpected stoichiometry and dual pathways to enhance telomerase processivity. Nat Commun. 2017;8(1):1075. Epub 2017/10/24. 10.1038/s41467-017-01313-w - DOI - PMC - PubMed

Publication types

LinkOut - more resources