. 2021 Mar 30;17(3):e1008812.
doi: 10.1371/journal.pcbi.1008812. eCollection 2021 Mar.

Estimating incidence of infection from diverse data sources: Zika virus in Puerto Rico, 2016

Affiliations

Estimating incidence of infection from diverse data sources: Zika virus in Puerto Rico, 2016

Talia M Quandelacy et al. PLoS Comput Biol. .

Abstract

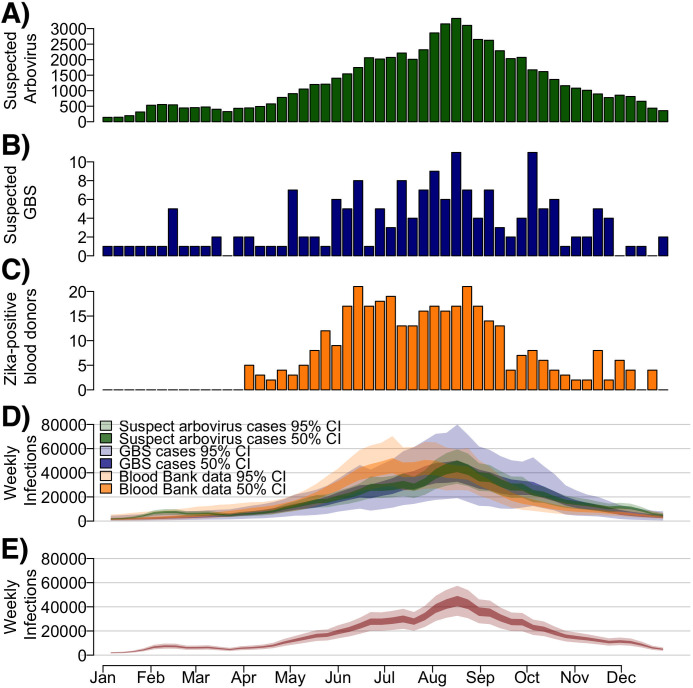
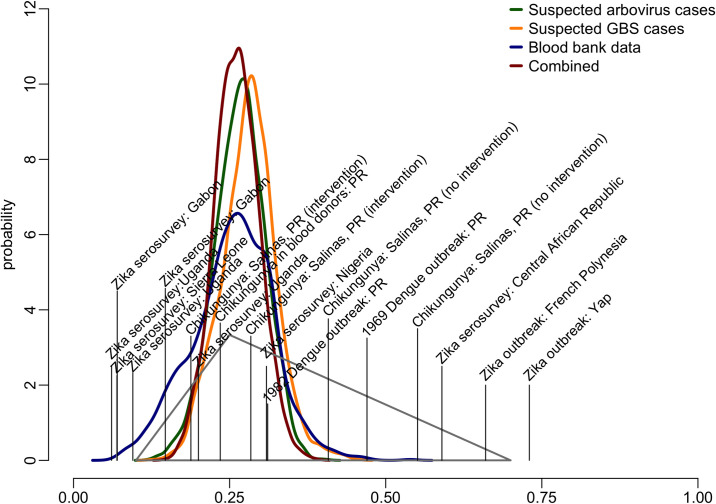
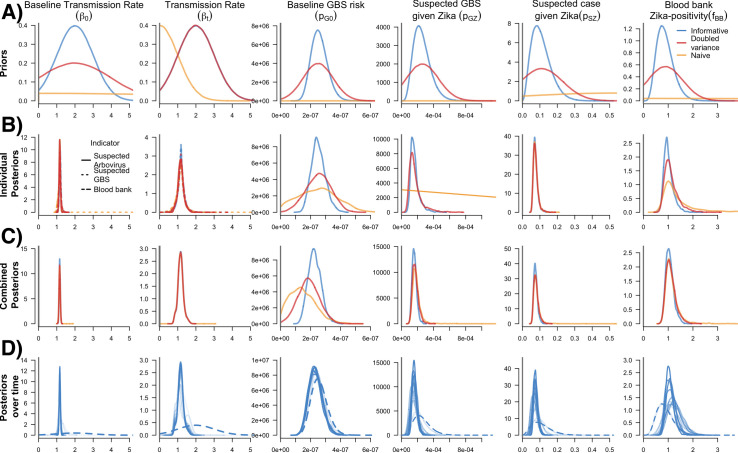
Emerging epidemics are challenging to track. Only a subset of cases is recognized and reported, as seen with the Zika virus (ZIKV) epidemic where large proportions of infection were asymptomatic. However, multiple imperfect indicators of infection provide an opportunity to estimate the underlying incidence of infection. We developed a modeling approach that integrates a generic Time-series Susceptible-Infected-Recovered epidemic model with assumptions about reporting biases in a Bayesian framework and applied it to the 2016 Zika epidemic in Puerto Rico using three indicators: suspected arboviral cases, suspected Zika-associated Guillain-Barré Syndrome cases, and blood bank data. Using this combination of surveillance data, we estimated the peak of the epidemic occurred during the week of August 15, 2016 (the 33rd week of year), and 120 to 140 (50% credible interval [CrI], 95% CrI: 97 to 170) weekly infections per 10,000 population occurred at the peak. By the end of 2016, we estimated that approximately 890,000 (95% CrI: 660,000 to 1,100,000) individuals were infected in 2016 (26%, 95% CrI: 19% to 33%, of the population infected). Utilizing multiple indicators offers the opportunity for real-time and retrospective situational awareness to support epidemic preparedness and response.


Conflict of interest statement

The authors have declared that no competing interests exist.

Figures

Fig 1
Fig 1. Suspected arbovirus cases, suspected ZIKV-associated Guillain-Barré Syndrome (GBS) cases, ZIKV-positive blood donors, and estimated weekly Zika infections during the 2016 outbreak in Puerto Rico.
A) Number of suspected arbovirus cases reported (green). B) Number of suspected ZIKV-associated GBS cases reported. C) Number of ZIKV-positive blood donors identified from blood donor screening. D) Estimated weekly infections using each indicator model separately. Colors refer to each specific indicator used. E) Estimated weekly infections from a model using three combined surveillance indicators. Dark bounds refer to the 50% range (interquartile range) and lighter bounds refer to the 95% credible interval (CrI).
Fig 2
Fig 2. Estimated probability distribution for the proportion of incident ZIKV infections in Puerto Rico in 2016, and probabilities obtained from published literature.
The triangle represents the estimated distribution of possible incident infections from a priori estimates [13,14] based on previous Zika serosurveys (vertical lines), Zika outbreaks and other arboviral outbreaks in Puerto Rico studies published literature [,–25]. Thick lines represent the distribution of the proportion infected estimated from combined surveillance indicators (dark red), and separate surveillance indicators.
Fig 3
Fig 3. Prior and posterior parameter distributions from individual indicator models, the combined indicator model, and the combined model over time.
A) Prior distributions of six model parameters. Color lines refer to assessed variance assumptions of prior distributions in sensitivity analyses. Final individual and combined indicator models used informative priors. B) Posterior distributions of model parameters from individual indicator models. The dashed lines for the Beta parameters refer to the posterior parameter distributions from three individual indicator models (suspected arbovirus cases, suspected GBS and blood bank). Separate plots of the beta parameters for each indicator model are available in Fig B in S1 Text. C) Posterior distributions of model parameters from the combined model. D) Posterior distributions over time (i.e., four-week increments from the end of January 2016 to the end of December 2016) from the combined model using informative priors. Dashed lines refer to the informative priors for each model parameter. Darker transparency of the lines refers to each the posterior distribution from each 4-week increment over time (i.e., the darkest lines coincide with 4-weeks increments further into the time-series).

Similar articles

Cited by

References

    1. Fauci AS, Morens DM. Zika Virus in the Americas—Yet Another Arbovirus Threat. N Engl J Med. 2016;374(7):601–4. 10.1056/NEJMp1600297 - DOI - PubMed
    1. Thomas DL, Sharp TM, Torres J, Armstrong PA, Munoz-Jordan J, Ryff KR, et al.. Local Transmission of Zika Virus—Puerto Rico, November 23, 2015-January 28, 2016. MMWR Morb Mortal Wkly Rep. 2016;65(6):154–8. 10.15585/mmwr.mm6506e2 - DOI - PubMed
    1. Sharp TM, Quandelacy TM, Adams LE, Aponte JT, Lozier MJ, Ryff K, et al.. Epidemiologic and spatiotemporal trends of Zika Virus disease during the 2016 epidemic in Puerto Rico. PLoS Negl Trop Dis. 2020;14(9):e0008532. 10.1371/journal.pntd.0008532 - DOI - PMC - PubMed
    1. Lozier MJ, Burke RM, Lopez J, Acevedo V, Amador M, Read JS, et al.. Differences in Prevalence of Symptomatic Zika Virus Infection, by Age and Sex-Puerto Rico, 2016. J Infect Dis. 2018;217(11):1678–89. 10.1093/infdis/jix630 - DOI - PMC - PubMed
    1. Duffy MR, Chen TH, Hancock WT, Powers AM, Kool JL, Lanciotti RS, et al.. Zika virus outbreak on Yap Island, Federated States of Micronesia. N Engl J Med. 2009;360(24):2536–43. 10.1056/NEJMoa0805715 - DOI - PubMed