

The effect of respiratory activity, non-invasive respiratory support and facemasks on aerosol generation and its relevance to COVID-19
- PMID: 33784793
- PMCID: PMC8250912
- DOI: 10.1111/anae.15475
The effect of respiratory activity, non-invasive respiratory support and facemasks on aerosol generation and its relevance to COVID-19
Abstract
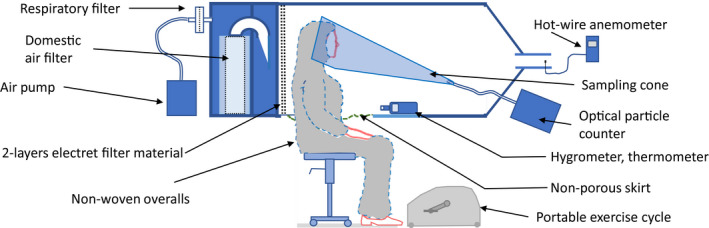
Respirable aerosols (< 5 µm in diameter) present a high risk of SARS-CoV-2 transmission. Guidelines recommend using aerosol precautions during aerosol-generating procedures, and droplet (> 5 µm) precautions at other times. However, emerging evidence indicates respiratory activities may be a more important source of aerosols than clinical procedures such as tracheal intubation. We aimed to measure the size, total number and volume of all human aerosols exhaled during respiratory activities and therapies. We used a novel chamber with an optical particle counter sampling at 100 l.min-1 to count and size-fractionate close to all exhaled particles (0.5-25 µm). We compared emissions from ten healthy subjects during six respiratory activities (quiet breathing; talking; shouting; forced expiratory manoeuvres; exercise; and coughing) with three respiratory therapies (high-flow nasal oxygen and single or dual circuit non-invasive positive pressure ventilation). Activities were repeated while wearing facemasks. When compared with quiet breathing, exertional respiratory activities increased particle counts 34.6-fold during talking and 370.8-fold during coughing (p < 0.001). High-flow nasal oxygen 60 at l.min-1 increased particle counts 2.3-fold (p = 0.031) during quiet breathing. Single and dual circuit non-invasive respiratory therapy at 25/10 cm.H2 O with quiet breathing increased counts by 2.6-fold and 7.8-fold, respectively (both p < 0.001). During exertional activities, respiratory therapies and facemasks reduced emissions compared with activities alone. Respiratory activities (including exertional breathing and coughing) which mimic respiratory patterns during illness generate substantially more aerosols than non-invasive respiratory therapies, which conversely can reduce total emissions. We argue the risk of aerosol exposure is underappreciated and warrants widespread, targeted interventions.
Keywords: aerosol-generating procedure; airborne; nosocomial; particles.
© 2021 Association of Anaesthetists.
Figures
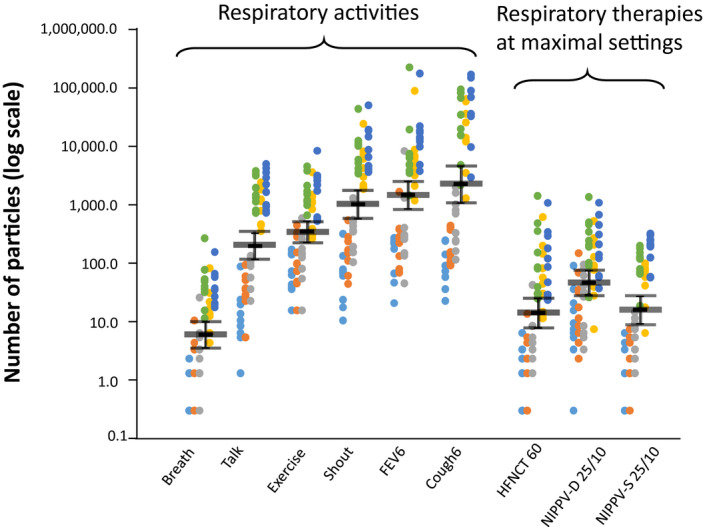
 ). The size range in the six particle bins as measured by the optical particle counter are: 10–25 µm (light blue); 5–10 µm (orange); 3–5 µm (grey); 1–3 µm (green); 0.7–1 µm (yellow); and 0.5–0.7 µm (dark blue). A value of 0.3 was added to all counts to facilitate analysis after log transformation, so zero particle counts are shown as 0.3. Overlapping dot points are not shown. Both the forced expiratory volume (FEV) manoeuvre and cough were repeated six times in the sampling min.
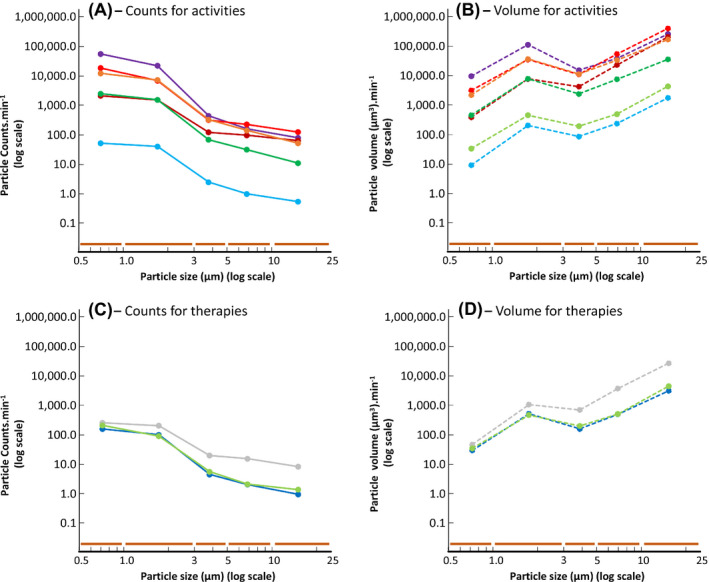
Comment in
-
A novel barrier device and method for protection against airborne pathogens during endotracheal intubation.Eur J Anaesthesiol. 2022 Nov 1;39(11):900-903. doi: 10.1097/EJA.0000000000001731. Epub 2022 Sep 12. Eur J Anaesthesiol. 2022. PMID: 36093872 Free PMC article. No abstract available.
References
-
- Amnesty International . Mapping health worker deaths from COVID‐19. 2020. https://www.amnesty.org/en/latest/news/2020/09/mapping‐covid19‐health‐wo... (accessed 04/01/2021).
-
- Heneghan C, Howdon D, Oke J, Jefferson T. The ongoing problem of UK hospital acquired infections ‐ the centre for evidence‐based medicine. The Centre for Evidence‐Based Medicine ‐ University of Oxford. 2020. https://www.cebm.net/covid‐19/the‐ongoing‐problem‐of‐hospital‐acquired‐i... (accessed 04/01/2021).
-
- The World Health Organisation (WHO) . Scientific brief. Transmission of SARS‐CoV‐2: implications for infection prevention precautions. 2020. https://www.who.int/news‐room/commentaries/detail/transmission‐of‐sars‐c... (accessed 21/01/2021).
-
- Public Health England . COVID‐19: infection prevention and control (IPC). 2021. https://www.gov.uk/government/publications/wuhan‐novel‐coronavirus‐infec... (accessed 30/01/2021).
Publication types
MeSH terms
Grants and funding
LinkOut - more resources
Full Text Sources
Other Literature Sources
Medical
Miscellaneous
