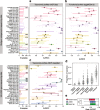
. 2021 Mar 30;22(1):93.
doi: 10.1186/s13059-021-02306-1.

Microbiome meta-analysis and cross-disease comparison enabled by the SIAMCAT machine learning toolbox

Affiliations

Microbiome meta-analysis and cross-disease comparison enabled by the SIAMCAT machine learning toolbox

Jakob Wirbel et al. Genome Biol. .

Abstract

The human microbiome is increasingly mined for diagnostic and therapeutic biomarkers using machine learning (ML). However, metagenomics-specific software is scarce, and overoptimistic evaluation and limited cross-study generalization are prevailing issues. To address these, we developed SIAMCAT, a versatile R toolbox for ML-based comparative metagenomics. We demonstrate its capabilities in a meta-analysis of fecal metagenomic studies (10,803 samples). When naively transferred across studies, ML models lost accuracy and disease specificity, which could however be resolved by a novel training set augmentation strategy. This reveals some biomarkers to be disease-specific, with others shared across multiple conditions. SIAMCAT is freely available from siamcat.embl.de .

Keywords: Machine learning; Meta-analysis; Microbiome data analysis; Microbiome-wide association studies (MWAS); Statistical modeling.


Conflict of interest statement

The authors declared that they have no competing interests.

Figures
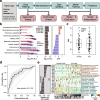
Fig. 1
Fig. 1
SIAMCAT statistical and machine learning approach model differences between the groups of microbiome samples. a Each step in the SIAMCAT workflow (green boxes) is implemented by a function in the R/Bioconductor package (see SIAMCAT vignettes). Functions producing graphical output (red boxes) are illustrated in be for an exemplary analysis using a dataset from Nielsen et al. [27] which contains ulcerative colitis (UC) patients and non-UC controls. b Visualization of the univariate association testing results. The left panel visualizes the distributions of microbial abundance data differing significantly between the groups. Significance (after multiple testing correction) is displayed in the middle panel as horizontal bars. The right panel shows the generalized fold change as a non-parametric measure of effect size [37]. c SIAMCAT offers statistical tests and diagnostic visualizations to identify potential confounders by testing for associations between such meta-variables as covariates and the disease label. The example shows a comparison of body mass index (BMI) between the study groups. The similar distributions between cases and controls suggest that BMI is unlikely to confound UC associations in this dataset. Boxes denote the IQR across all values with the median as a thick black line and the whiskers extending up to the most extreme points within 1.5-fold IQR. d The model evaluation function displays the cross-validation error as a receiver operating characteristic (ROC) curve, with a 95% confidence interval shaded in gray and the area under the receiver operating characteristic curve (AUROC) given below the curve. e SIAMCAT finally generates visualizations aiming to facilitate the interpretation of the machine learning models and their classification performance. This includes a barplot of feature importance (in the case of penalized logistic regression models, bar width corresponds to coefficient values) for the features that are included in the majority of models fitted during cross-validation (percentages indicate the respective fraction of models containing a feature). A heatmap displays their normalized values across all samples (as used for model fitting) along with the classification result (test predictions) and user-defined meta-variables (bottom)
Fig. 2
Fig. 2
Analysis of covariates that potentially confound microbiome-disease associations and classification models. The UC dataset from Nielsen et al. [27] contains fecal metagenomes from subjects enrolled in two different countries and generated using different experimental protocols (data shown is from curatedMetagenomicData with CD cases and additional samples per subject removed). a Visualizations from the SIAMCAT confounder checks reveals that only control samples were taken from Denmark suggesting that any (biological or technical) differences between Danish and Spanish samples might confound a naive analysis for UC-associated differences in microbial abundances. b Analysis of variance (using ranked abundance data) shows many species differ more by country than by disease, with several extreme cases highlighted. c When comparing (FDR-corrected) P values obtained from SIAMCAT’s association testing function applied to the whole dataset (y-axis) to those obtained for just the Danish samples (x-axis), only a very weak correlation is seen and strong confounding becomes apparent for several species including Dorea formicigenerans (highlighted). d Relative abundance differences for Dorea formicigenerans are significantly larger between countries than between Spanish UC cases and controls (P values from Wilcoxon test) (see Fig. 1c for the definition of boxplots). e Distinguishing UC patients from controls with the same workflow is possible with lower accuracy when only samples from Spain are used compared to the full dataset containing Danish and Spanish controls. This implies that in the latter case, the machine learning model is confounded as it exploits the (stronger) country differences (see c and f), not only UC-associated microbiome changes. f This is confirmed by the result that control samples from Denmark and Spain can be very accurately distinguished with an AUROC of 0.96 (using SIAMCAT classification workflows)
Fig. 3
Fig. 3
SIAMCAT aids in avoiding common pitfalls leading to a poor generalization of machine learning models. a Incorrectly setup machine learning workflows can lead to overoptimistic accuracy estimates (overfitting): the first issue arises from a naive combination of feature selection on the whole dataset and subsequent cross-validation on the very same data [80]. The second one arises when samples that were not taken independently (as is the case for replicates or samples taken at multiple time points from the same subject) are randomly partitioned in cross-validation with the aim to assess the cross-subject generalization error (see the main text). b External validation, for which SIAMCAT offers analysis workflows, can expose these issues. The individual steps in the workflow diagram correspond to SIAMCAT functions for fitting a machine learning model and applying it to an external dataset to assess its external validation accuracy (see SIAMCAT vignette: holdout testing with SIAMCAT). c External validation shows overfitting to occur when feature selection and cross-validation are combined incorrectly in a sequential manner, rather than correctly in a nested approach. The correct approach is characterized by a lower (but unbiased) cross-validation accuracy, but better generalization accuracy to external datasets (see header for datasets used). The fewer features are selected, the more pronounced the issue becomes, and in the other extreme case (“all”), feature selection is effectively switched off. d When dependent observations (here by sampling the same individuals at multiple time points) are randomly assigned to cross-validation partitions, effectively the ability of the model to generalize across time points, but not across subjects, is assessed. To correctly estimate the generalization accuracy across subjects, repeated measurements need to be blocked, all of them either into the training or test set. Again, the correct procedure shows lower cross-validation accuracy, but higher external validation accuracy
Fig. 4
Fig. 4
Large-scale application of the SIAMCAT machine learning workflow to human gut metagenomic disease association studies. a Application of SIAMCAT machine learning workflows to taxonomic profiles generated from fecal shotgun metagenomes using the mOTUs2 profiler. Cross-validation performance for discriminating between diseased patients and controls quantified by the area under the ROC curve (AUROC) is indicated by diamonds (95% confidence intervals denoted by horizontal lines) with sample size per dataset given as additional panel (cut at N = 250 and given by numbers instead) (see Table 1 and Additional file 2: Table S1 for information about the included datasets and key for disease abbreviations). b Application of SIAMCAT machine learning workflows to functional profiles generated with eggNOG 4.5 for the same datasets as in a (see Additional file 1: Figure S4, S7 for additional types of and comparison between taxonomic and functional input data). c Cross-validation accuracy of SIAMCAT machine learning workflows as applied to 16S rRNA gene amplicon data for human gut microbiome case-control studies [20] (see a for definitions). d Influence of different parameter choices on the resulting classification accuracy. After training a linear model to predict the AUROC values for each classification task, the variance explained by each parameter was assessed using an ANOVA (see the “Methods” section) (see Fig. 1 for the definition of boxplots). e Performance comparison of machine learning algorithms on gut microbial disease association studies. For each machine learning algorithm, the best AUROC values for each task are shown as boxplots (defined as in d). Generally, the choice of algorithm only has a small effect on classification accuracy, but both the Elastic Net and LASSO performance gains are statistically significant (paired Wilcoxon test: LASSO vs Elastic Net, P = 0.001; LASSO vs random forest, P = 1e−08; Elastic Net vs random forest, P = 4e−14)
Fig. 5
Fig. 5
Control augmentation improves ML model disease specificity and reveals shared and distinct predictors. a Schematic of the control augmentation procedure: control samples from external cohort studies are added to the individual cross-validation folds during model training. Trained models are applied to external studies (either of a different or the same disease) to determine cross-study portability (defined as maintenance of type I error control on external control samples) and cross-disease predictions (i.e., false detection of samples from a different disease). b Cross-study portability was compared between naive and control-augmented models showing consistent improvements due to control augmentation. c Boxplots depicting cross-study portability (left) and prediction rate for other diseases (right) of naive and control-augmented models (see Fig. 1 for the definition of boxplots). d Heatmap showing prediction rates for other diseases (red color scheme) and for the same disease (green color scheme) for control-augmented models on all external datasets. True-positive rates of the models from cross-validation on the original study are indicated by boxes around the tile. Prediction rates over 10% are labeled. e Principal coordinate (PCo) analysis between models based on Canberra distance on model weights. Diamonds represent the mean per dataset in PCo space across cross-validation splits, and lines show the standard deviation. f Visualization of the main selected model weights (predictors corresponding to mOTUs, see the “Methods” section for the definition of cutoffs) by genus and disease. Absolute model weights are shown as a dot plot on top, grouped by genus (including only genera with unambiguous NCBI taxonomy annotation). Below, the number of selected weights per genus is shown as a bar graph, colored by disease (see e for color key). Genus labels at the bottom include the number of mOTUs with at least one selected weight followed by the number of mOTUs in the complete model weight matrix belonging to the respective genus
Fig. 6
Fig. 6
Meta-analysis of CD studies based on fecal shotgun metagenomic data. a Genus-level univariate and multivariable associations with CD across the five included metagenomic studies. The heatmap on the left side shows the generalized fold change for genera with a single-feature AUROC higher than 0.75 or smaller than 0.25 in at least one of the studies. Associations with a false discovery rate (FDR) below 0.1 are highlighted by a star. Statistical significance was tested using a Wilcoxon test and corrected for multiple testing using the Benjamini-Hochberg procedure. Genera are ordered according to the mean fold change across studies, and genera belonging to the Clostridiales order are highlighted by gray boxes. The right side displays the median model weights for the same genera derived from Elastic Net models trained on the five different studies. For each dataset, the top 20 features (regarding their absolute weight) are indicated by their rank. b Variance explained by disease status (CD vs controls) is plotted against the variance explained by differences between studies for individual genera. The dot size is proportional to the mean abundance, and genera included in a are highlighted in red or blue. c Classification accuracy as measured by AUROC is shown as a heatmap for Elastic Net models trained on genus-level abundances to distinguish controls from CD cases. The diagonal displays values resulting from cross-validation (when the test and training set are the same), and off-diagonal boxes show the results from the study-to-study transfer of models

References

    1. Schmidt TSB, Raes J, Bork P. The human gut microbiome: from association to modulation. Cell. 2018;172:1198–1215. doi: 10.1016/j.cell.2018.02.044. - DOI - PubMed
    1. Lynch SV, Pedersen O. The human intestinal microbiome in health and disease. N Engl J Med. Mass Medical Soc; 2016;375:2369–2379. - PubMed
    1. Garrett WS. The gut microbiota and colon cancer. Science. 2019;364:1133–1135. doi: 10.1126/science.aaw2367. - DOI - PubMed
    1. Gevers D, Kugathasan S, Denson LA. The treatment-naive microbiome in new-onset Crohn’s disease. Cell Host Microbe. 2014;15:382–92 Elsevier. - PMC - PubMed
    1. Franzosa EA, Sirota-Madi A, Avila-Pacheco J, Fornelos N, Haiser HJ, Reinker S, et al. Gut microbiome structure and metabolic activity in inflammatory bowel disease. Nat Microbiol. 2019;4:293–305. doi: 10.1038/s41564-018-0306-4. - DOI - PMC - PubMed

Publication types