. 2021 Dec;80(6):746-757.
doi: 10.1016/j.eururo.2021.03.009. Epub 2021 Mar 27.

Nascent Prostate Cancer Heterogeneity Drives Evolution and Resistance to Intense Hormonal Therapy

Affiliations

Nascent Prostate Cancer Heterogeneity Drives Evolution and Resistance to Intense Hormonal Therapy

Scott Wilkinson et al. Eur Urol. 2021 Dec.

Abstract

Background: Patients diagnosed with high risk localized prostate cancer have variable outcomes following surgery. Trials of intense neoadjuvant androgen deprivation therapy (NADT) have shown lower rates of recurrence among patients with minimal residual disease after treatment. The molecular features that distinguish exceptional responders from poor responders are not known.

Objective: To identify genomic and histologic features associated with treatment resistance at baseline.

Design, setting, and participants: Targeted biopsies were obtained from 37 men with intermediate- to high-risk prostate cancer before receiving 6 mo of ADT plus enzalutamide. Biopsy tissues were used for whole-exome sequencing and immunohistochemistry (IHC).

Outcome measurements and statistical analysis: We assessed the relationship of molecular features with final pathologic response using a cutpoint of 0.05 cm3 for residual cancer burden to compare exceptional responders to incomplete and nonresponders. We assessed intratumoral heterogeneity at the tissue and genomic level, and compared the volume of residual disease to the Shannon diversity index for each tumor. We generated multivariate models of resistance based on three molecular features and one histologic feature, with and without multiparametric magnetic resonance imaging estimates of baseline tumor volume.

Results and limitations: Loss of chromosome 10q (containing PTEN) and alterations to TP53 were predictive of poor response, as were the expression of nuclear ERG on IHC and the presence of intraductal carcinoma of the prostate. Patients with incompletely and nonresponding tumors harbored greater tumor diversity as estimated via phylogenetic tree reconstruction from DNA sequencing and analysis of IHC staining. Our four-factor binary model (area under the receiver operating characteristic curve [AUC] 0.89) to predict poor response correlated with greater diversity in our cohort and a validation cohort of 57 Gleason score 8-10 prostate cancers from The Cancer Genome Atlas. When baseline tumor volume was added to the model, it distinguished poor response to NADT with an AUC of 0.98. Prospective use of this model requires further retrospective validation with biopsies from additional trials.

Conclusions: A subset of prostate cancers exhibit greater histologic and genomic diversity at the time of diagnosis, and these localized tumors have greater fitness to resist therapy.

Patient summary: Some prostate cancer tumors do not respond well to a hormonal treatment called androgen deprivation therapy (ADT). We used tumor volume and four other parameters to develop a model to identify tumors that will not respond well to ADT. Treatments other than ADT should be considered for these patients.

Keywords: Androgen deprivation therapy; Diversity; Enzalutamide; Evolution; Genomics; Immunohistochemistry; Neoadjuvant; Prostate cancer.


Figures

Fig. 1 –
Fig. 1 –
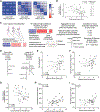
Genomic landscape of prostate tumors before treatment with neoadjuvant androgen deprivation therapy plus enzalutamide. (A) Genomic and clinical data per patient (n = 37). One patient classified clinically as a nonresponder underwent transurethral resection of prostate tumor instead of radical prostatectomy so RCB could not be calculated. BTB = baseline tumor burden (cm3); RCB = residual cancer burden (cm3); PGA = percent genome altered; SNVs = small nucleotide variants; PSA = prostate-specific antigen (ng/ml); BGG = highest biopsy Gleason group. (B) Distribution of RCB values across 15 exceptional responder (ER) and 21 incomplete and nonresponder (INR) cases with a cutpoint of 0.05 cm3. (C,D) Frequency and odds ratio for 27 genomic features for comparison of INR and ER (C) cases and (D) lesions. (E,F) Grouping of altered genes into eight pathways, with the proportion of affected (E) cases and (F) lesions with genes altered per pathway. For C–F, each factor was considered independently in a two-sided Fisher’s exact test, and the effect size is given as an odds ratio (OR). ORs >1 favor INR. For C–F, these are exploratory analyses that are underpowered for per-gene analyses, and thus may not be replicable in other cohorts when adjustments for multiple testing are applied.
Fig. 2 –
Fig. 2 –
Comparison of clinicopathologic features between exceptional responder (ER) and incomplete and nonresponder (INR) cases. (A) Baseline patient-level magnetic resonance imaging (MRI) tumor volumes for ER versus INR cases, plotted on a log10 scale, p = 0.0002 by Mann-Whitney U test. (B) Baseline serum prostate-specific antigen (PSA) for ER versus INR cases, plotted on a log10 scale, p = 0.6 by Mann-Whitney U test. For A and B, the effect size d is determined as the Hodges-Lehmann median percent difference, based on the log10-transformed value. (C) Highest Gleason grade group (GG) among all pretreatment biopsies for each case; p = 0.5 by the Cochran-Armitage test for trend for each GG between ER and INR. The effect size is given by the estimated odds ratio (OR; with 95% confidence interval) for each increment in Gleason grade group. (D) Frequency and odds ratio for five histologic and pathologic features for INR versus ER cases. Odds ratio >1 favors INR. (E) Representative micrographs of the adverse histologic features considered in D. For intraductal carcinoma, PIN-4 cocktail stains basal cells with brown chromogen (antibodies against cytokeratin 5, cytokeratin 14, and p63) and luminal cells with red chromogen (antibody against α-methylacyl-CoA racemase). For nuclear ERG staining, endogenous ERG is observed in endothelial cells for ERG-negative cases. H&E = hematoxylin and eosin. Scale bar: 50 μm.
Fig. 3 –
Fig. 3 –
Observations of histologic diversity in baseline biopsies. (A) Enumeration of PTEN reduction observed via anti-PTEN immunohistochemistry (IHC) in exceptional responder (ER) and incomplete and nonresponder (INR) cases. The effect size is given as an odds ratio (OR), for which a value >1 favors IHC reduction with INR. (B) Per-patient and (C) per-lesion enumeration when PTEN and/or ERG IHC is positive and negative within the same case. A score of 1 corresponds to either PTEN or ERG showing discordance. A score of 2 indicates both PTEN and ERG show heterogeneity within the same case. Statistical significance was determined using the Cochran-Armitage test for trend. The effect size is given by the estimated OR (95% confidence interval), which is for each increment in heterogeneity observations. (D) A representative case demonstrated PTEN and ERG heterogeneity by IHC (score of 2), showing a region with intact PTEN and positive ERG staining (top), a region with reduced PTEN staining but negative staining for ERG (middle), and a region with reduced PTEN and positive ERG staining (bottom). All three insets are from the same biopsy sample. (E) Workflow for machine-based IHC quantification using an autostainer for reproducible staining conditions, followed by slide scanning and cell/nucleus quantification using the Definiens platform. (F) Bubble plot of IHC correlations between histology intensity (HI) score, residual cancer burden (RCB), and Shannon diversity index (SDI). The bubble size is inversely proportional to the Spearman rank correlation p value, and the color scale is red for more positive coefficients of correlation and blue for negative. (G,K) Correlation of the log10-transformed RCB for each case plotted against the HI score for each case for (G) anti–prostate-specific antigen (PSA) and (K) anti–glucocorticoid receptor (GR) IHC. (H,L) Shannon diversity index for (H) anti-PSA and (L) anti-GR IHC for each case plotted against the HI score for each case for anti-PSA r anti-GR IHC. (I,M) Correlation of the log10-transformed RCB for each case plotted against the Shannon diversity index for each case for (I) anti-PSA and (M) anti-GR IHC. For G–I and K–M, nonparametric Spearman correlation analyses ρ values are shown with their respective p values. Lines and bands represent linear regression lines and 95% confidence intervals, respectively. Owing to the small number of points, the scatter plots in H and L appear parabolic with no known explanation, although the trend over most of the data suggests a linear relationship. (J) Representative regions of high, medium, and low staining diversity index and low, medium, and high HI, respectively, for anti-PSA IHC. Scale bar: 50 μm.
Fig. 4 –
Fig. 4 –
Measures of genomic diversity. (A) Correlation matrices for three representative cases with four tumors each, showing the range of similarities among genomic gains and losses across 180 predefined regions. (B) Median Pearson correlation coefficient for each multiregion case as a function of the log10-transformed residual cancer burden (RCB) value. The number of foci dissected for each case is depicted by the size of the circle. (C) Schematic showing the workflow to harmonize multiregion sampling data and processing for phylogenetic clone tree reconstruction. CNV = copy number variation. (D) Representative linear and branched tree structures. (E) Scatter plot of the number of nodes in each phylogenetic tree versus the log10-transformed RCB for each case. (F) Scatter plot of the genomic Shannon diversity index (SDI) for each case versus the corresponding log10-transformed RCB. (G) Median Pearson correlation coefficient for each multiregion case from B versus the genomic SDI for each case. (H) Percentage of the genome altered (PGA) plotted against the genomic SDI for each case. (I) PGA versus the log10-transformed RCB for each case. For B and E–I, nonparametric Spearman correlation analyses p values are shown with the respective p values. Lines and bands represent linear regression lines and 95% confidence intervals, respectively.
Fig. 5 –
Fig. 5 –
A multivariate model of poor response to intense neoadjuvant androgen deprivation therapy (NADT) is associated with genomic diversity. (A) Spearman correlation matrix of each binary factor (1 = presence, 0 = absence) across each of the 37 patients in the study cohort. IDC-P = presence of intraductal carcinoma; 10q loss = at least of half of chromosome arm 10q deleted hemizygously as determined using the GISTIC algorithm; ERG = overexpression of nuclear ERG determined via immunohistochemistry; TP53 = loss-of-function alterations or hotspot mutations to TP53, including copy number loss, as determined via GISTIC. (B) Bubble plot of the frequency of each four-factor combination observed in the trial cohort and the proportion observed in the incomplete and nonresponder (INR) group. (C) Receiver operating characteristic curve for the ability of the INR probability to distinguish exceptional responder (ER) from INR cases in the trial cohort using the four-factor model. (D,E) Reapplication of the four-factor model to trial patients and (D) the number of tumor subpopulations or (E) the genomic Shannon diversity index (SDI) for each group after reclassification. Statistical significance determined using the Mann-Whitney U test for the number of tumor populations and Welch’s t test for genomic SDI. The line represents the (D) median or (E) mean value. The effect size d is determined as the Hodges-Lehmann (D) difference of medians or (E) difference of means. (F) Pearson correlation of the genomic SDI and INR probability for the trial cohort. (G) Genomic SDI for The Cancer Genome Atlas (TCGA) validation cohort as classified as ER or INR by the four-factor model. Statistical significance was determined using Welch’s t test. The line represents the mean value. The effect size d was determined as the difference of means. (H) Pearson correlation of the genomic SDI and INR probability for the validation cohort. (I) Receiver operating characteristic curve for the ability of the INR probability to distinguish ER from INR cases in the trial cohort based on the four-factor model plus the baseline relative tumor burden.

References

    1. Hamdy FC, Donovan JL, Lane JA, et al. 10-Year outcomes after monitoring, surgery, or radiotherapy for localized prostate cancer. N Engl J Med 2016;375:1415–24. - PubMed
    1. Boutros PC, Fraser M, van der Kwast T, Bristow RG. Clonality of localized and metastatic prostate cancer. Curr Opin Urol 2016;26:219–24. - PubMed
    1. Beltran H, Prandi D, Mosquera JM, et al. Divergent clonal evolution of castration-resistant neuroendocrine prostate cancer. Nat Med 2016;22:298–305. - PMC - PubMed
    1. Espiritu SMG, Liu LY, Rubanova Y, et al. The evolutionary landscape of localized prostate cancers drives clinical aggression. Cell 2018;173:1003–13.e15. - PubMed
    1. Gerstung M, Jolly C, Leshchiner I, et al. The evolutionary history of 2,658 cancers. Nature 2020;578:122–8. - PMC - PubMed

Publication types