. 2021 Mar 30;14(676):eaaz2120.
doi: 10.1126/scisignal.aaz2120.

Inositol 1,4,5-trisphosphate 3-kinase B promotes Ca2+ mobilization and the inflammatory activity of dendritic cells

Affiliations

Inositol 1,4,5-trisphosphate 3-kinase B promotes Ca2+ mobilization and the inflammatory activity of dendritic cells

Laura Marongiu et al. Sci Signal. .

Abstract

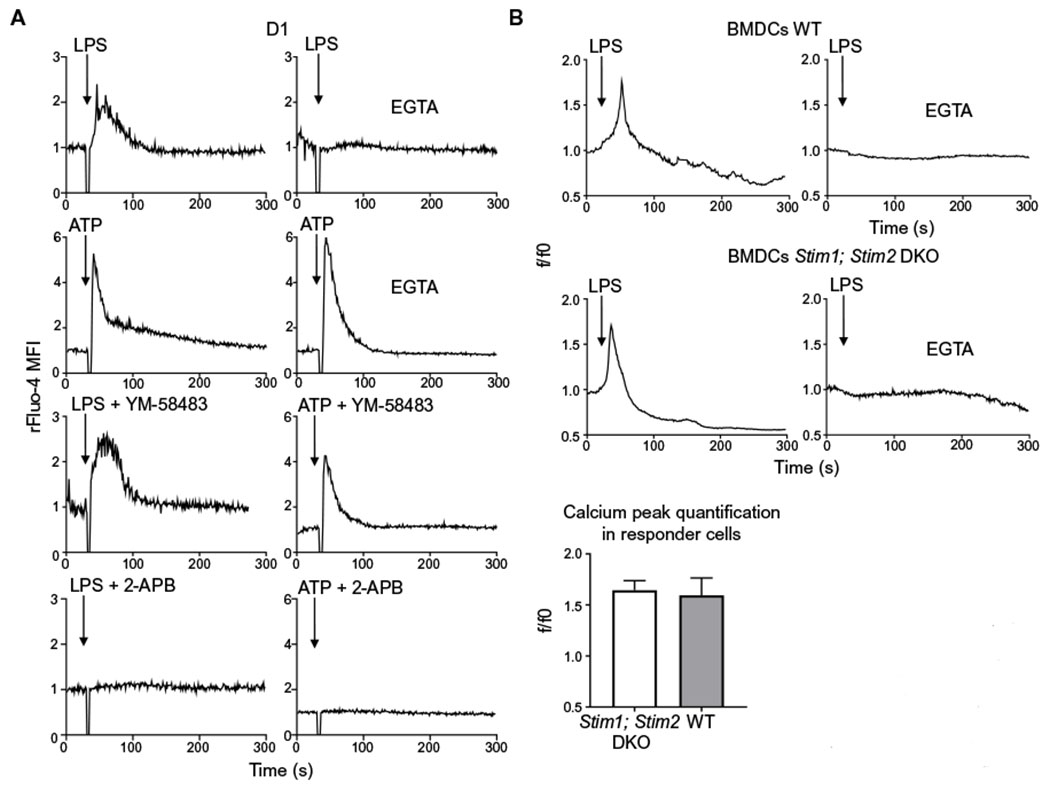
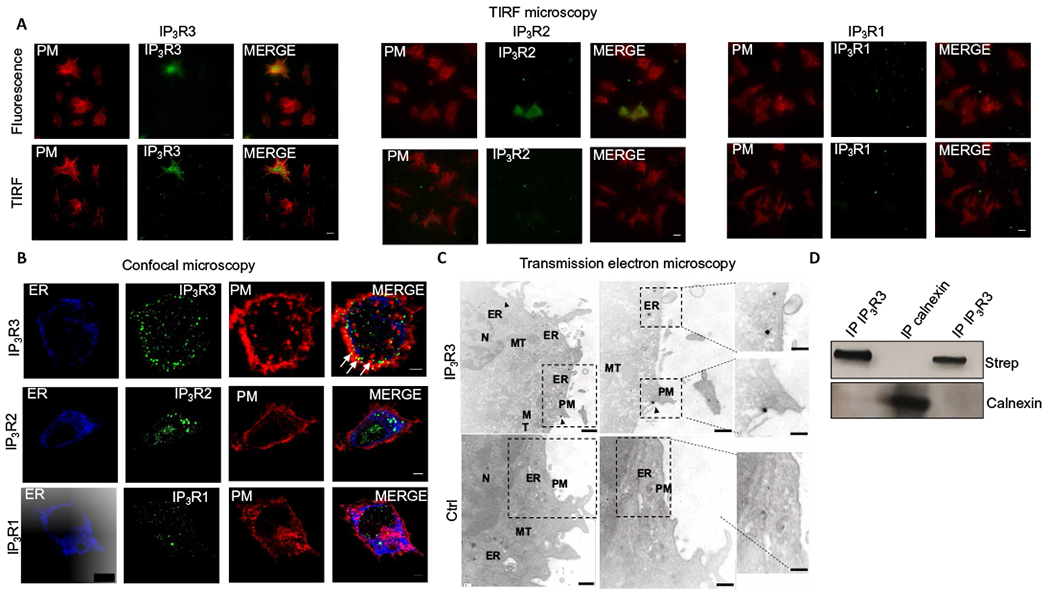
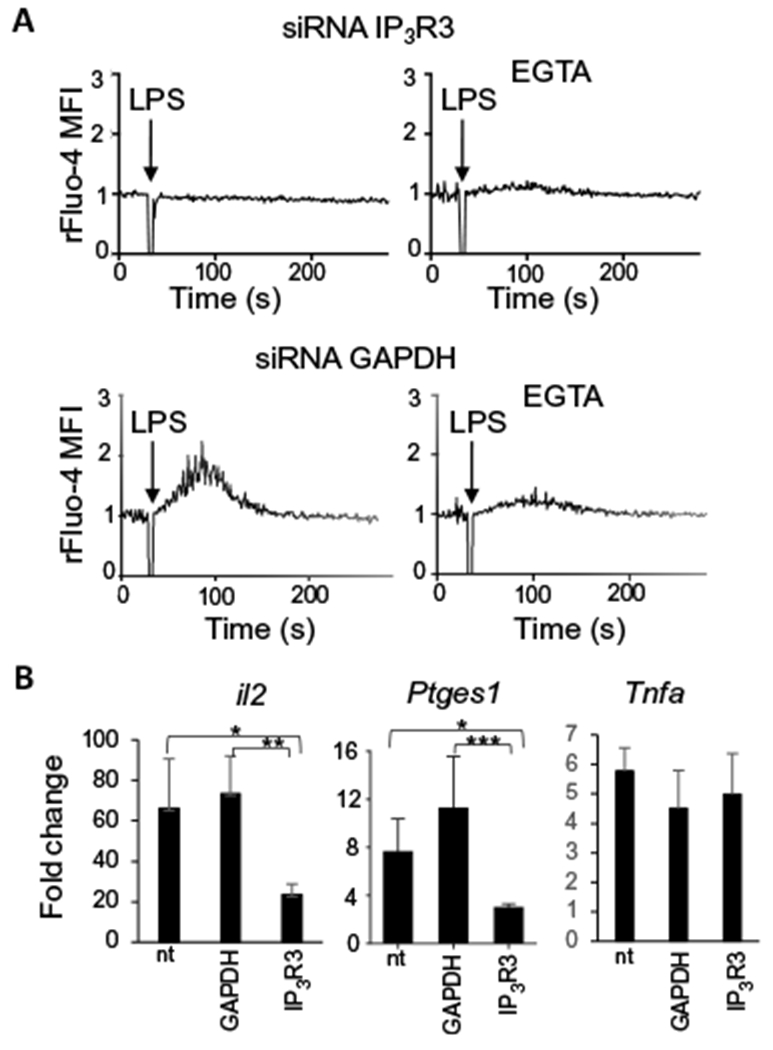
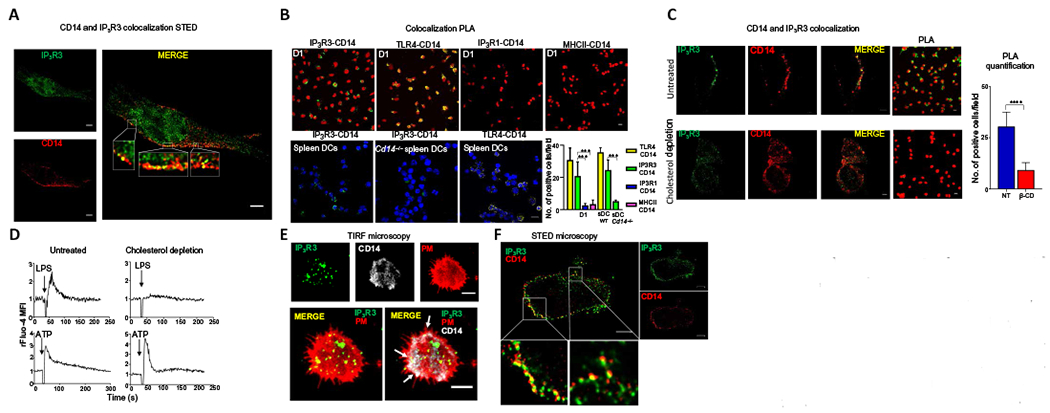
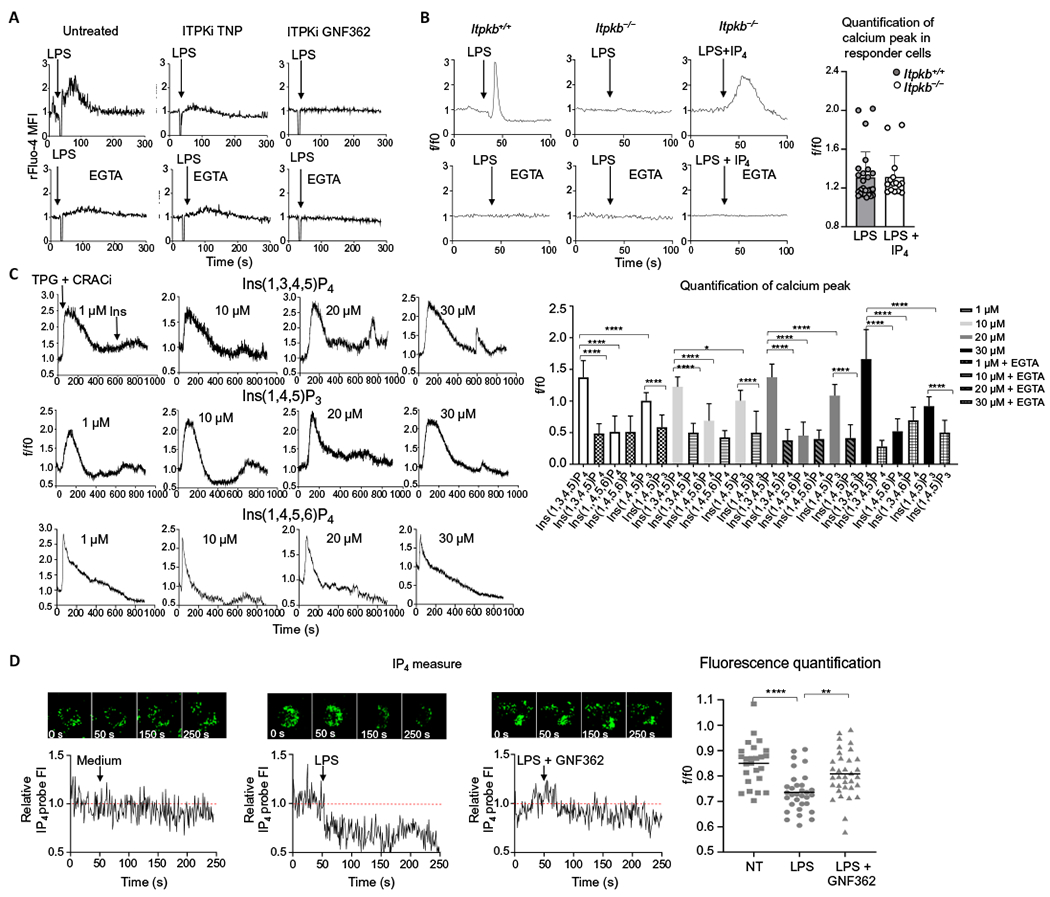
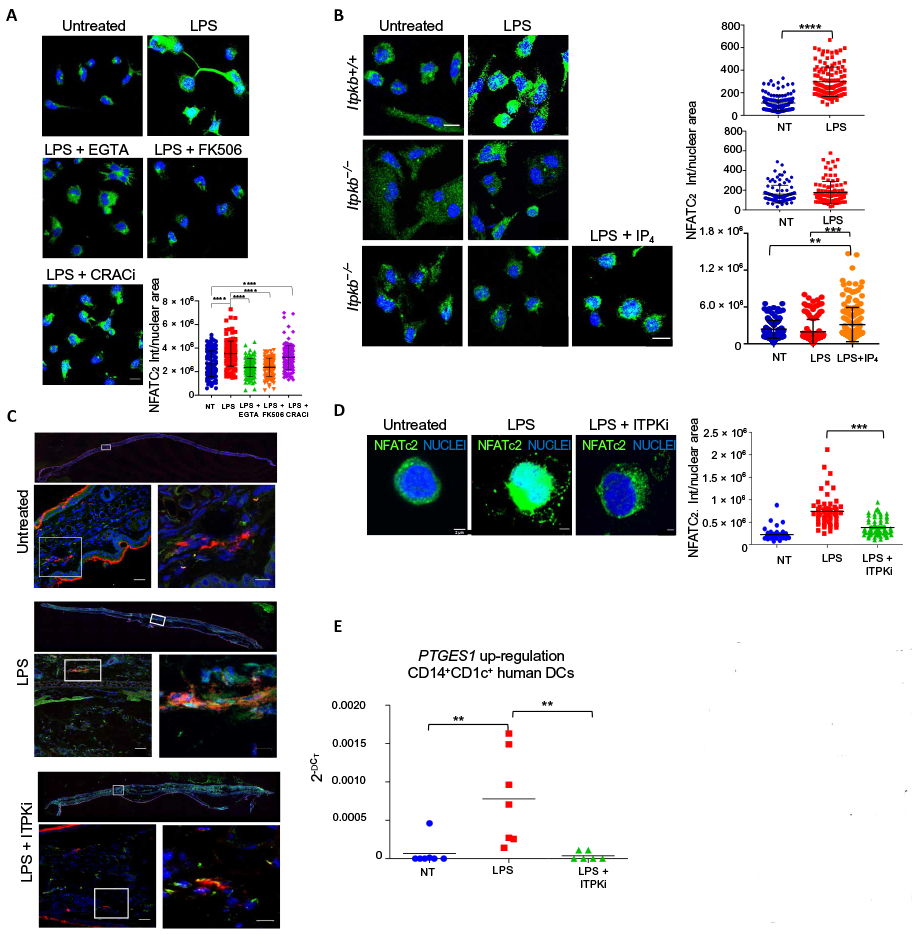
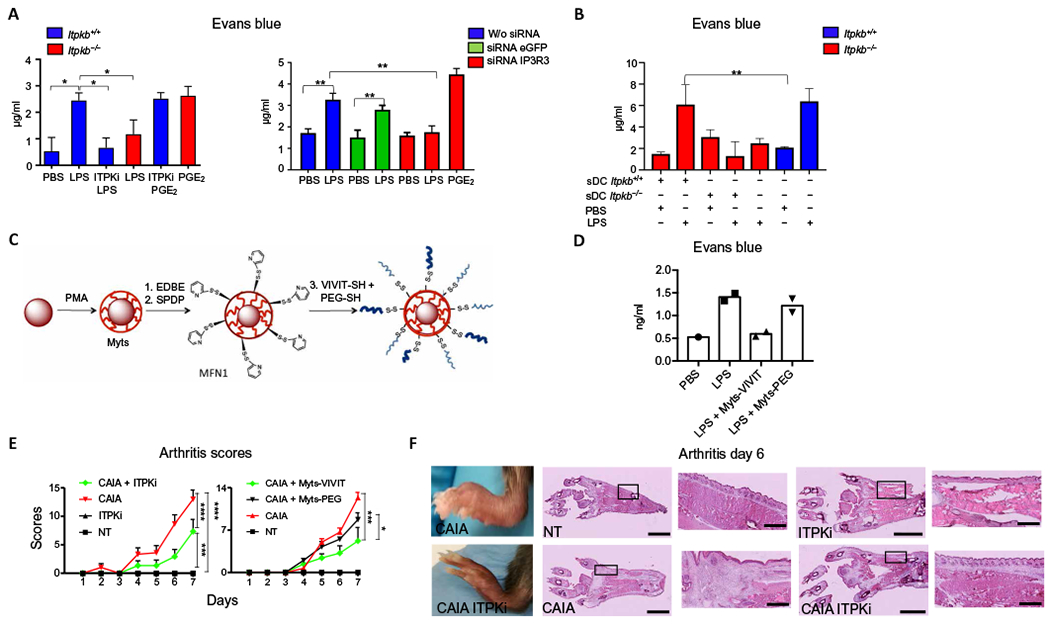
Innate immune responses to Gram-negative bacteria depend on the recognition of lipopolysaccharide (LPS) by a receptor complex that includes CD14 and TLR4. In dendritic cells (DCs), CD14 enhances the activation not only of TLR4 but also that of the NFAT family of transcription factors, which suppresses cell survival and promotes the production of inflammatory mediators. NFAT activation requires Ca2+ mobilization. In DCs, Ca2+ mobilization in response to LPS depends on phospholipase C γ2 (PLCγ2), which produces inositol 1,4,5-trisphosphate (IP3). Here, we showed that the IP3 receptor 3 (IP3R3) and ITPKB, a kinase that converts IP3 to inositol 1,3,4,5-tetrakisphosphate (IP4), were both necessary for Ca2+ mobilization and NFAT activation in mouse and human DCs. A pool of IP3R3 was located on the plasma membrane of DCs, where it colocalized with CD14 and ITPKB. Upon LPS binding to CD14, ITPKB was required for Ca2+ mobilization through plasma membrane-localized IP3R3 and for NFAT nuclear translocation. Pharmacological inhibition of ITPKB in mice reduced both LPS-induced tissue swelling and the severity of inflammatory arthritis to a similar extent as that induced by the inhibition of NFAT using nanoparticles that delivered an NFAT-inhibiting peptide specifically to phagocytic cells. Our results suggest that ITPKB may represent a promising target for anti-inflammatory therapies that aim to inhibit specific DC functions.


Conflict of interest statement

Competing interests: I.Z. is a consultant for Implicit Biosciences, which commercializes the humanized anti-CD14 antibody IC14. D.P., F.G., M.C., and I.Z. are inventors on patent application PCT/IB2013/055943, WO2014013473 A1 submitted by University of Milano-Bicocca that covers the use of nanoparticles targeting NFAT.

Figures

Fig. 1.
Fig. 1.. Modalities of Ca2+ mobilization induced by LPS in DCs.
(A) Representative Ca2+ transients in mouse D1 cells treated with LPS or ATP in the presence or absence of the Ca2+ chelator EGTA, the CRAC inhibitor YM-58483, or the general ion channels inhibitor 2-APB. Arrows indicate the time (30 s) of LPS or ATP addition. Ca2+ fluctuations were evaluated by FACS on bulk populations as changes in Fluo-4 fluorescence in response to the stimuli and normalized to the value during the 30 s before LPS or ATP addition (rFluo-4 MFI). Traces are representative of three independent experiments. (B) Representative Ca2+ transients in wild-type (WT) and Stim1; Stim2 double-deficient mouse BMDCs. Ca2+ mobilization was measured by confocal microscopy in the presence or absence of EGTA. Arrows indicate the time (30 s) of LPS administration. Ca2+ fluctuations were evaluated as changes in Fluo-4 fluorescence in response to the stimuli and normalized over the first 30 s of analysis (f/f0). A minimum number of 100 cells in each group was analyzed. The quantification analysis shows the increase of fluorescence intensity in the peak interval for 25 responder cells. One experiment representative of two independent experiments is shown. DKO, double-knockout.
Fig. 2.
Fig. 2.. IP3R3 channels are present on the plasma membranes of DCs.
(A) TIRF imaging for plasma membrane (PM) glycoproteins (red) and the indicated IP3Rs (green) in D1 cells. Scale bars, 10 μm. Images are representative of three independent experiments. (B) Confocal microscopy of D1 cells labeled to show the endoplasmic reticulum (ER) marker calnexin (blue), the indicated IP3Rs (green), and the plasma membrane (red). Scale bars, 3 μm. Images are representative of three independent experiments. Arrows indicate sites of IP3R3 and plasma membrane colocalization. (C) TEM showing IP3R3 localization in D1 cells stained with a primary antibody specific for IP3R3 and nanogold-conjugated secondary antibody (IP3R3) or with only nanogold-conjugated secondary antibody as a control (control). Arrows indicate IP3R3 localized at the plasma membrane. ER, mitochondria (MT), and nucleus (N) are also indicated. Scale bars, 200 nm (main) and 50 nm (insets). Images are representative of three independent experiments. (D) D1 cells were surface-biotinylated, and the lysates subjected to immunoprecipitation with two different antibodies specific for IP3R3 (lanes 1 and 3) or an antibody specific for calnexin (lane 2) as a control. After SDS-polyacrylamide gel electrophoresis and transfer to nitrocellulose, membranes were probed with streptavidin or calnexin antibody.
Fig. 3.
Fig. 3.. IP3R3 channels are required for LPS-induced Ca2+ mobilization and NFAT activation in DCs.
(A) Ca2+ transients induced by LPS in D1 cells, 48 hours after the knockdown of IP3R3 with specific siRNAs in the presence or absence of the extracellular calcium chelator EGTA. Knockdown of GAPDH with specific siRNA was used as negative control. Arrows indicate the time (30 s) of LPS administration. Ca2+ fluctuations were evaluated by FACS on bulk populations as changes in the Fluo-4 fluorescence, in response to the stimuli, and were normalized to the value during the 30 s before LPS addition (rFluo-4 MFI). Traces are representative of three independent experiments. (B) Real-time polymerase chain reaction (PCR) analysis of the increase in il2, Ptges1, and Tnfa expression after 4 hours of LPS treatment in D1 cells transfected or not (nt) with siRNAs specific for GAPDH (control) or IP3R3. Values indicate the mean ± SEM from six independent experiments. Statistical significance was determined with one-way analysis of variance, followed by Tukey’s multiple comparisons test, *P < 0.05, **P < 0.01 and ***P < 0.001.
Fig. 4.
Fig. 4.. IP3R3 and CD14 colocalize in lipid rafts at the plasma membrane in mouse and human DCs.
(A) STED microscopy showing localization of IP3R3 and CD14 in mouse D1 cells. Scale bars, 2 μm. Images are representative of three independent experiments. (B) PLA visualized by confocal microscopy for the indicated pairs of proteins in LPS-stimulated D1 cells or splenic DCs (sDCs) from WT or Cd14−/− mice. Sites of colocalization between CD14 and IP3R3 appear green. Sites of CD14 and TLR4 colocalization appear yellow (positive control). PLA between CD14 and IP3R1 (blue) and between CD14 and MHCII (pink) are negative controls. Nuclei are shown in red (top) or in blue (bottom). Scale bar, 10 μm. Images are representative of three independent experiments. Numbers of cells showing IP3R3-CD14, TLR4-CD14, IP3R1-CD14, and MHCII-CD14 colocalization were quantified. Statistical significance was determined with Sidak’s multiple comparisons test, ***P < 0.001, n = 10 fields of cells analyzed from three independent experiments. (C) Immunofluorescence and PLA showing IP3R3 (green) and CD14 (red) in untreated D1 cells and after lipid raft disruption by β-cyclodextrin (cholesterol depletion). Scale bars, 3 μm. Images are representative of three independent experiments. Numbers of cells showing IP3R3-CD14 colocalization in untreated (NT) or treated (β-CD) cells are also shown. Statistical significance was determined with unpaired Student’s t test, ****P < 0.0001, n = 8 fields of cells analyzed from three independent experiments. (D) Ca2+ transients in D1 cells after lipid raft disruption. Cells were treated (cholesterol depletion) or not (untreated) with β-cyclodextrin for 30 min before LPS activation. Arrows indicate the time of LPS or ATP (100 μM) administration. Ca2+ fluctuations were evaluated by FACS on the bulk population as changes in Fluo-4 fluorescence in response to the stimuli and normalized over the first 30 s of analysis (rFluo-4 MFI). Traces are representative of three independent experiments. (E) TIRF microscopy showing IP3R3 and CD14 in human CD1c+CD14+ cells. PM, plasma membrane (red). Scale bars, 2 μm. Images are representative of cells from five different donors. (F) STED microscopy showing IP3 R3 and CD14 in human CD1c+CD14+ cells. Scale bars, 2 μm. Images are representative of cells from three different donors.
Fig. 5.
Fig. 5.. IP4 is a second messenger required for Ca2+ mobilization in DCs after LPS stimulation.
(A) Ca2+ transients in mouse D1 cells that were untreated or pretreated with the ITPK inhibitors (ITPKi) TNP or GNF362 before being stimulated with LPS in the absence or presence or EGTA, as indicated. Arrows indicate LPS administration at 30 s. Ca2+ fluctuations were evaluated by FACS on the bulk population as changes in the Fluo-4 fluorescence in response to the stimuli and normalized over the first 30 s of analysis (rFluo-4 MFI). Traces are representative of three independent experiments. (B) Representative Ca2+ transients in BMDCs from WT (Itpkb+/+) and Itpkb−/− mice in the presence or absence of EGTA. Arrows indicate the addition of LPS or LPS plus IP4 at 40 s. Ca2+ fluctuations were measured by confocal microscopy as changes in Fluo-4 fluorescence in response to the stimuli and normalized over the first 40 s of analysis (rFluo-4 MFI). A minimum number of 100 cells in each group was analyzed. The quantification analysis shows the increase of fluorescence intensity in the peak interval in n = 25 responder cells. (C) Representative Ca2+ profiles of D1 cells pretreated with CRAC inhibitor (CRACi) YM-58483 and then treated with thapsigargin (TPG) to deplete the intracellular Ca2+ stores and, last, with cell-permeant Ins(,,,,)P4, Ins(1,4,5)P3, or Ins(1,4,5,6)P4 at the indicated doses (see also fig. S5 for Ca2+ plots in the presence of EGTA). Thapsigargin was added after 30 s and inositols after 600 s of data acquisition. Ca2+ fluctuations were evaluated as changes in Fluo-4 fluorescence in response to the stimuli and normalized over the first 30 s of analysis (rFluo-4 MFI). The quantification analysis shows the increase of fluorescence intensity in the peak interval with respect to the first 30 s for responder cells or the increase of fluorescence intensity after the addition of inositols (600 s) until the end of the experiment (900 s) for nonresponder cells. Statistical significance was determined using one-way analysis of variance, followed by Sidak’s multiple comparisons test, ****P < 0.0001 and *P < 0.05, n = 20 responder cells. Data are representative of three independent experiments. (D) Measure of IP4 increase revealed by confocal microscopy in D1 cells transfected with a fluorescent probe that is quenched by IP4 binding and pretreated (or not) with GNF362. Arrows indicate administration of plain medium or LPS at 50 s. Fluctuations in IP4 amounts were evaluated as changes in the IP4 probe fluorescence in response to the stimuli and normalized over the first 50 s of analysis (relative IP4 probe FI). Traces show a representative profile of a single cell with the corresponding images at the indicated time points. The quantification analysis shows the mean of the intensities of IP4 probe after LPS administration, normalized over the first 50 s of analysis (f/f0). Statistical significance was determined using one-way analysis of variance, followed by Tukey’s multiple comparisons test, ****P < 0.0001 and **P < 0.01, n = 25 cells. Data are representative of three independent experiments.
Fig. 6.
Fig. 6.. ITPKs are essential for LPS-dependent activation of the NFAT signaling pathway in vitro and in vivo.
(A) Representative confocal immunofluorescence images showing NFATc2 in mouse BMDCs treated (or not) with LPS 1.5 hours in the presence or absence of EGTA, the calcineurin inhibitor FK506, or the CRAC inhibitor YM-58483 (CRACi). Nuclei were counterstained blue. Scale bar, 10 μm. Quantification of NFATc2 nuclear signal is shown. Statistical significance was determined using one-way analysis of variance, followed by Tukey’s multiple comparisons test, ****P < 0.0001, n = 105 cells from three independent experiments. (B) Representative confocal immunofluorescence images showing NFATc2 in BMDCs isolated from Itpkb+/+ or Itpkb−/− mice and treated (or not) with LPS for 1.5 hours in the presence or absence of cell-permeant IP4. Nuclei were counterstained blue. Scale bar, 10 μm. Quantification of NFATc2 nuclear signal is shown. Statistical significance was determined using one-way analysis of variance, followed by Tukey’s multiple comparisons test or using unpaired student’s t test. ****P < 0.0001 and **P < 0.01, n = 100 cells from three independent experiments. (C) Confocal immunofluorescence images showing NFATc2 (green) and MHCII (red) in ear sections of mice 1.5 hours after subcutaneous injection of PBS (untreated), LPS, or LPS plus the ITPK inhibitor TNP (ITPKi). Nuclei were counterstained blue. Images are representative of three independent experiments. Insets of each panel represent higher magnifications of the selected areas. Scale bars, 25 μm (lower magnification inset), 10 μm (higher magnification inset). ***P < 0.001. (D) Immunofluorescence showing NFATc2 in human CD1c+CD14+ cells, treated (or not) with LPS for 1.5 hours. Where indicated, cells were preincubated with the ITPK inhibitor TNP (ITPKi). Nuclei are counterstained blue. Scale bars, 2 μm. Quantification of the NFATc2 nuclear signal is shown. Statistical analysis was performed with one-way analysis of variance followed by Bonferroni’s multiple comparisons test, ***P < 0.001, n = 60 cells from three different donors. (E) Real-time PCR analysis of PTGES1 expression in human CD1c+CD14+ cells treated (or not) for 4 hours with LPS in the presence or absence of ITPK inhibitor TNP (ITPKi). n = 7 donors. Statistical significance was performed with Wilcoxon test. **P < 0.01.
Fig. 7.
Fig. 7.. ITPK inhibition in vivo reduces the inflammatory events promoted by NFAT.
(A) Quantification of Evans blue extravasation in the ears of mice. WT (Itpkb+/+) and Itpkb−/− mice were simultaneously injected intravenously with Evans blue and subcutaneously with PBS or the indicated combinations of LPS, PGE2, and the ITPK inhibitor TNP (ITPKi). Mice treated with siRNAs targeting IP3R3 or eGFP or with vehicle alone (w/o siRNA) 24 hours before the assay were also injected with PBS or LPS. Data represent Evans blue quantification from excised ears 30 min after challenge. Values indicate mean ± SD from three mice. Statistical significance was determined with Mann-Whitney test, ***P< 0.001, **P< 0.01, and *P< 0.05. (B) Vascular leakage assay as in (A). Itbk−+/+ or Itbkb−/− DCs were subcutaneously injected (sDC) into the ears of Itbk−+/+ or Itbkb−/− mice before PBS or LPS treatment. The values indicate mean ± SD from three mice for each experimental condition. Statistical significance was determined with one-way analysis of variance, followed by Sidak’s multiple comparisons test, **P < 0.01. (C) Schematic representation of Myts nanoparticles functionalized with thiol-reactive groups and then conjugated with a mixture of VIVIT-SH peptide and PEG-SH, to yield Myts-VIVIT. SPDP, N-succinimidyl-3-[2-pyridylthio]-propionate. MFN1, Myts functionalized with thiol-reactive group. (D) Vascular leakage assay as in (A). Mice were treated with Myts-VIVIT or control Myts-PEG nanoparticles intravenously before LPS treatment. Each symbol represents an individual mouse. (E) CAIA clinical scores evaluated at the indicated time points. Mice were treated with ITPKi every other day starting from day −1 or with Myts-VIVIT or Myts-PEG nanoparticles every other day starting from day −1. Values represent mean ± SD. Statistical significance was performed with one-way analysis of variance, followed by Tukey’s multiple comparisons test. The one-way analysis of variance revealed a variation over time (P < 0.0001), differences between groups (P < 0.0001), and interactions between groups (P < 0.0001). ****P < 0.0001, ***P < 0.001, and *P < 0.05. n = 6 mice for each treatment regimen. (F) Images of intact and hematoxylin and eosin-stained sections of hindlimbs of mice 6 days after CAIA induction that were untreated (NT) or treated with ITPKi. Images are representative of six animals for each treatment group. Scale bars, 2.5 mm (whole sections), 0.5 mm (insets).

Similar articles

Cited by

References

    1. Ostuni R, Zanoni I, Granucci F, Deciphering the complexity of Toll-like receptor signaling. Cell. Mol. Life Sci . 67, 4109–4134 (2010). - PMC - PubMed
    1. Herbst S, Shah A, Mazon Moya M, Marzola V, Jensen B, Reed A, Birrell MA, Saijo S, Mostowy S, Shaunak S, Armstrong-James D, Phagocytosis-dependent activation of a TLR9-BTK-calcineurin-NFAT pathway co-ordinates innate immunity to Aspergillus fumigatus. EMBO Mol. Med . 7, 240–258 (2015). - PMC - PubMed
    1. Zanoni I, Ostuni R, Capuano G, Collini M, Caccia M, Ronchi AE, Rocchetti M, Mingozzi F, Foti M, Chirico G, Costa B, Zaza A, Ricciardi-Castagnoli P, Granucci F, CD14 regulates the dendritic cell life cycle after LPS exposure through NFAT activation. Nature 460, 264–268 (2009). - PubMed
    1. Goodridge HS, Simmons RM, Underhill DM, Dectin-1 stimulation by Candida albicans yeast or zymosan triggers NFAT activation in macrophages and dendritic cells. J. Immunol . 178, 3107–3115 (2007). - PubMed
    1. Robinson MJ, Osorio F, Rosas M, Freitas RP, Schweighoffer E, Gross O, Verbeek JS, Ruland J, Tybulewicz V, Brown GD, Moita LF, Taylor PR, Reis e Sousa C, Dectin-2 is a Syk-coupled pattern recognition receptor crucial for Th17 responses to fungal infection. J. Exp. Med . 206, 2037–2051 (2009). - PMC - PubMed

Publication types

Substances