. 2021 Mar 30;12(1):1979.
doi: 10.1038/s41467-021-22139-7.

Reprogramming of the FOXA1 cistrome in treatment-emergent neuroendocrine prostate cancer

Affiliations

Reprogramming of the FOXA1 cistrome in treatment-emergent neuroendocrine prostate cancer

Sylvan C Baca et al. Nat Commun. .

Abstract

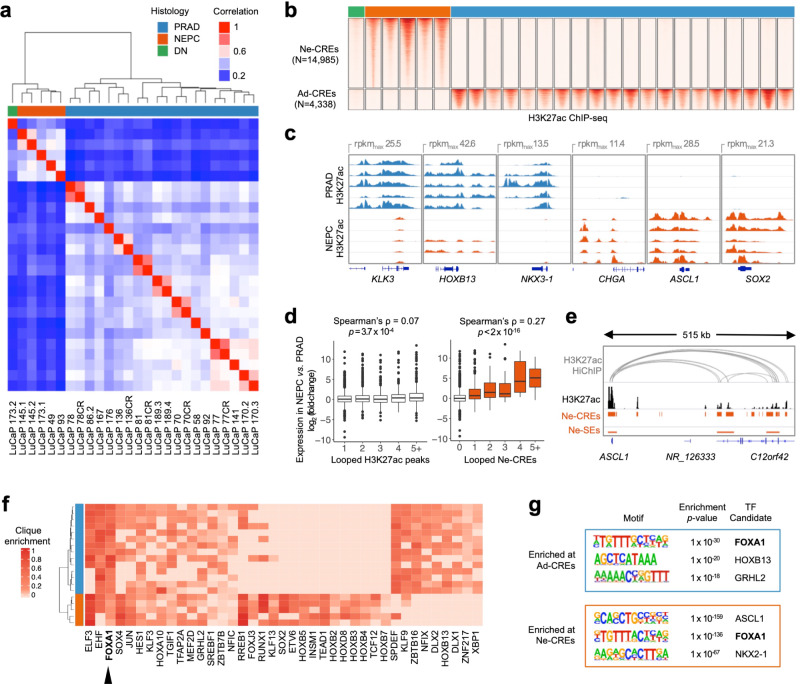
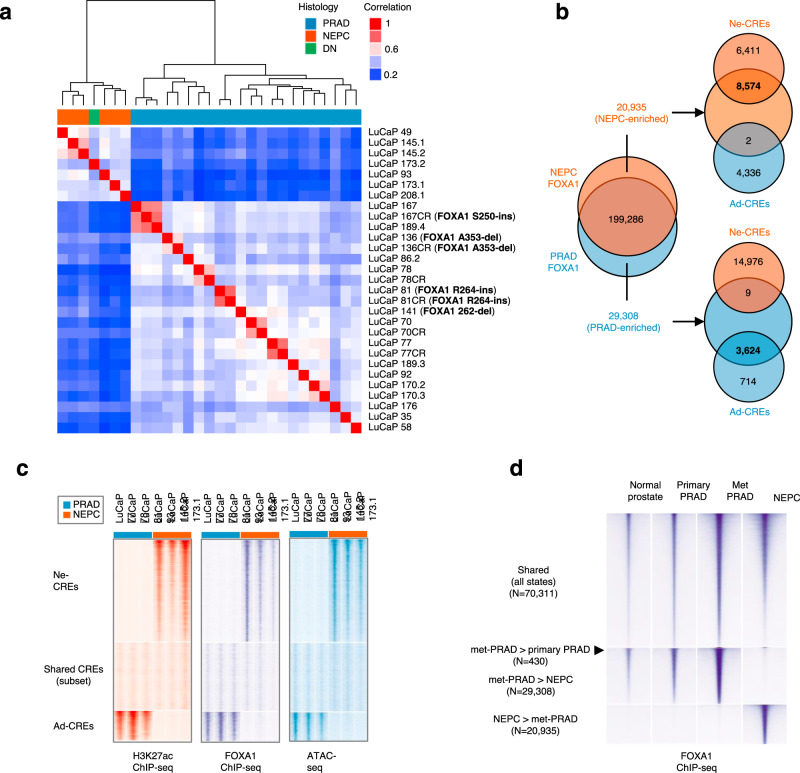
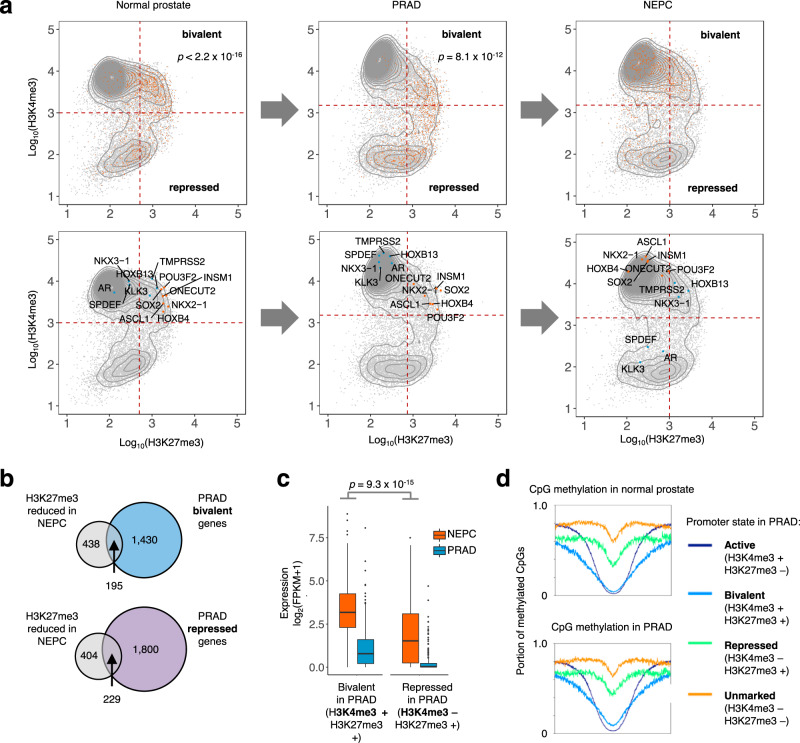
Lineage plasticity, the ability of a cell to alter its identity, is an increasingly common mechanism of adaptive resistance to targeted therapy in cancer. An archetypal example is the development of neuroendocrine prostate cancer (NEPC) after treatment of prostate adenocarcinoma (PRAD) with inhibitors of androgen signaling. NEPC is an aggressive variant of prostate cancer that aberrantly expresses genes characteristic of neuroendocrine (NE) tissues and no longer depends on androgens. Here, we investigate the epigenomic basis of this resistance mechanism by profiling histone modifications in NEPC and PRAD patient-derived xenografts (PDXs) using chromatin immunoprecipitation and sequencing (ChIP-seq). We identify a vast network of cis-regulatory elements (N~15,000) that are recurrently activated in NEPC. The FOXA1 transcription factor (TF), which pioneers androgen receptor (AR) chromatin binding in the prostate epithelium, is reprogrammed to NE-specific regulatory elements in NEPC. Despite loss of dependence upon AR, NEPC maintains FOXA1 expression and requires FOXA1 for proliferation and expression of NE lineage-defining genes. Ectopic expression of the NE lineage TFs ASCL1 and NKX2-1 in PRAD cells reprograms FOXA1 to bind to NE regulatory elements and induces enhancer activity as evidenced by histone modifications at these sites. Our data establish the importance of FOXA1 in NEPC and provide a principled approach to identifying cancer dependencies through epigenomic profiling.


Conflict of interest statement

W.C.H. is a consultant for Thermo Fisher, Solasta Ventures, iTeos, Frontier Medicines, Tyra Biosciences, MPM Capital, KSQ Therapeutics, and Paraxel and is a founder of KSQ Therapeutics. All other authors declare no competing interests.

Figures

Fig. 1
Fig. 1. Epigenomic divergence of PRAD and NEPC.
a Hierarchical clustering of PRAD and NEPC based on sample-to-sample correlation of H3K27ac profiles. “DN” (“double-negative”) indicates a LuCaP PDX without AR or NE marker expression (see also Supplementary Fig. 1). b Heatmaps of normalized H3K27ac tag densities at differentially H3K27-acetylated regions (±2 kb from peak center) between NEPC and PRAD. “CREs” signify candidate regulatory elements. c H3K27ac signal near selected prostate-lineage and NEPC genes. Five representative samples from each histology are shown. d Differential expression (NEPC vs. PRAD) of genes with the indicated number of distinct looped H3K27ac peaks (left) or Ne-CREs (right) detected by H3K27ac HiChIP in LuCaP 173.1 (NEPC). Box boundaries correspond to 1st and 3rd quartiles; whiskers extend to a maximum of 1.5x the inter-quartile range. Two-sided Wilcoxon p-value is indicated for comparison of genes with loops to one Ne-CRE or H3K27ac peak versus two or more. e H3K27ac HiChIP loops in LuCaP 173.1 from ASCL1 to Ne-CREs and NEPC-restricted super-enhancers (Ne-SEs). H3K27ac tag density for LuCaP 173.1 is shown in black. f Candidate master transcription factors in NEPC and PRAD based on regulatory clique enrichment (see methods). g Three most significantly enriched nucleotide motifs present in >10% of Ad-CREs or Ne-CREs by de novo motif analysis. Source data are provided as a Source Data file.
Fig. 2
Fig. 2. FOXA1 remains a critical lineage transcription factor in NEPC.
a Transcript expression of FOXA family TFs in LuCaPs PDXs (five NEPC and five PRAD; two replicates each). b FOXA1/FOXA2 immunohistochemistry in six representative PDXs. c H3K27ac profiles at FOXA1 in five representative PRAD and NEPC PDXs. d H3K27ac HiChIP loops near FOXA1 in LuCaP 173.1 (NEPC) and LNCaP (PRAD). Bars indicate super-enhancers in five representative LuCaPs of each lineage. Blowups show ChIP-seq read pileups for FOXA1 and ASCL1 in PDXs of the indicated lineage. e, f Proliferation of LNCaP and 42D/42F derivatives with inactivation of FOXA1 by CRISPR (e) or shRNA (f) across two independent experiments (n = 6 replicates). Numbers next to western blots indicate molecular weight markers (kD). g, h Proliferation (g) and expression of neuroendocrine marker proteins (h) with siRNA knock-down of FOXA1 in the NEPC organoid model WCM154. Knock-down was repeated in two independent experiments with similar results. i Essentiality of genes in NCI-H660 (NEPC) versus PRAD cell lines in a published shRNA screening dataset. More negative DEMETER2 scores indicate greater dependency. The blue lines indicate the median DEMETER2 score for pan-essential genes. For all boxplots, box boundaries correspond to 1st and 3rd quartiles; whiskers extend to a maximum of 1.5x the inter-quartile range. Source data are provided as a Source Data file.
Fig. 3
Fig. 3. Reprogramming of the FOXA1 cistrome in NEPC.
a Hierarchical clustering of LuCaP PDXs by FOXA1-binding profiles. “DN” (“double-negative”) indicates a PDX without AR or NE marker expression. FOXA1 mutational status is noted; see also Supplementary Table 3). b Venn diagram of lineage-enriched and shared FOXA1-binding sites and their overlap with lineage-enriched candidate regulatory elements (Ad-CREs and Ne-CREs). Differential FOXA1 peaks were identified from n = 5 NEPC and n = 11 PRAD PDXs. c Normalized tag densities for H3K27ac/FOXA1 ChIP-seq and ATAC-seq at Ne-CREs and Ad-CREs. Three representative NEPC and PRAD PDXs are shown. d Average normalized tag densities for FOXA1 in normal prostate, primary PRAD, and PDXs derived from PRAD metastases (Met PRAD) or NEPC (five samples in each category) at differential FOXA1-binding sites between these groups. There are insufficient differential sites to display (<100) for the Primary PRAD > Met PRAD comparison and the Primary PRAD vs. Normal prostate comparisons.
Fig. 4
Fig. 4. FOXA1 is extensively redistributed at lineage-specific regulatory elements.
a Normalized ChIP-seq tag density for FOXA1 at NEPC-enriched and PRAD-enriched FOXA1-binding sites under the indicated conditions. Profile plots (top) represent mean tag density at sites depicted in the heatmaps. b Enrichment of FOXA1 peaks for overlap with NEPC-enriched and PRAD-enriched FOXA1-binding sites in the indicated conditions, normalized to FOXA1 peaks shared between PRAD and NEPC. cf Normalized ChIP-seq tag density for H3K27ac (c) and FOXA1 (e) at Ne-CREs and Ad-CREs under the indicated experimental conditions. Enrichment of overlap of H3K27ac peaks (d) and FOXA1 peaks (f) with Ne-CREs and Ad-CREs under the indicated conditions. gh Normalized ChIP-seq tag density for ASCL1, FOXA1, and H3K27ac under the indicate experimental conditions at NEPC-enriched FOXA1 sites (g) and Ne-CREs (h). i Effect of ASCL1 overexpression on transcript levels of indicated genes, measured by qPCR. Fold-change relative to +GFP condition is shown, using normalization to GAPDH. Three biological replicates are shown for each condition. jk Gene set enrichment analysis of genes upregulated at least 8-fold in LuCaP NEPC (j) or PRAD (k) at adjusted p-value < 10−18. Genes are ranked by differential expression between LNCaP + ASCL1 + NKX2-1 and +GFP conditions based on RNA-seq. Unadjusted permutation-based one-sided p-values for enrichment are shown. Source data are provided as a Source Data file.
Fig. 5
Fig. 5. Gene expression of benign prostate cells compared to NEPC transcriptomes and epigenomes.
a Gene set enrichment analysis of genes specifically expressed in neuroendocrine, basal, and luminal cells from normal prostate. Genes are ranked by differential expression in NEPC and PRAD LuCaP PDXs. b Overlap of NEPC-enriched H3K27ac peaks (Ne-CREs; n = 14,985; top) and FOXA1-binding sites (Ne-FOXA1; n = 20,935; bottom) with a 200 kb windows centered on the transcriptional start sites of the 20 most significantly differentially expressed genes in each indicated prostate cell type. Box boundaries correspond to 1st and 3rd quartiles; whiskers extend to a maximum of 1.5x the inter-quartile range. p-values correspond to two-sided Wilcoxon test of Ne-CRE/Ne-FOXA1 peak overlap near neuroendocrine cell genes versus all other indicated gene categories. c Fraction of CpG methylation detected by whole-genome bisulfite sequencing in normal prostates tissue and PRAD at Ne-CREs and Ad-CREs. Methylation levels at H3K27ac peaks identified in epithelial keratinocytes or in peripheral blood monocytes are included for comparison. x-axis corresponds to peak center ±3 kb.
Fig. 6
Fig. 6. Encoding of neuroendocrine regulatory programs in the developmental history of prostate cancer.
a Average ChIP-seq tag density in normal prostate (n = 3 samples), PRAD (n = 5) and NEPC (n = 5) for H3K4me3 and H3K27me3 within 2 kb of a gene transcriptional start site (TSS). Each dot represents a unique gene TSS. The top row highlights genes with upregulated expression in NEPC compared to PRAD (orange). p-values indicate Pearson’s Chi-squared test comparing enrichment of upregulated genes within the “bivalent” quadrant compared to the bottom two quadrants. Selected genes are highlighted in the bottom row. b Intersection of genes with bivalent (H3K27me3+/H3K4me3+) or repressed (H3K27me3+/H3K4me3) promoter annotations in PRAD and genes with reduced promoter H3K27me3 in NEPC vs. PRAD (log2 fold-change <−1, FDR-adjusted p-value = 0.01). c Transcript expression levels in NEPC of genes whose promoters lose H3K27me3 in NEPC compared to PRAD. Genes are grouped by bivalent (n = 1625) or repressed (n = 2029) promoter annotations in PRAD. Box boundaries correspond to 1st and 3rd quartiles; whiskers extend to a maximum of 1.5x the inter-quartile range. p-value corresponds to two-sided Wilcoxon rank-sum test. d Fraction of CpG methylation in normal prostate tissue and PRAD at TSS ±3 kb for genes in each indicated category. Source data are provided as a Source Data file.

References

    1. Scher H, et al. Increased survival with enzalutamide in prostate cancer after chemotherapy. N. Engl. J. Med. 2012;367:1187–1197. doi: 10.1056/NEJMoa1207506. - DOI - PubMed
    1. de Bono JS, et al. Abiraterone and increased survival in metastatic prostate cancer. N. Engl. J. Med. 2011;364:1995–2005. doi: 10.1056/NEJMoa1014618. - DOI - PMC - PubMed
    1. Aggarwal R, et al. Clinical and genomic characterization of treatment-emergent small-cell neuroendocrine prostate cancer: a multi-institutional prospective study. J. Clin. Oncol. 2018;36:22492–22503. - PMC - PubMed
    1. Bluemn E, et al. Androgen Receptor pathway-independent prostate cancer is sustained through FGF signaling. Cancer Cell. 2017;32:474–489.e6. doi: 10.1016/j.ccell.2017.09.003. - DOI - PMC - PubMed
    1. Beltran H, et al. Divergent clonal evolution of castration resistant neuroendocrine prostate cancer. Nat. Med. 2016;22:298–305. doi: 10.1038/nm.4045. - DOI - PMC - PubMed

Publication types

MeSH terms

Substances