. 2021 Mar 30;12(1):1970.
doi: 10.1038/s41467-021-22097-0.

Fasting alters the gut microbiome reducing blood pressure and body weight in metabolic syndrome patients

Affiliations

Fasting alters the gut microbiome reducing blood pressure and body weight in metabolic syndrome patients

András Maifeld et al. Nat Commun. .

Abstract

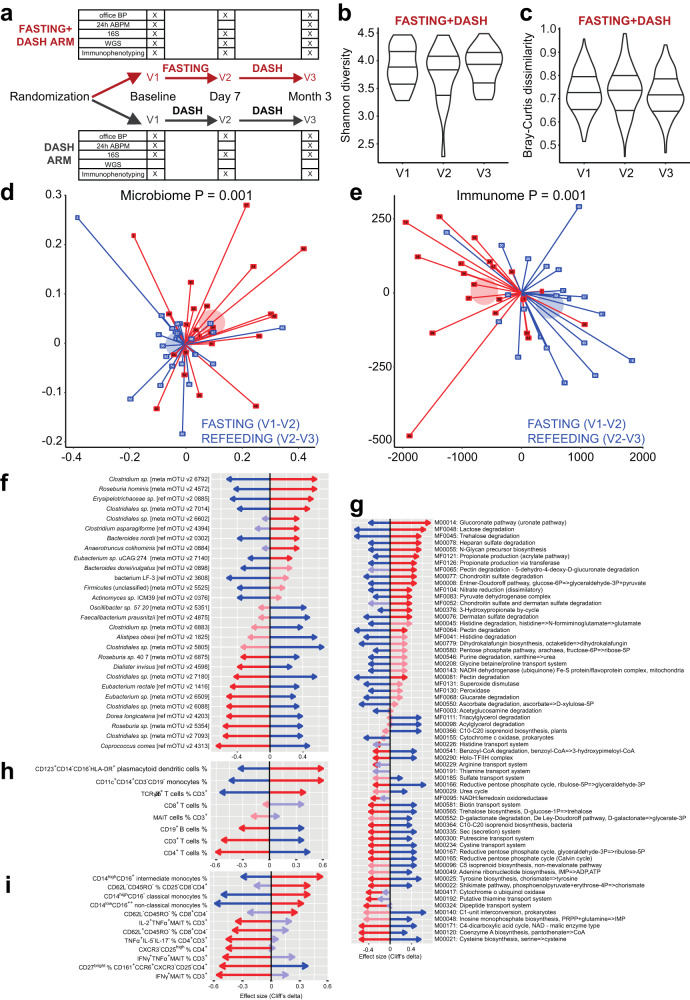
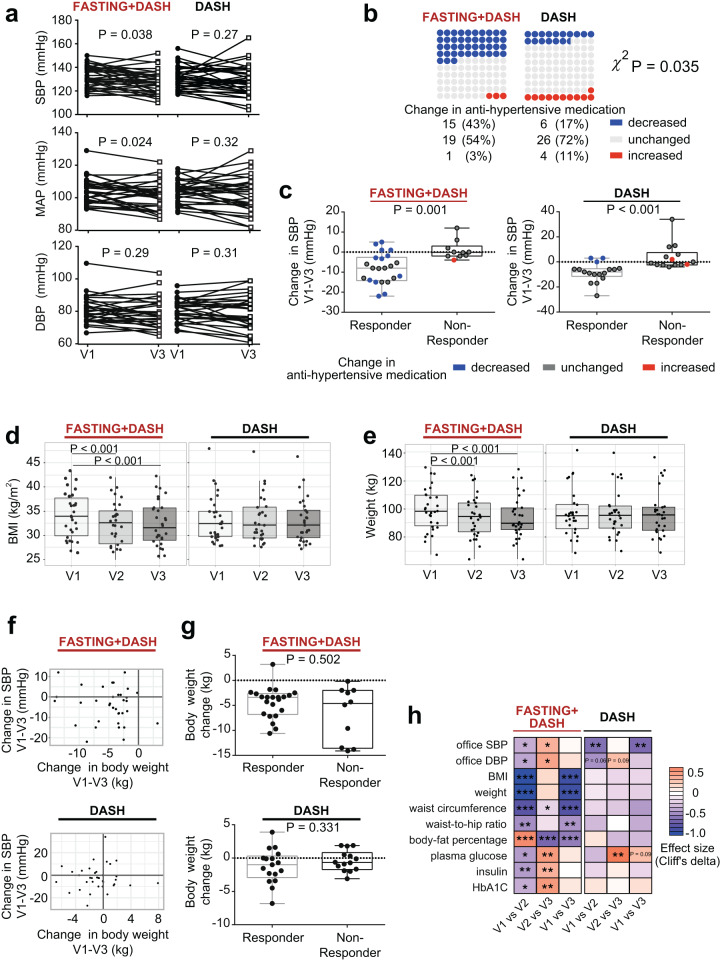
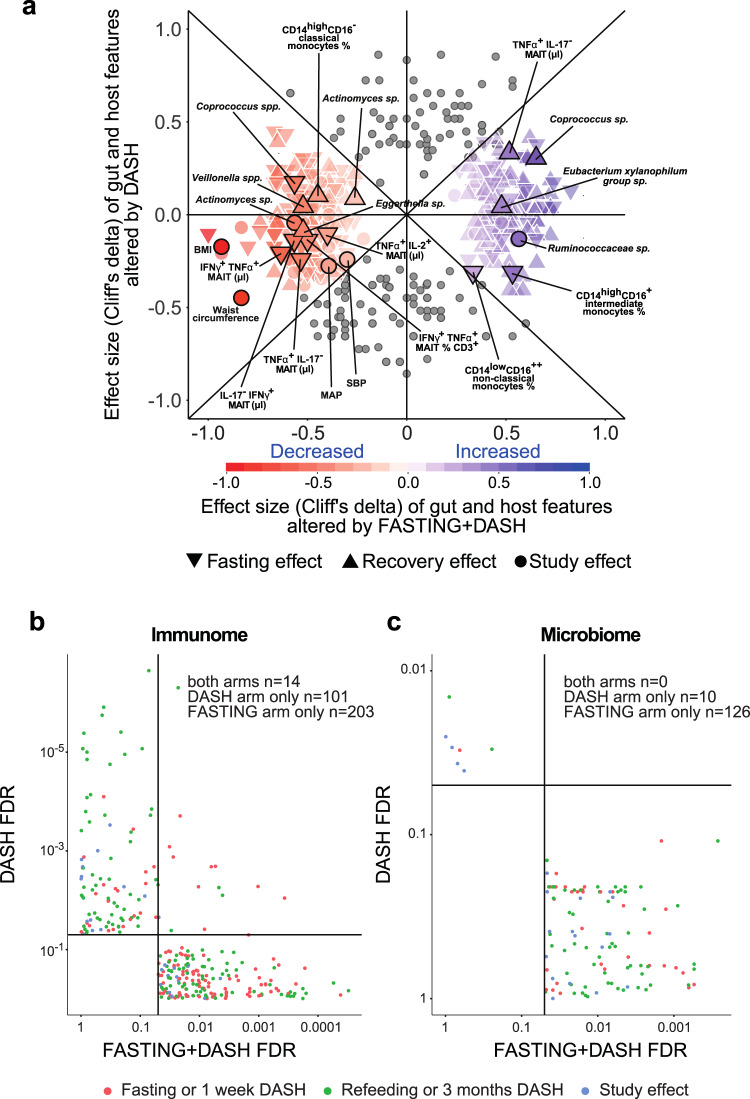
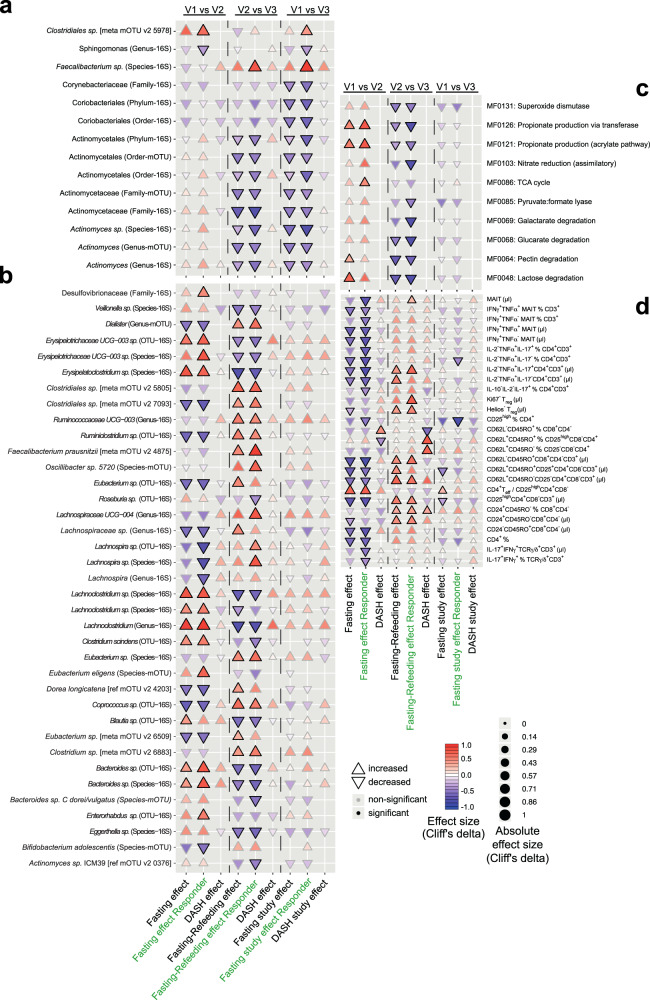
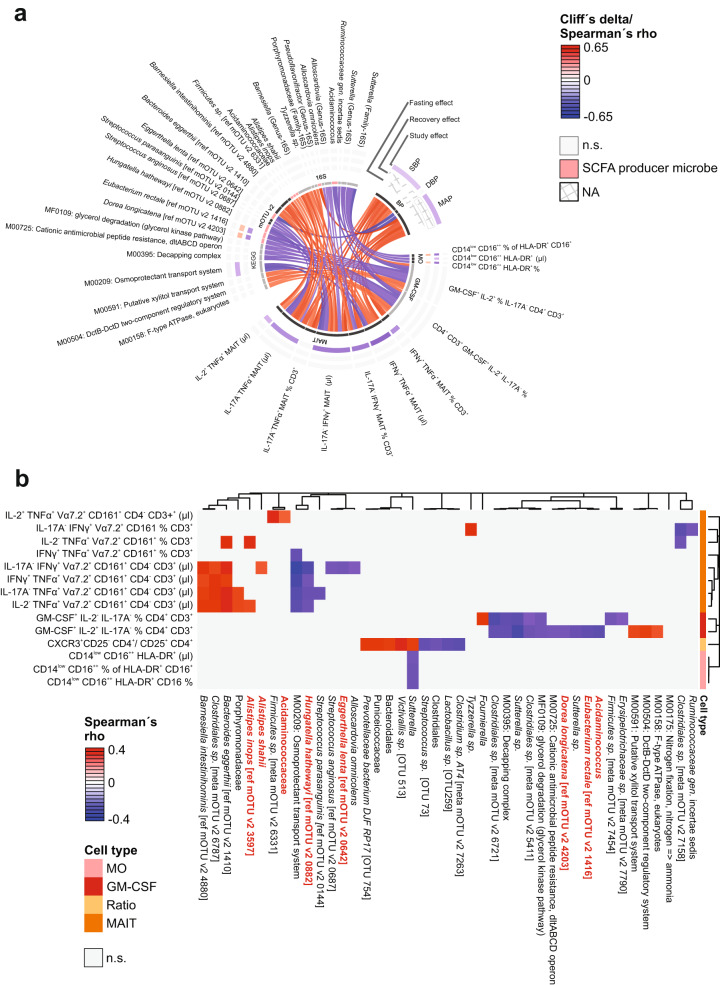
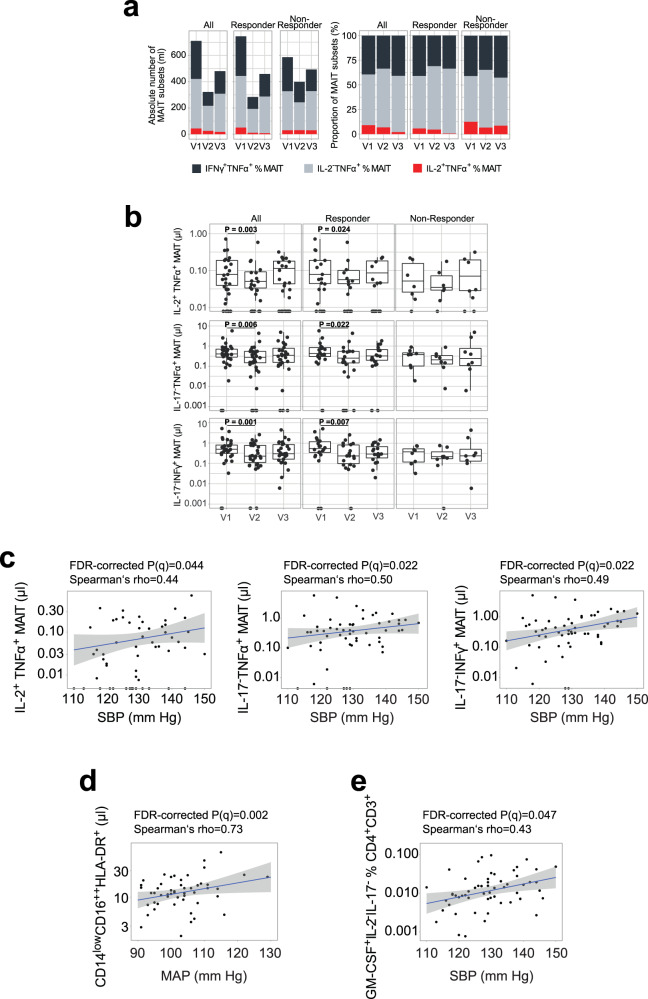
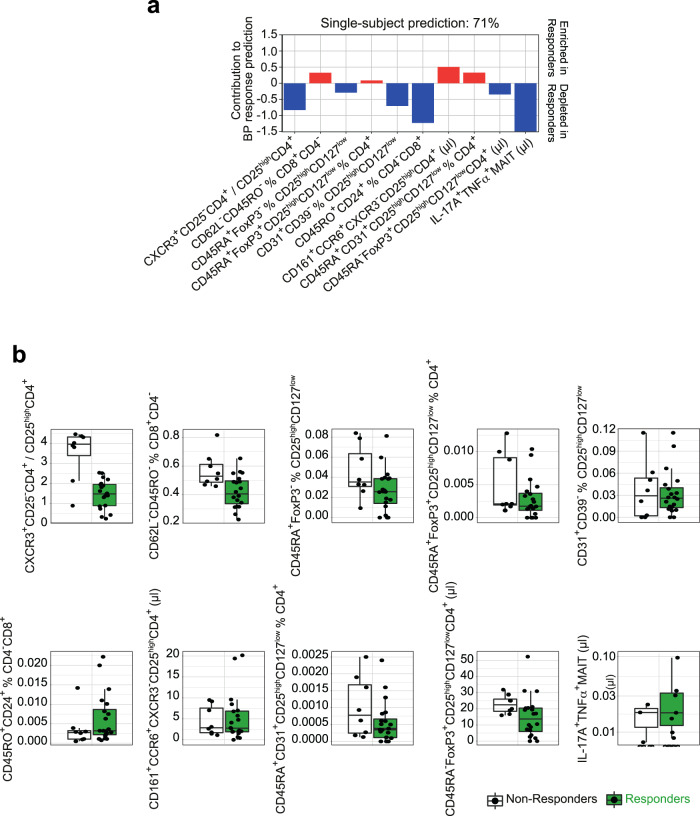
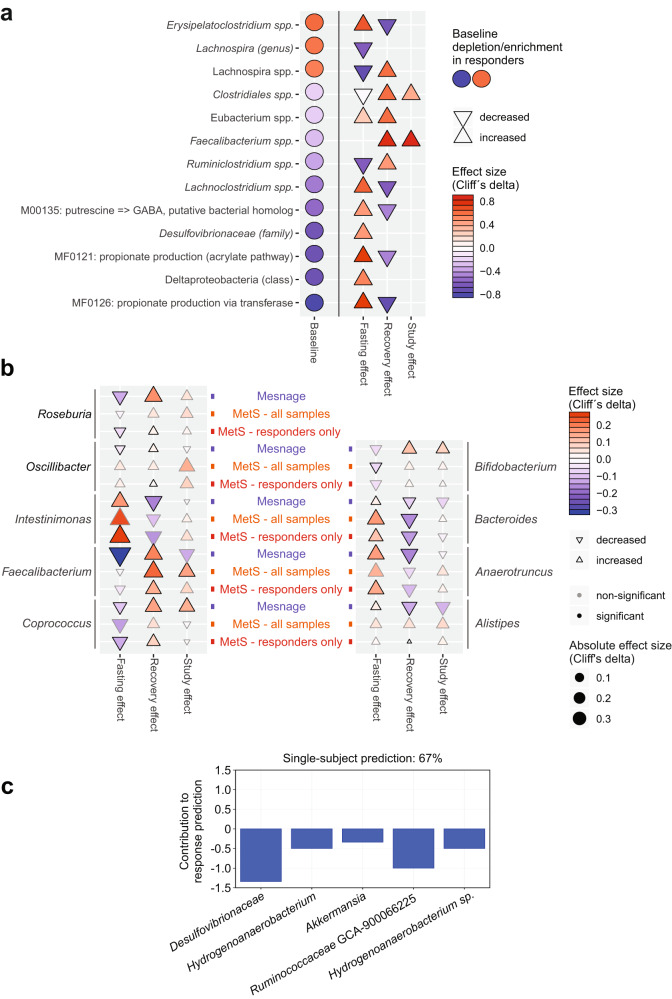
Periods of fasting and refeeding may reduce cardiometabolic risk elevated by Western diet. Here we show in the substudy of NCT02099968, investigating the clinical parameters, the immunome and gut microbiome exploratory endpoints, that in hypertensive metabolic syndrome patients, a 5-day fast followed by a modified Dietary Approach to Stop Hypertension diet reduces systolic blood pressure, need for antihypertensive medications, body-mass index at three months post intervention compared to a modified Dietary Approach to Stop Hypertension diet alone. Fasting alters the gut microbiome, impacting bacterial taxa and gene modules associated with short-chain fatty acid production. Cross-system analyses reveal a positive correlation of circulating mucosa-associated invariant T cells, non-classical monocytes and CD4+ effector T cells with systolic blood pressure. Furthermore, regulatory T cells positively correlate with body-mass index and weight. Machine learning analysis of baseline immunome or microbiome data predicts sustained systolic blood pressure response within the fasting group, identifying CD8+ effector T cells, Th17 cells and regulatory T cells or Desulfovibrionaceae, Hydrogenoanaerobacterium, Akkermansia, and Ruminococcaceae as important contributors to the model. Here we report that the high-resolution multi-omics data highlight fasting as a promising non-pharmacological intervention for the treatment of high blood pressure in metabolic syndrome patients.


Conflict of interest statement

The authors declare no competing interests.

Figures

Fig. 1
Fig. 1. Fasting has a pervasive host and microbiome impact.
a Study design is shown. Subjects are followed from baseline (V1), randomly assigned to begin a modified DASH diet only or to undergo a 5-day fast followed by a modified DASH diet. Follow-up is done at one week (V2) and 3 months (V3). b Fasting has no significant (two-sided MWU P > 0.05) impact on gut microbiome alpha diversity (Shannon diversity from mOTUv2 OTUs) across observation times V1–V3. c Fasting has no significant (two-sided MWU P > 0.05) impact on gut microbiome beta diversity (Bray–Curtis dissimilarity from mOTUv2 OTUs, shown are all between donor comparisons per time point) across observation times V1–V3. d Fasting significantly shifts the gut microbiome towards a characteristic compositional state, while refeeding reverses this change. Unconstrained Principal Coordinates graph with first two dimensions shown. Axes show Bray–Curtis dissimilarities of rarefied mOTUv2 OTUs between samples; each participant in the fasting arm is shown as two lines, one red (fasting change), one blue (refeeding change) connected (centered) at the origin for ease of visualization. Axes show fasting and refeeding deltas after one-week intervention and 3-month refeeding. Pseudonym participant ID numbers are shown on the point markers. Transparent circle markers show arithmetic mean position of fasting and recovery deltas, respectively. PERMANOVA test P-values reveal significant dissimilarity (P < 0.05) between samples from each visit V1–V3 in the original distance space, stratifying by donor. e Fasting significantly shifts the host immune cell population towards a characteristic state, while refeeding reverses it. Same as in (d), using Euclidean distances. f Gut microbial taxa significantly enriched/depleted upon fasting/refeeding. Taxa (mOTUv2 OTUs) are shown on the vertical axis, and effect sizes (Cliff’s delta) shown on the horizontal axis. Red arrows represent fasting effects (V2–V1 comparison), blue arrows refeeding effects (V3–V2 comparison). Bold arrows are significant (nested model comparison of a linear model for rarefied abundance of each taxon, comparing a model incorporating patient ID, age, sex and all dosages of relevant medications) to a model additionally incorporating time point, requiring likelihood test Benjamini-Hochberg corrected FDR < 0.1 and additionally pairwise post-hoc two-sided MWU test P < 0.05. g Gut microbial gene functional modules (KEGG and GMM models analyzed together) significantly enriched/depleted upon fasting/refeeding. h General immune cell populations significantly enriched/depleted upon fasting/refeeding. i Specific immune cell subpopulations. gi Same test as in (f), subset of altered features shown for clarity. Effect sizes and FDR-corrected P values can be found in Supplementary Data 1,2.
Fig. 2
Fig. 2. Fasting effects are distinct from those of a modified DASH diet only, and connected to vascular health benefits.
a Fasting followed by a modified DASH diet, but not a DASH diet alone, significantly improves 24 h ambulatory SBP and MAP 3 months post-intervention (two-sided MWU, FDR-corrected P-values are shown). Lines show individual participant trajectories. b MetS subjects beginning a modified DASH diet post-fasting significantly reduce their intake of antihypertensive medication by 3 months post-intervention, compared to subjects beginning a DASH diet only. Two-sided χ2 test, P = 0.035. c Changes in 24 h ambulatory SBP in responders and non-responders including change in antihypertensive medication (two-sided MWU). d, e One week of fasting followed by modified DASH diet, but not DASH diet alone, caused significant (two-sided MWU, FDR-corrected P values are shown) BMI and body weight reduction in MetS patients, persisting 3 months later. f Comparison of changes in 24 h ambulatory SBP and body weight, respectively between baseline and follow-up in both study arms. Each dot represents an individual. g Body weight change is not significantly different between responders and non-responders in the fasting arm between baseline and follow-up (two-sided MWU). h Selected cardiometabolic risk parameters (vertical axis) altered in the fasting arm compared to the DASH arm. Heatmap hues show Cliff’s delta signed effect sizes, with asterisk indicating post-hoc univariate significance after compensating for drug dosage changes (see Methods). Horizontal axis shows each time point comparison: change during fasting/week three of DASH, change during refeeding/3 months of DASH, and change during the study period as a whole. Boxplot hinges denote 25th–75th percentile. Line within the boxplot indicates median. Whiskers on (c, g) are drawn from minimum to maximum values. Whiskers on (d, e) are drawn to minimum and maximum values, but not further than 1.5 × IQR.
Fig. 3
Fig. 3. Fasting and recovery effects are not replicated in an equally powered control cohort, indicating they are intervention-specific.
a A majority of host and microbiome effects reported from the fasting+DASH arm are not replicated in DASH-only patients. Comparative effect size plot contrasting features altered significantly only under fasting+DASH (colored markers, n = 315) with features altered significantly also under DASH alone, or with absolute effect size greater in DASH alone (gray markers, n = 146). For the former category, color hue shows direction of effect, color intensity scope of effect, and marker shape which time point comparison is shown. Vertical axis shows effect size in DASH only, horizontal effect size in fasting+DASH. Selected features are named for reference. b, c Volcano plots show post-hoc FDR for all features significantly altered in either arm between any two time points in the fasting arm (horizontal axis), compared to the same sample number DASH arm (vertical axis). Point color shows which time point comparison is plotted. Quadrants (formed by the FDR < 0.05 thresholds) and summary counts highlight features significantly altered in each dataset for immune cell (b) and functional or taxonomic microbiome features (c). Only the fasting arm had a significant effect on the microbiome, and while a smaller fraction of immune features were altered in the DASH-only arm, these were largely not significant in the fasting arm.
Fig. 4
Fig. 4. Subjects responding favorably to fasting exhibit stronger changes in commensal abundance under intervention.
a Cuneiform plot shows subset of bacterial taxa, at different taxonomic levels, and measured either using 16S sequencing or shotgun sequencing, altered significantly (drug-adjusted post-hoc FDR < 0.05) in abundance tested in intervention responders only (vertical axis) and showing a study effect, comparing to baseline and follow-up (V3). Signed effect size are shown through marker direction and color, hue and size represent absolute effect size. Solid borders indicate significance. Markers not shown could not be tested in the DASH arm as shotgun data was unavailable, or showed no difference in rank-transformed values (Cliff’s delta=0). Horizontal axis separates tests for fasting (comparison of baseline to after one week), recovery (comparison of after one week to 3 months), and study effect (comparison of baseline to 3-month follow-up). DASH results are from the DASH arm only, responders are tests using only the responders (as per decision tree) in the fasting arm. b Same view as (a), showing 16S or shotgun sequencing microbial taxa significantly altered either at fasting (V1 vs. V2) or refeeding (V2 vs. V3) in responders excluding features already in (a) to avoid redundancy. c same view as (a), with regards to gut functional modules (selected subset shown for clarity). d Same view as (a) but with regards to immune cell subpopulations (selected subset shown for clarity). Treg: FoxP3+ cells, MAIT: Vα7.2+CD161+CD4CD3+.
Fig. 5
Fig. 5. Blood pressure-microbe-immune association.
a Chord diagram visualizes the interrelation between BP (24 h ambulatory systolic, mean or diastolic BP) and fasting-impacted microbiome functional or taxonomic features, and immune cell subsets. Features are shown that form triplets of immune, microbial and phenotype variables where at least two of three correlations are significant (Spearman FDR < 0.05, post-hoc nested model test accounting for same-donor samples < 0.05) in the fasting arm of our cohort, and where in addition one or more features is significantly (drug-adjusted post-hoc FDR < 0.05) affected by the intervention. Color of the connectors indicates positive or negative association (Spearman’s rho), color of the cells within the tracks indicates changes upon fasting, refeeding and study effect (Cliff’s delta, white if not significant), respectively. b Hierarchical clustering of microbiome features-associated immune features. Color indicates Spearman’s rho.
Fig. 6
Fig. 6. The association between blood pressure and specific circulating immune cell populations.
a Cumulative absolute number and relative abundance of circulating IFNγ+TNFα+, IL-2TNFα+ and IL-2+TNFα+ mucosa-associated invariant T cells (MAIT) cells within the fasting arm subdivided by BP responsiveness (median, n = 30 for all, n = 20 for responders, n = 8 for non-responders, respectively). Absolute number of circulating IL-2+TNFα+ (All: P = 0.019, Responder: P = 0.024), TNFα+ (All: P = 0.006; Responder: P = 0.022) and IFNγ+ (All: P = 0.001; Responder: P = 0.007); (a) two-sided MWU test after Benjamini–Hochberg correction. b MAIT cells within the fasting arm subdivided by BP responsiveness (n-number as in (a); two-sided MWU test after Benjamini–Hochberg correction). c Correlations of circulating IL-2+TNFα+, TNFα+, and IFNγ+ MAIT cells and 24 h ambulatory SBP (*FDR-corrected P = 0.044, 0.022, and 0.022, respectively). d Correlations of circulating non-classical CD14lowCD16++HLA-DR+ monocytes and 24 h ambulatory MAP in responder (FDR-corrected P = 0.002). e Correlations of circulating GM-CSF+IL-2IL-17 of % CD3+ and 24 h ambulatory SBP (FDR-corrected P = 0.047). n-number for (cg) as in (b). MAIT: Vα7.2+CD161+CD4CD3+. Boxplot hinges denote 25th–75th percentile. Line within the boxplot indicates median. Whiskers are drawn to minimum and maximum values, but not further than 1.5 × IQR. ce Gray shading represents 95% CI.
Fig. 7
Fig. 7. Long-lasting BP responders and non-responders differ in immunome composition.
a Prediction model weights for BP response using the immunome dataset at baseline. The top ten immunome features were used to build a multivariate logistic-regression algorithm. Single-subject prediction was quantified using a leave-one-out cross-validation procedure. The bar plots represent the regression in a model with binary output (responder yes = 1 vs. no = 0) for every feature. b Quantification of the immunome features at baseline used in the prediction model to predict BP response in the future, split into responders and non-responders. MAIT: Vα7.2+CD161+CD4CD3+. Boxplot hinges denote 25th–75th percentile. Line within the boxplot indicates median. Whiskers are drawn to minimum and maximum values, but not further than 1.5 × IQR.
Fig. 8
Fig. 8. Baseline microbiome predicts long-lasting BP responsiveness.
a Circles denote features differing at baseline in responders vs. non-responders and altered during intervention in responders. Effect size (Cliff’s delta) is shown comparing responders and non-responders. b Comparison of results from the present study (MetS; all samples and BP responders only shown as orange and red tags, respectively, separately) with those of a recent similar fasting intervention in healthy men (Mesnage; blue tags). Effect sizes at the species or OTU level were averaged at the genus level for clarity, and are shown in the plot (direction rendered as marker shape and hue; scope rendered as marker size and intensity) for all genera where at least one constituent taxon achieved significance either in the Mesnage or MetS study (these are shown in boldface). Columns denote phases of each intervention - fasting phase, refeeding, and follow-up vs. baseline. Substantial agreement between the two studies is seen, which is typically stronger for the subset of BP responders. c Prediction model weights for BP response using the MetS 16S dataset at baseline. The top five immunome features were used to build a multivariate logistic-regression algorithm. Single-subject prediction on the Mesnage dataset was quantified using a leave-one-out cross-validation procedure. The bar plots represent the regression in a model with binary output (responder yes = 1 vs. no = 0) for every feature.

References

    1. Di Francesco A, Di Germanio C, Bernier M, de Cabo R. A time to fast. Science. 2018;362:770–775. doi: 10.1126/science.aau2095. - DOI - PMC - PubMed
    1. Collaborators GBDD. Health effects of dietary risks in 195 countries, 1990-2017: a systematic analysis for the Global Burden of Disease Study 2017. Lancet393, 1958–1972 (2019). - PMC - PubMed
    1. Whelton PK, et al. 2017 ACC/AHA/AAPA/ABC/ACPM/AGS/APhA/ASH/ASPC/NMA/PCNA guideline for the prevention, detection, evaluation, and management of high blood pressure in adults: a report of the American College of Cardiology/American Heart Association Task Force on Clinical Practice Guidelines. Circulation. 2018;138:e484–e594. - PubMed
    1. Christ, A. & Latz, E. The Western lifestyle has lasting effects on metaflammation. Nat. Rev. Immunol.19, 267–268 (2019). - PubMed
    1. Lynch SV, Pedersen O. The human intestinal microbiome in health and disease. N. Engl. J. Med. 2016;375:2369–2379. doi: 10.1056/NEJMra1600266. - DOI - PubMed

MeSH terms

Associated data