. 2021 Mar 30;12(1):1957.
doi: 10.1038/s41467-021-22251-8.

Beam image-shift accelerated data acquisition for near-atomic resolution single-particle cryo-electron tomography

Affiliations

Beam image-shift accelerated data acquisition for near-atomic resolution single-particle cryo-electron tomography

Jonathan Bouvette et al. Nat Commun. .

Abstract

Tomographic reconstruction of cryopreserved specimens imaged in an electron microscope followed by extraction and averaging of sub-volumes has been successfully used to derive atomic models of macromolecules in their biological environment. Eliminating biochemical isolation steps required by other techniques, this method opens up the cell to in-situ structural studies. However, the need to compensate for errors in targeting introduced during mechanical navigation of the specimen significantly slows down tomographic data collection thus limiting its practical value. Here, we introduce protocols for tilt-series acquisition and processing that accelerate data collection speed by up to an order of magnitude and improve map resolution compared to existing approaches. We achieve this by using beam-image shift to multiply the number of areas imaged at each stage position, by integrating geometrical constraints during imaging to achieve high precision targeting, and by performing per-tilt astigmatic CTF estimation and data-driven exposure weighting to improve final map resolution. We validated our beam image-shift electron cryo-tomography (BISECT) approach by determining the structure of a low molecular weight target (~300 kDa) at 3.6 Å resolution where density for individual side chains is clearly resolved.


Conflict of interest statement

The authors declare no competing interests.

Figures

Fig. 1
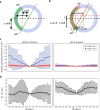
Fig. 1. Parallel acquisition of tilt-series using beam-image shift electron cryo-tomography (BISECT).
a Schematic of the movement of ROIs (white circles) from the initial position (gray) and after stage tilting (blue). b Evolution of the targeting and defocus over a 5 × 5-hole area. The initial field of view of each area is shown as red squares. The high-magnification tracking area is shown as an orange square. Lines show the movement of the targeting obtained from cross-correlation alignment (scaled by 5 for visualization) and are color coded according to the estimated defocus for each image (large movements are attributed to errors in the cross-correlation at high-tilt and are not reflective of the actual motion of the sample). To allow for errors and discrepancies in the targeting of each hole, every BIS area is treated individually and gets its own Z-height fit. This approach makes our routines more robust to irregular specimens that strongly deviate from an ideal plane such as the bending observed in samples with thicker ice.
Fig. 2
Fig. 2. Effects of eucentric plane correction during tilt-series acquisition.
a, b Comparison of the target displacement during tilting assuming that the sample is flat compared to the center of rotation (a, green arc) or when considering an off-plane shift (b, red arc and red lines). Note that the trajectory of an off-plane target is different than for an eucentric target. c Measurement of the median displacement in the x-coordinate (blue) and y-coordinate (red) without correcting for off-plane shift (left panel) and with correction (right-panel) over multiple tilt-series (n=150). Error bars represent the inter quartile range (IQR). d Measurement of the median defocus variation from the first image without correcting for off-plane shift (left panel) or with correction (right-panel) over multiple tilt-series (n = 150). Error bars represent the IQR. In general, errors in defocus originate mainly from errors in targeting and are not systematic.
Fig. 3
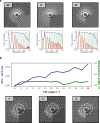
Fig. 3. Astigmatic tilted-CTF determination from low-dose tomographic tilt-series.
a 2D power spectra from projections at −51°, 0°, and 51° from a tilt-series downloaded from EMPIAR-10453 (top) and corresponding fitted 1D models (bottom) showing radially averaged CTF profile (red), estimated defocus (green dashed line), and CTFfit scores (blue). b Astigmatic CTF estimation in the positive branch of a tilt-series from the dNTPase sample. Plots show variations in the astigmatism angle (green) and defocus differences (blue) across the tilt range (top). Corresponding 2D power spectra obtained from tilt angles 0, 21 and 36° showing changes in astigmatism (bottom). To facilitate the visualization, we choose to show a tilt-series with unusually high astigmatism variation. In general, no systematic variations in astigmatism were observed for data collected using BISECT or downloaded from the EMPIAR database.
Fig. 4
Fig. 4. Self-tuning exposure weighting based on assigned particle scores.
a Average similarity scores calculated over individual particle projections and plotted as a function of the tilt-angle revealing the expected characteristic of the dose-symmetric scheme showing higher quality data obtained at the lower tilts. b 2D plot showing the cumulative contribution of individual tilts to the 3D reconstruction as a function of spatial frequency. Each colored band represents one tilt. The high frequency information is contributed mostly by lower tilts which are also exposed first.
Fig. 5
Fig. 5. Near-atomic resolution structure of 300 kDa complex using BISECT/CSPT.
a Representative 50 nm-thick slice through tomographic reconstruction showing individual dNTPase particles (a total of 64 tomograms were used). Scale bar 100 nm. b Overview of dNTPase map obtained from ~30k particles extracted from 64 low-dose tomographic tilt-series. c Fourier Shell Correlation plots between half-maps showing an estimated resolution of 3.6 Å according to the 0.143-cutoff criteria. Curves corrected for masking effects (green dashed line), unmasked (magenta), masked (blue), and phase randomized (red) are shown. d Regions of the density map and fitted atomic coordinates showing the visualization of side chains. 3D refinement and reconstruction were repeated independently three times yielding structures with similar resolution.
Fig. 6
Fig. 6. Comparison of SPA and CET structures of dNTPase.
a Representative 2D micrograph selected out of a total of 64 images (left, scale bar 100 nm), SPA map colored according to local resolution (middle) and corresponding density for an alpha helix (right). b Representative slice through tomographic reconstruction selected out of a total of 64 tomograms (left, scale bar 100 nm), ±36° BISECT/CSPT map colored according to local resolution (middle), and corresponding density for an alpha helix (right). 3D refinement and reconstruction were repeated independently three times yielding structures with similar resolution.

References

    1. Bartesaghi, A. et al. Classification and 3D averaging with missing wedge correction in biological electron tomography. J. Struct. Biol.162, 436–450 (2008). - PMC - PubMed
    1. Winkler, H. et al. Tomographic subvolume alignment and subvolume classification applied to myosin V and SIV envelope spikes. J. Struct. Biol.165, 64–77 (2009). - PMC - PubMed
    1. Förster, F., Pruggnaller, S., Seybert, A. & Frangakis, A. S. Classification of cryo-electron sub-tomograms using constrained correlation. J. Struct. Biol.161, 276–286 (2008). - PubMed
    1. Castaño-Díez, D., Kudryashev, M., Arheit, M. & Stahlberg, H. Dynamo: a flexible, user-friendly development tool for subtomogram averaging of cryo-EM data in high-performance computing environments. J. Struct. Biol.178, 139–151 (2012). - PubMed
    1. Bharat, T. A. M. & Scheres, S. H. W. Resolving macromolecular structures from electron cryo-tomography data using subtomogram averaging in RELION. Nat. Protoc.11, 2054–2065 (2016). - PMC - PubMed

Publication types

MeSH terms

Substances