

Sudden cardiac death risk in hypertrophic cardiomyopathy: comparison between echocardiography and magnetic resonance imaging
- PMID: 33785804
- PMCID: PMC8009882
- DOI: 10.1038/s41598-021-86532-4
Sudden cardiac death risk in hypertrophic cardiomyopathy: comparison between echocardiography and magnetic resonance imaging
Abstract
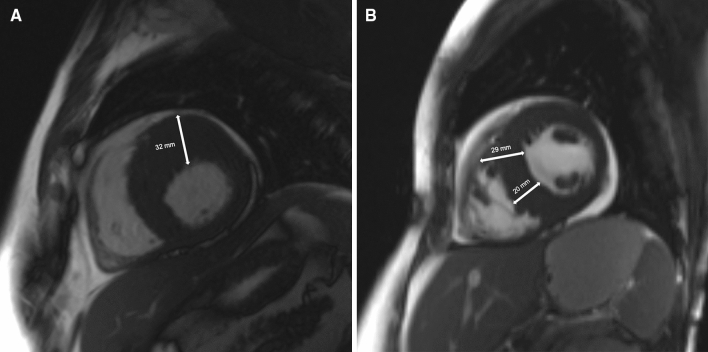
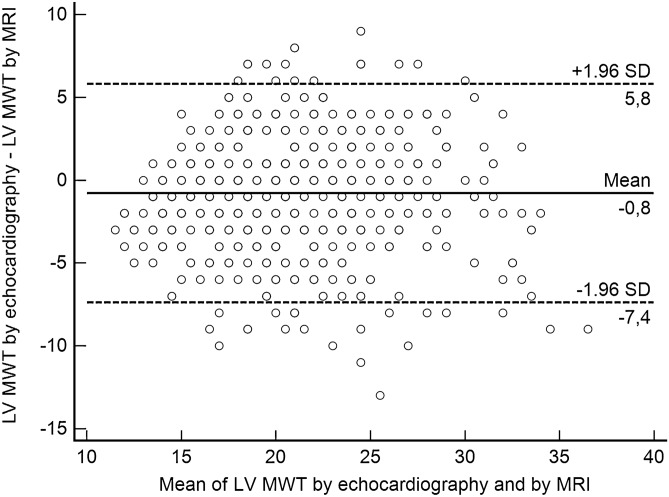
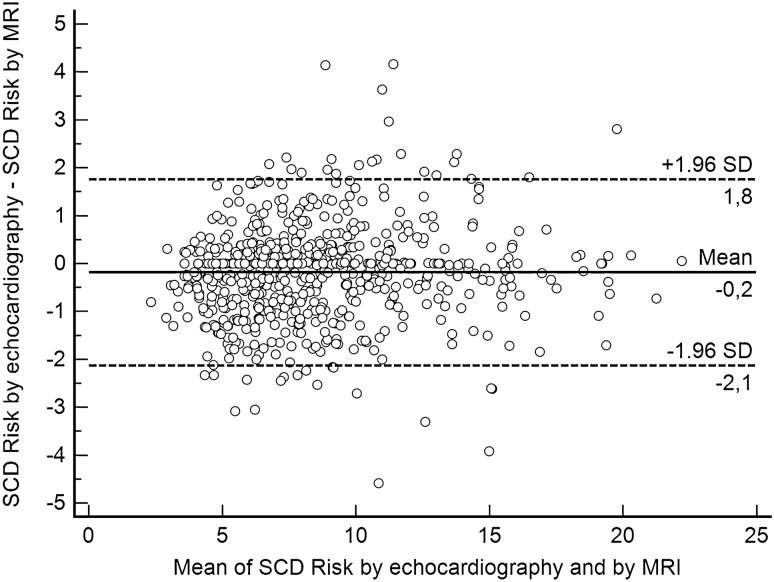
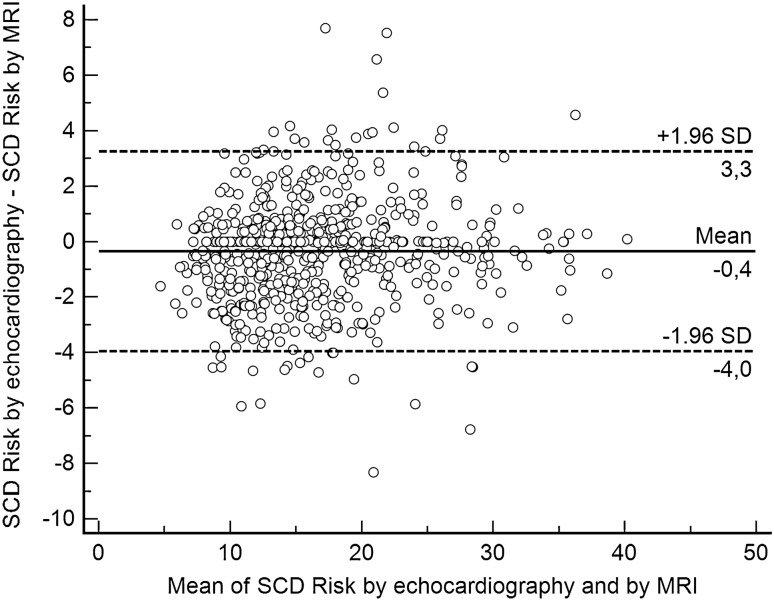
In hypertrophic cardiomyopathy (HCM) patients, left ventricular (LV) maximal wall thickness (MWT) is one of the most important factors determining sudden cardiac death (SCD) risk. In a large unselected sample of HCM patients, we aimed to simulate what changes would occur in the calculated SCD risk according to the European HCM Risk-SCD calculator when MWT measured using echocardiography was changed to MWT measured using MRI. All consecutive patients with HCM who underwent cardiac MRI were included. MWT measured with echocardiography and MRI were compared, and 5-year SCD risk according to the HCM Risk-SCD calculator was computed using four different models. The final population included 673 patients [389 (57.8%) males, median age 50 years, interquartile range (36-60)]. The median MWT was lower measured by echocardiography than by MRI [20 (17-24) mm vs 21 (18-24) mm; p < 0.0001]. There was agreement between echocardiography and MRI in the measurement of maximal LV wall thickness in 96 patients (14.3%). The largest differences between echo and MRI were - 13 mm and + 9 mm. The differences in MWT by echocardiography and MRI translated to a maximal difference of 8.33% in the absolute 5-year risk of SCD, i.e., the echocardiography-based risk was 8.33% lower than the MRI-based estimates. Interestingly, 13.7% of patients would have been reclassified into different SCD risk categories if MRI had been used to measure MWT instead of echocardiography. In conclusion, although there was high general intermodality agreement between echocardiography and MRI in the MWT measurements, the differences in MWT translated to significant differences in the 5-year risk of SCD.
Conflict of interest statement
The authors declare no competing interests.
Figures


References
-
- Elliott PM, et al. 2014 ESC Guidelines on diagnosis and management of hypertrophic cardiomyopathy: the Task Force for the Diagnosis and Management of Hypertrophic Cardiomyopathy of the European Society of Cardiology (ESC) Eur. Heart J. 2014;35:2733–2779. doi: 10.1093/eurheartj/ehu284. - DOI - PubMed
-
- Gersh, B. J. et al. 2011 ACCF/AHA guideline for the diagnosis and treatment of hypertrophic cardiomyopathy: a report of the American College of Cardiology Foundation/American Heart Association Task Force on Practice Guidelines. Developed in collaboration with the American Association for Thoracic Surgery, American Society of Echocardiography, American Society of Nuclear Cardiology, Heart Failure Society of America, Heart Rhythm Society, Society for Cardiovascular Angiography and Interventions, and Society of Thoracic Surgeons. J. Am. Coll. Cardiol.58, e212–260, 10.1016/j.jacc.2011.06.011 (2011). - PubMed
-
- Ommen SR, et al. 2020 AHA/ACC guideline for the diagnosis and treatment of patients with hypertrophic cardiomyopathy: executive summary: a report of the American College of Cardiology/American Heart Association Joint Committee on Clinical Practice Guidelines. Circulation. 2020;142:e533–e557. doi: 10.1161/cir.0000000000000938. - DOI - PubMed
Publication types
MeSH terms
LinkOut - more resources
Full Text Sources
Other Literature Sources
Medical
