Identification and external validation of a prognostic signature associated with DNA repair genes in gastric cancer
- PMID: 33785812
- PMCID: PMC8010105
- DOI: 10.1038/s41598-021-86504-8
Identification and external validation of a prognostic signature associated with DNA repair genes in gastric cancer
Abstract
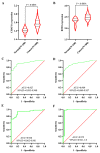
The aim of this study was to construct and validate a DNA repair-related gene signature for evaluating the overall survival (OS) of patients with gastric cancer (GC). Differentially expressed DNA repair genes between GC and normal gastric tissue samples obtained from the TCGA database were identified. Univariate Cox analysis was used to screen survival-related genes and multivariate Cox analysis was applied to construct a DNA repair-related gene signature. An integrated bioinformatics approach was performed to evaluate its diagnostic and prognostic value. The prognostic model and the expression levels of signature genes were validated using an independent external validation cohort. Two genes (CHAF1A, RMI1) were identified to establish the prognostic signature and patients ware stratified into high- and low-risk groups. Patients in high-risk group presented significant shorter survival time than patients in the low-risk group in both cohorts, which were verified by the ROC curves. Multivariate analysis showed that the prognostic signature was an independent predictor for patients with GC after adjustment for other known clinical parameters. A nomogram incorporating the signature and known clinical factors yielded better performance and net benefits in calibration plot and decision curve analyses. Further, the logistic regression classifier based on the two genes presented an excellent diagnostic power in differentiating early HCC and normal tissues with AUCs higher than 0.9. Moreover, Gene Set Enrichment Analysis revealed that diverse cancer-related pathways significantly clustered in the high-risk and low-risk groups. Immune cell infiltration analysis revealed that CHAF1A and RMI1 were correlated with several types of immune cell subtypes. A prognostic signature using CHAF1A and RMI1 was developed that effectively predicted different OS rates among patients with GC. This risk model provides new clinical evidence for the diagnostic accuracy and survival prediction of GC.
Conflict of interest statement
The authors declare no competing interests.
Figures


Similar articles
-
A nomogram model based on the number of examined lymph nodes-related signature to predict prognosis and guide clinical therapy in gastric cancer.Front Immunol. 2022 Nov 2;13:947802. doi: 10.3389/fimmu.2022.947802. eCollection 2022. Front Immunol. 2022. PMID: 36405735 Free PMC article.
-
Development and Validation of a Prognostic Nomogram for Gastric Cancer Based on DNA Methylation-Driven Differentially Expressed Genes.Int J Biol Sci. 2020 Feb 10;16(7):1153-1165. doi: 10.7150/ijbs.41587. eCollection 2020. Int J Biol Sci. 2020. PMID: 32174791 Free PMC article.
-
Identification of a Tumor Microenvironment-relevant Gene set-based Prognostic Signature and Related Therapy Targets in Gastric Cancer.Theranostics. 2020 Jul 9;10(19):8633-8647. doi: 10.7150/thno.47938. eCollection 2020. Theranostics. 2020. PMID: 32754268 Free PMC article.
-
Development and Validation of a Robust Immune-Related Prognostic Signature for Gastric Cancer.J Immunol Res. 2021 Apr 30;2021:5554342. doi: 10.1155/2021/5554342. eCollection 2021. J Immunol Res. 2021. PMID: 34007851 Free PMC article.
-
Identification of a 6-lncRNA prognostic signature based on microarray re-annotation in gastric cancer.Cancer Med. 2020 Jan;9(1):335-349. doi: 10.1002/cam4.2621. Epub 2019 Nov 19. Cancer Med. 2020. PMID: 31743579 Free PMC article.
Cited by
-
Falcarindiol Enhances Cisplatin Chemosensitivity of Hepatocellular Carcinoma via Down-Regulating the STAT3-Modulated PTTG1 Pathway.Front Pharmacol. 2021 May 7;12:656697. doi: 10.3389/fphar.2021.656697. eCollection 2021. Front Pharmacol. 2021. PMID: 34025420 Free PMC article.
-
Monocyte, neutrophil, and whole blood transcriptome dynamics following ischemic stroke.BMC Med. 2023 Feb 20;21(1):65. doi: 10.1186/s12916-023-02766-1. BMC Med. 2023. PMID: 36803375 Free PMC article.
-
Risk stratification based on DNA damage-repair-related signature reflects the microenvironmental feature, metabolic status and therapeutic response of breast cancer.Front Immunol. 2023 Mar 24;14:1127982. doi: 10.3389/fimmu.2023.1127982. eCollection 2023. Front Immunol. 2023. PMID: 37033959 Free PMC article.
References
Publication types
MeSH terms
Substances
LinkOut - more resources
Full Text Sources
Other Literature Sources
Medical
Miscellaneous

