

Low HDL and high triglycerides predict COVID-19 severity
- PMID: 33785815
- PMCID: PMC8010012
- DOI: 10.1038/s41598-021-86747-5
Low HDL and high triglycerides predict COVID-19 severity
Abstract
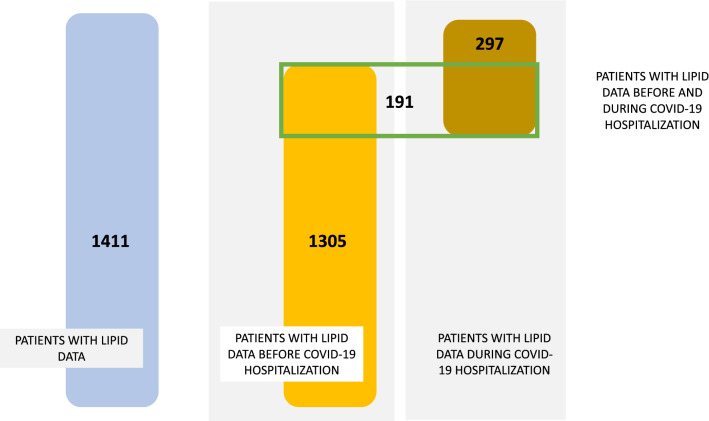
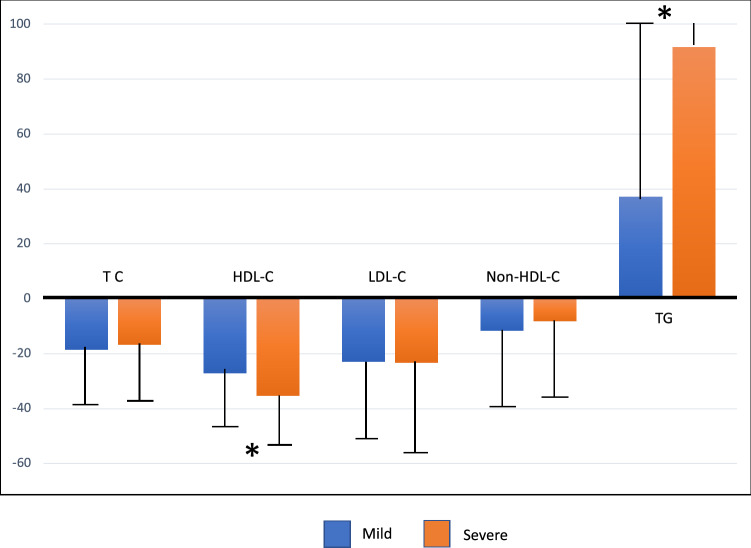
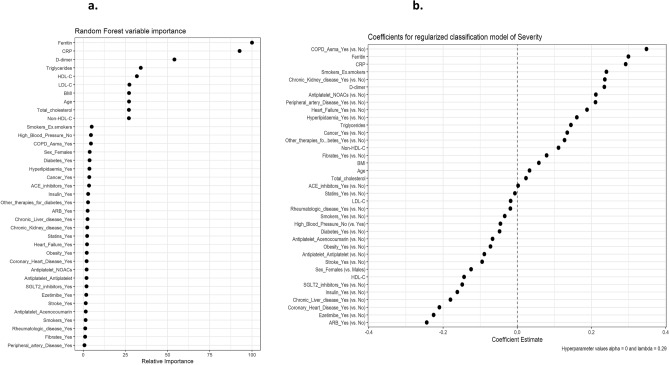
Lipids are indispensable in the SARS-CoV-2 infection process. The clinical significance of plasma lipid profile during COVID-19 has not been rigorously evaluated. We aim to ascertain the association of the plasma lipid profile with SARS-CoV-2 infection clinical evolution. Observational cross-sectional study including 1411 hospitalized patients with COVID-19 and an available standard lipid profile prior (n: 1305) or during hospitalization (n: 297). The usefulness of serum total, LDL, non-HDL and HDL cholesterol to predict the COVID-19 prognosis (severe vs mild) was analysed. Patients with severe COVID-19 evolution had lower HDL cholesterol and higher triglyceride levels before the infection. The lipid profile measured during hospitalization also showed that a severe outcome was associated with lower HDL cholesterol levels and higher triglycerides. HDL cholesterol and triglyceride concentrations were correlated with ferritin and D-dimer levels but not with CRP levels. The presence of atherogenic dyslipidaemia during the infection was strongly and independently associated with a worse COVID-19 infection prognosis. The low HDL cholesterol and high triglyceride concentrations measured before or during hospitalization are strong predictors of a severe course of the disease. The lipid profile should be considered as a sensitive marker of inflammation and should be measured in patients with COVID-19.
Conflict of interest statement
L. Masana: Has received personal fees for lectures and/or advisory work from Amgen, Sanofi, Mylan, Servier, MSD, Novartis, and Daiichi-Sankyo.N. Plana: Personal fees for lectures from Amgen, Mylan, and Sanofi. J. Pedro-Botet: Personal fees for lectures and/or advisory work from Amgen, Astra-Zeneca, Esteve, Ferrer, MSD, Mylan, Sanofi, Servier, and Rovi. C. Soler: Personal fees for lectures from Almirall, MSD, VISO farmacèutica, Mylan, and Esteve. M. Miret: Personal fees for lectures and/or advisory work from Sanofi, Novartis, Novonordisk, Astra-Zeneca, Esteve, Lilly, MSD, Ferrer, and Janssen, C. Jericó: Personal fees for lectures and/or advisory work from Sanofi, Amgen, MSD, Ferrer, Astra-Zeneca, Boehringer-Ingelheim, Lilly, Esteve, Novo-Nordisk, and Rovi. D. Ibarretxe: Personal fees for lectures from Sanofi, Rubió.E. Anoro, E. Correig, A. Pardo, C. Guerrero, S. Naf, JA. Arroyo, M. Urquizu-Padilla, V. Perea, R. Pérez-Berbalte, R. Ramirez-Montesinos, M. Royuela, and A. Zamora: Declare no conflicts of interest.
Figures


References
Publication types
MeSH terms
Substances
Grants and funding
LinkOut - more resources
Full Text Sources
Other Literature Sources
Medical
Research Materials
Miscellaneous
