. 2021 Jul;125(1):65-77.
doi: 10.1038/s41416-021-01364-3. Epub 2021 Mar 30.

Schlafen 11 predicts response to platinum-based chemotherapy in gastric cancers

Affiliations

Schlafen 11 predicts response to platinum-based chemotherapy in gastric cancers

Tsuyoshi Takashima et al. Br J Cancer. 2021 Jul.

Abstract

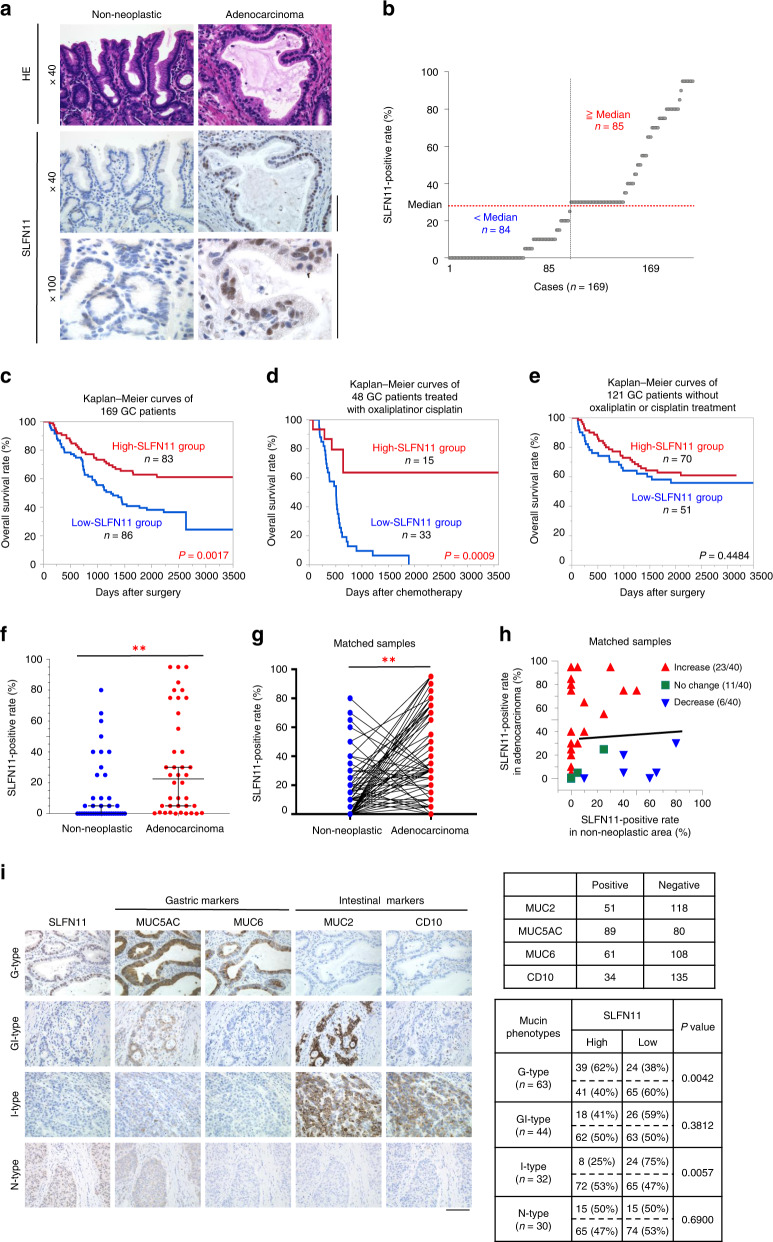
Background: Although unresectable or recurrent gastric cancers (GC) are frequently treated with platinum-based chemotherapy, response to treatment remains unpredictable. Because Schlafen 11 (SLFN11) is recently identified as a critical determinant of platinum sensitivity, we investigated the potential clinical utility of SLFN11 in the treatment of GC.

Methods: We analysed the correlation between SLFN11 expression and overall survival in 169 GC patients by our established immunohistochemical approach. The impact of SLFN11 expression on the response to platinum and transition of SLFN11 expression upon long-term treatment with platinum were examined using GC cell lines and organoids.

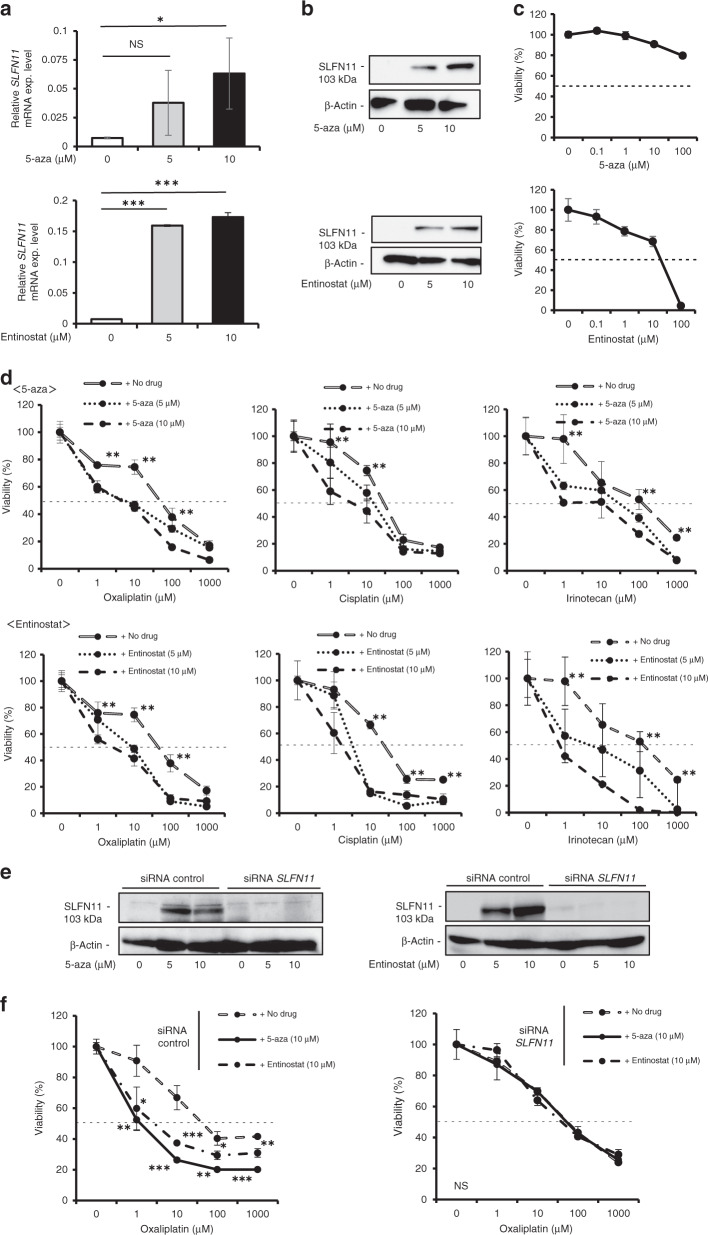
Results: GC patients with high-SLFN11 expression exhibited significantly better survival than those with low-SLFN11 expression, and the significance increased when we selected patients treated with platinum-based chemotherapy. Knockout of SLFN11 and reactivation of SLFN11 in GC cells conferred resistance and sensitivity to platinum, respectively. In GC cells and organoids, long-term treatment with oxaliplatin suppressed SLFN11 expression while imparting drug resistance. The acquired resistance to oxaliplatin was reversed by reactivation of SLFN11 with epigenetic modifying drugs.

Conclusions: This is the first report revealing definitive clinical implications of SLFN11 in the treatment of GC patients and providing novel strategies for the drug selection based on SLFN11 expression.


Conflict of interest statement

The authors declare no competing interests.

Figures

Fig. 1
Fig. 1. High expression of SLFN11 is a favourable prognostic marker for gastric cancer (GC) treated with platinum-based chemotherapy.
a Representative images of HE and immunohistochemical (IHC) staining for SLFN11 in non-neoplastic epithelium and adenocarcinoma. Scale bars are 100 μm. b Plots of SLFN11-positive rate (%) in 169 GC patients. The median (30%) was used as a cut-off value. c Kaplan–Meier curves for overall survival rate (%) in 169 GC patients divided into high-SLFN11 group (n = 83) and low-SLFN11 group (n = 86). Hazard ratio (HR), 0.5; 95% confidence interval (CI), 0.32–0.77; P = 0.0017 (log-rank test). d Kaplan–Meier curves for overall survival rate (%) in 48 GC patients (15 in high-SLFN11 group and 33 in low-SLFN11 group) previously treated with oxaliplatin or cisplatin. HR, 0.2; 95% CI, 0.06–0.51; P = 0.0009 (log-rank test). e Kaplan–Meier curves for overall survival rate (%) in 121 GC patients (70 in high-SLFN11 group and 51 in low-SLFN11 group) without oxaliplatin or cisplatin treatment. HR, 0.8; 95% CI, 0.46–1.42; P = 0.4484 (log-rank test). fh Comparison of SLFN11 expression in non-neoplastic epithelium and the adjacent adenocarcinoma in the same samples (n = 40). f Plots of SLFN11-positive rate (%) in the indicated regions. Bars represent the median and 95% CI. **P < 0.01 by unpaired t-test. g Plots of SLFN11-positive rate (%) of matched samples in the indicated regions were connected **P < 0.01 by paired t-test. h SLFN11-positive rate (%) of matched samples in the indicated regions is represented on a scatter plot. r = 0.0022. i Relationship between SLFN11 expression and GC mucin phenotypes in 169 GC patients. Representative IHC images for the indicated markers. Accordingly, samples were classified into Gastric type (G-type), Gastric and Intestinal mixed type (GI-type), Intestinal type (I-type) and Null type (N-type). Scale bars are 100 μm in enlarged images. Positive and negative numbers of samples for each marker are summarised (right upper). Fisher’s exact test was used for SLFN11 expression and GC mucin phenotype (each type and other types) (right lower).
Fig. 2
Fig. 2. SLFN11 expression is a major determinant of sensitivity to DNA-damaging agents in GC cell lines.
a Results of quantitative real-time PCR (qRT-PCR) showing SLFN11 mRNA expression in GC cell lines (MKN-1, MKN-7, MKN-45 and MKN-74). b Western blotting showing SLFN11 protein expression in the indicated GC cell lines. Actin was used as a loading control. c Viability curves of the indicated GC cell lines to various concentrations of oxaliplatin. Viability was examined by MTT 2 days after the drug treatments. d Western blotting showing SLFN11 expression in the MKN-1 parental and SLFN11-knockout (SLFN11-KO) cells (left) and in the MKN-45 parental and SLFN11-KO cells (right). d Immunohistochemical staining for SLFN11 expression in the MKN-1 parental and SLFN11-KO cells (left), and the MKN-45 parental and SLFN11-KO cells (right). Original magnification: ×100. Scale bars are 50 μm in the enlarged images. f Viability curves of the indicated cell lines to oxaliplatin, cisplatin, irinotecan and 5-FU. Viability was determined by MTT assays 2 days after the drug treatments. NS, not significant; *P  < 0.05, **P < 0.01, ***P < 0.001 by t-test. g Western blotting for the indicated proteins in the indicated cell lines. Each cell line was treated as indicated for 4 h. h Cell growth curves of the indicated cell lines. The cells were treated with the indicated concentration of irinotecan for 4 h and released into drug-free medium. Cell growth was measured by MTT assays at the indicated timings. ***P < 0.001 by t-test. a, c, f and h Representative results in triplicate from three independent experiments are shown as mean ± SD.
Fig. 3
Fig. 3. Epigenetic activation of SLFN11 further sensitises a GC cell line MKN-74 to DNA-damaging agents.
a Results of qRT-PCR showing SLFN11 mRNA expression in the MKN-74 cells that were treated/untreated with 5-aza (top) or entinostat (bottom) for 2 days. NS, not significant; *P < 0.05, ***P < 0.001 by t-test. b Western blotting showing SLFN11 protein expression under the same condition as (a). Actin was used as a loading control. c Viability curves for 5-aza (top) and entinostat (bottom) as single agents in MKN-74 cell line. Viability was determined by MTT assays 2 days after the drug treatments. d Viability curves of the MKN-74 cell line. MKN-74 cells were pretreated with 5-aza (top) or entinostat (bottom) for 2 days, washed and then treated with the indicated concentrations of oxaliplatin, cisplatin or irinotecan for 2 additional days. Viability was determined by MTT assays 2 days after the drug treatments. **P < 0.01 by t-test. e Western blotting for SLFN11 expression in MKN-74 cells treated with siRNA control (left) or siRNA SLFN11 (right). Two days after the siRNA transfection, cells were treated by 5-aza or entinostat for 2 additional days and whole-cell lysate was collected. Actin was used as a loading control. f Viability curves of the MKN-74 cell line transfected with siRNA control or siRNA SLFN11. The transfected MKN-74 cells were further treated with 5-aza or entinostat and with or without oxaliplatin. Viability curves were determined by MTT assays 2 days after the drug treatments. NS, not significant *P < 0.05, **P < 0.01, ***P < 0.001 by t-test. a, c, d and f Representative results in triplicate from three independent experiments are shown as mean ± SD.
Fig. 4
Fig. 4. GC cells acquire resistance to oxaliplatin while inactivating SLFN11.
a A scheme of oxaliplatin treatment to establish the oxaliplatin-resistant (oxa-resistant) MKN-45 cell line. b qRT-PCR showing SLFN11 mRNA expression in MKN-45 parental and oxa-resistant cells. ***P < 0.001 by t-test. c IHC for SLFN11 in MKN-45 parental and oxa-resistant cells. Original magnification: ×100. Scale bars are 10 μm in the enlarged images. d Western blotting examining SLFN11 expression in MKN-45 parental and oxa-resistant cells. Actin was used as a loading control. e Viability curves of MKN-45 parental and oxa-resistant cells for oxaliplatin. Viability was determined by MTT assays 2 days after the drug treatments. *P < 0.05, ***P < 0.001 by t-test. f Colony-formation assays performed in MKN-45 parental and oxa-resistant cells. Colony numbers were counted 10 days after the drug treatments and normalised by the number of untreated cells. *P < 0.05 by t-test. g qRT-PCR showing SLFN11 mRNA expression in the oxa-resistant MKN-45 cell line treated/untreated with 5-aza (top) or entinostat (bottom) for 2 days. *P < 0.05, ***P < 0.001 by t-test. h IHC for SLFN11 in the oxa-resistant MKN-45 cell line treated/untreated with 5-aza or entinostat for 2 days. Original magnification: ×100. Scale bars are 10 μm in the enlarged images. i Western blotting under the same conditions as (h). Actin was used as a loading control. j Viability curves in the oxa-resistant MKN-45 cell line in combination with 5-aza or entinostat for 2 days. Viability was determined by MTT assay 2 days after the drug treatments. *P < 0.05 by t-test. b, e, f, g and j Representative results in triplicate from three independent experiments are shown as mean ± SD.
Fig. 5
Fig. 5. Low-SLFN11 organoids acquire sensitivity to DNA-damaging agents in combination with epigenetic modifying drugs.
a Correlation analysis of SLFN11-positive rate between primary tumours vs. patient-derived organoids across 14 GC patients. Patients were classified as indicated by the threshold (30%) of organoid SLFN11-positive rate. b Viability curves of 14 GC organoids to oxaliplatin. Viability was determined by MTT assays 2 days after the drug treatments. Samples with colours corresponded to those of (a). c Comparison of IC50 of oxaliplatin in 8 high-SLFN11 and 6 low-SLFN11 GC organoids. **P < 0.01 by t-test. Bars represent the median and 95% CI. d Representative images of HE staining and IHC for SLFN11 in the primary tumour and organoids from patient #11. Original magnification: ×40 (primary tumour) and ×100 (organoids). Scale bars are 100 μm in the enlarged images. e qRT-PCR showing SLFN11 mRNA expression in the organoids from patient #11 treated with 5-aza (top) or entinostat (bottom) for 2 days. **P < 0.01, ***P < 0.001 by t-test. f Western blotting for the indicated proteins with the organoids from patient #11 treated/untreated with 5-aza (left) or entinostat (right) for 2 days. Actin was used as a loading control. g IHC for SLFN11 in the organoids from patient #11 treated/untreated with 5-aza or entinostat for 2 days. Original magnification: ×100. Scale bars are 100 μm in enlarged images. h Viability curves of the organoids from patient #11. The organoids were pretreated with 5-aza (top) or entinostat (bottom) for 2 days and then treated with the indicated concentrations of oxaliplatin, cisplatin or irinotecan for another 2 days before MTT assays were performed. *P < 0.05, **P < 0.01, ***P < 0.001 by t-test. b, e and h Representative results in triplicate from three independent experiments are shown as mean ± SD.
Fig. 6
Fig. 6. GC organoids acquire resistance to oxaliplatin while suppressing SLFN11 expression.
a A scheme of oxaliplatin treatment to establish the oxaliplatin-resistant (oxa-resistant) GC organoids from patient #7. b qRT-PCR showing SLFN11 mRNA expression in parental and oxa-resistant organoids from patient #7. ***P < 0.001. c Representative images of parental and oxa-resistant organoids from patient #7 (HE, top; IHC for SLFN11, bottom). Original magnification: ×40. Scale bars are 100 μm in the enlarged images. d Western blotting showing SLFN11 expression in parental and oxa-resistant organoids from patient #7. Actin was used as a loading control. e Viability curves of parental and oxa-resistant organoids from patient #7 for oxaliplatin. Viability was determined by MTT assay 2 days after drug treatments. *P < 0.05 by t-test. f qRT-PCR showing SLFN11 mRNA expression in oxa-resistant organoids from patient #7 treated/untreated with 5-aza or entinostat for 2 days. *P < 0.05 by t-test. g Representative images of oxa-resistant organoids from patient #7 treated/untreated with 5-aza or entinostat for 2 days. Original magnification: ×40. Scale bars are 100 μm in the enlarged images. h Viability curves of oxa-resistant organoids from patient #7 for oxaliplatin concomitantly treated with 5-aza or entinostat. Viability was determined by MTT assay after 2 days of drug treatment. *P < 0.05, ***P < 0.001 by t-test. b, e, f and h Representative results in triplicate from three independent experiments are shown as mean ± SD.

Similar articles

Cited by

References

    1. Ferlay J, Soerjomataram I, Dikshit R, Eser S, Mathers C, Rebelo M, et al. Cancer incidence and mortality worldwide: sources, methods and major patterns in GLOBOCAN 2012. Int J. Cancer. 2015;136:E359–E386. doi: 10.1002/ijc.29210. - DOI - PubMed
    1. Davidson M, Okines AF, Starling N. Current and future therapies for advanced gastric cancer. Clin. Colorectal Cancer. 2015;14:239–250. doi: 10.1016/j.clcc.2015.05.013. - DOI - PubMed
    1. Takahari D, Chin K, Ishizuka N, Takashima A, Minashi K, Kadowaki S, et al. Multicenter phase II study of trastuzumab with S-1 plus oxaliplatin for chemotherapy-naive, HER2-positive advanced gastric cancer. Gastric Cancer. 2019;22:1238–1246. doi: 10.1007/s10120-019-00973-5. - DOI - PubMed
    1. Yamada Y, Higuchi K, Nishikawa K, Gotoh M, Fuse N, Sugimoto N, et al. Phase III study comparing oxaliplatin plus S-1 with cisplatin plus S-1 in chemotherapy-naive patients with advanced gastric cancer. Ann. Oncol. 2015;26:141–148. doi: 10.1093/annonc/mdu472. - DOI - PubMed
    1. Murai J, Targeting DNA. repair and replication stress in the treatment of ovarian cancer. Int J. Clin. Oncol. 2017;22:619–628. doi: 10.1007/s10147-017-1145-7. - DOI - PubMed

Publication types

MeSH terms