. 2021 Apr;4(4):2000210.
doi: 10.1002/adtp.202000210. Epub 2021 Feb 12.

Sulfoglycodendrimer Therapeutics for HIV-1 and SARS-CoV-2

Affiliations

Sulfoglycodendrimer Therapeutics for HIV-1 and SARS-CoV-2

Lauren Wells et al. Adv Ther (Weinh). 2021 Apr.

Abstract

Hexavalent sulfoglycodendrimers (SGDs) are synthesized as mimics of host cell heparan sulfate proteoglycans (HSPGs) to inhibit the early stages in viral binding/entry of HIV-1 and SARS-CoV-2. Using an HIV neutralization assay, the most promising of the seven candidates are found to have sub-micromolar anti-HIV activities. Molecular dynamics simulations are separately implemented to investigate how/where the SGDs interacted with both pathogens. The simulations revealed that the SGDs: 1) develop multivalent binding with polybasic regions within and outside of the V3 loop on glycoprotein 120 (gp120) for HIV-1, and consecutively bind with multiple gp120 subunits, and 2) interact with basic amino acids in both the angiotensin-converting enzyme 2 (ACE2) and HSPG binding regions of the Receptor Binding Domain (RBD) from SARS-CoV-2. These results illustrate the considerable potential of SGDs as inhibitors in viral binding/entry of both HIV-1 and SARS-CoV-2 pathogens, leading the way for further development of this class of molecules as broad-spectrum antiviral agents.

Keywords: HIV‐1; SARS‐CoV‐2 receptor binding domain; glycodendrimers; molecular dynamics.


Conflict of interest statement

The authors declare no conflict of interest.

Figures
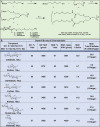
Figure 1
Figure 1
A) Synthesis of seven SGDs containing common mono, di, and trisaccharides. a) TsCl, pyridine, CH2Cl2, overnight, room temperature. b) K2CO3, acetonitrile, reflux, 48 h. c) TFA, CH2Cl2, room temperature, 2 h. d) TBTU, DIPEA, DMSO, pH = 9, overnight. e) SO3‐pyridine, DMF, 0 °C, 1 h. B) Summary of structural data for Compounds 12d,e–18d,e.
Figure 2
Figure 2
Summary of all biological data for SGDs, Compounds 12e–18e. General notations: NA, Assay not conducted. Colors: Green‐Significant activity, Gray‐No significant activity, Yellow‐Positive assay controls. aELISA assays report the average IC50 value obtained for a minimum of two assays for each compound and evaluated concentrations of 0–400µg mL−1 in duplicate wells. bMST Kd values were obtained from triplicate measurements of serial dilutions (0.01–50 000 nmol) of the SGDs evaluated. cEach sample concentration was tested in duplicate. For SGDs 12e–18e, the presence of a greater than (>) sign indicates that no reduction in the luciferase signal was observed at any concentration tested (0.02–50 µg mL−1) compared to no test sample. For DS and CHO1‐31, sample concentrations ranged from 0.01–25 µg mL−1. dFor the cytotoxicity assessment, 12e–18e and DS were tested for reduction of relative luminescence units (RLU) after 48 h as compared to a no compound control. The concentrations presented are as follows: 0–50 µg mL−1 for 14e, 16e and 17e and 0–25 µg mL−1 for 12e, 13e, 15e, 18e, and DS, respectively. No measurable toxicity was observed for 12e–18e as evidenced by the > sign in front of the highest concentration tested, while for DS, a 45% drop in the living cell population was observed at 50 nm concentration, as measured by the presence of ATP.
Figure 3
Figure 3
MST summary. Left panel: Diagram illustrating the general MST experiment process. At the top, a quartz capillary loaded with sample is heated with a laser focused on a narrow region of the capillary tube. Upper left quadrant: The initial random distribution of fluorescently‐tagged protein in the bound and unbound states with the glycodendrimer at equilibrium. Upper right quadrant: Once the laser is turned on, the temperature gradient will cause the bound and unbound proteins to migrate out of the heated area at different rates. Lower left quadrant: This depicts the heated region of the capillary after the differential migration of the bound/unbound proteins. Lower right quadrant: The molecules return to a random distribution in the capillary after the laser is turned off. Right panel: MST results for selected SGDs plus positive control DS. The labeled‐gp120 concentration is 200 nm for all trials, and the y‐axis represents the MST responses at the 5 s mark after heating.
Figure 4
Figure 4
Different SGDs attached to one gp120 trimer: A) Cellobiose‐SGD (12e); B) Lactose‐SGD (15e); C) Maltotriose‐SGD (17e); D) Melibiose‐SGD (18e). Only two SGDs with the most favorable binding configurations are shown in each case. Proteins are shown as a white surface, SGDs are represented in atomistic details, and the gp120 residues interacting with SGDs (within 3 Å) are shown in licorice. The coloring scheme: V3 loop–purple; SGD atoms: C–cyan, O–red, S–yellow, N–blue, H–omitted; basic residue–blue, acidic residue–red, polar residue–green, nonpolar residue–white. Water and ions are omitted for better visualization. E) Percentage of different interactions contributing to the SGD‐gp120 binding (left bar: quantified over the whole protein; right bar: quantified only with V3 loop. Polar–white: interaction with polar amino acids; hydrophobic–red: interaction with hydrophobic amino acids; charge–blue: interaction with positively charged amino acids.
Figure 5
Figure 5
Lactose SGD (15e) binding with RBD of SARS‐CoV‐2. A) Two views (90° rotation) of 15e binding with the ACE2 binding region. B) Two views (90° rotation) of 15e binding with the purported HSPG binding region. Coloring scheme: SGD: C‐cyan, O‐red, S‐yellow, N‐blue, H‐omitted, SARS‐CoV‐2 interacting amino acids: Arg‐pink, Lys‐grey. Water and ions are omitted for better visualization. C) Percentage of different interactions contributing to the binding to the RBD of SARS‐CoV‐2 averaged over all the binding modes. Polar–white: interaction with polar amino acids; hydrophobic–red: interaction with hydrophobic amino acids; charge–blue: interaction with positively charged amino acids. C‐cellobiose (12e); L‐lactose (15e). D) Free energy of binding for GDs (12d, 15d) and SGDs (12e, 15e) with RBD of SARS‐CoV‐2 (two trials for each system). Top: refers to the initial placement of the GD/SGD near the ACE2 binding region. Mid: Refers to the initial placement of the GD/SGD near the HSPG binding region.

Similar articles

Cited by

References

    1. UNAIDS, Fact Sheet‐World AIDS Day, https://www.unaids.org/en/resources/fact-sheet (accessed: December 2020).
    1. Worldometer, Coronavirus, https://www.worldometers.info/coronavirus/ (accessed: December 2020).
    1. CDC, Flu Vaccination Coverage, United States, 2018–19 Influenza Season, https://www.cdc.gov/flu/fluvaxview/coverage-1819estimates.htm (accessed: May 2020).
    1. Gibas K. M., van den Berg P., Powell V. E., Krakower D. S., Drugs 2019, 79, 609. - PMC - PubMed
    1. a) Spillmann D., Biochimie 2001, 83, 811; - PubMed
    2. b) Choi Y., Chung H., Jung H., Couchman J. R., Oh E.‐S., Matrix Biol. 2011, 30, 93; - PubMed
    3. c) Kamhi E., Joo E. J., Dordick J. S., Linhardt R. J., Biological Rev. 2013, 88, 928; - PubMed
    4. d) Chen Y., Gotte M., Liu J., Park P. W., Mol. Cells 2008, 26, 415; - PubMed
    5. e) Lang J., Yang N., Deng J., Liu K., Yang P., Zhang G., Jiang C., PloS One 2011, 6, e23710; - PMC - PubMed
    6. f) Hondermarck H., Bartlett N. W., Nurcombe V., FASEB BioAdv. 2020, 2, 296. - PMC - PubMed

LinkOut - more resources