. 2021 Aug 5;138(5):370-381.
doi: 10.1182/blood.2020008743.

KDM5 inhibition offers a novel therapeutic strategy for the treatment of KMT2D mutant lymphomas

Affiliations

KDM5 inhibition offers a novel therapeutic strategy for the treatment of KMT2D mutant lymphomas

James Heward et al. Blood. .

Erratum in

Abstract

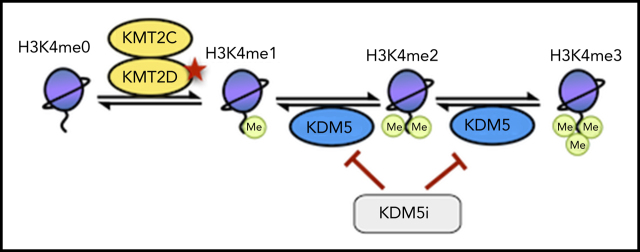
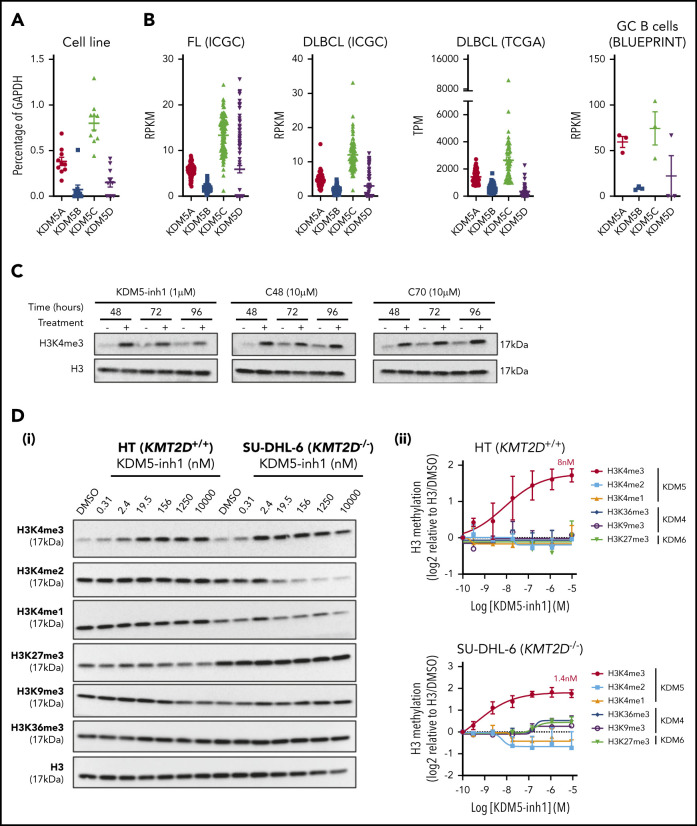
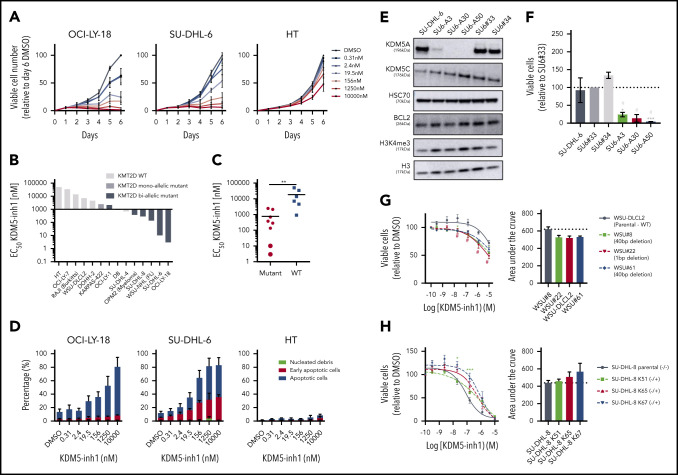
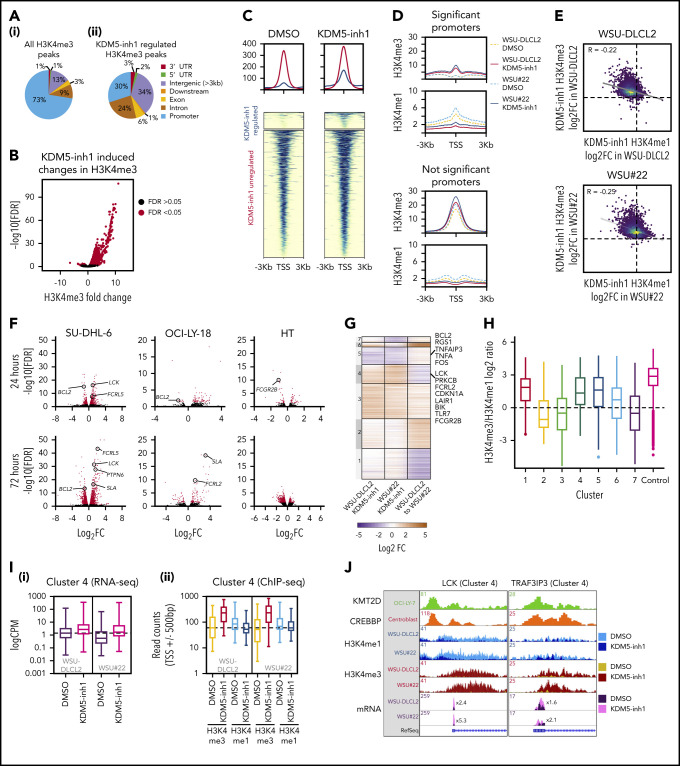
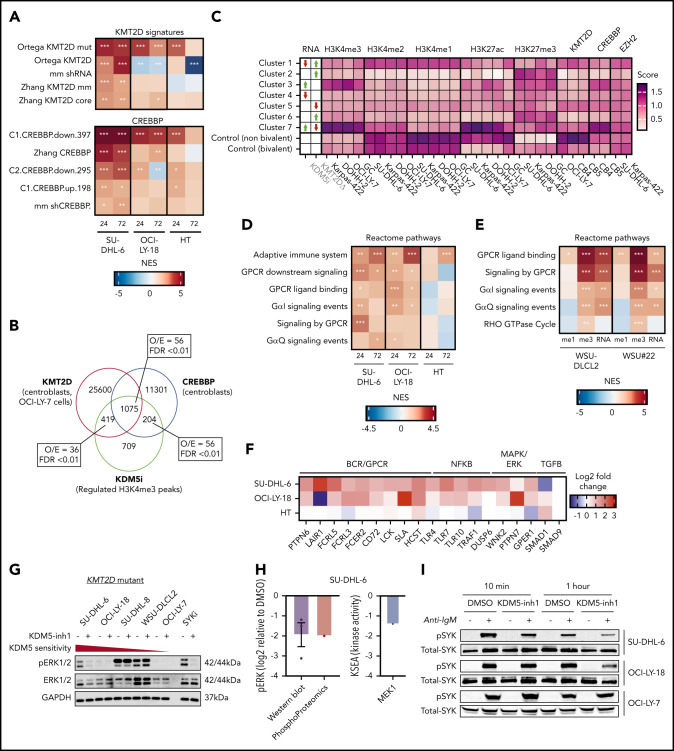
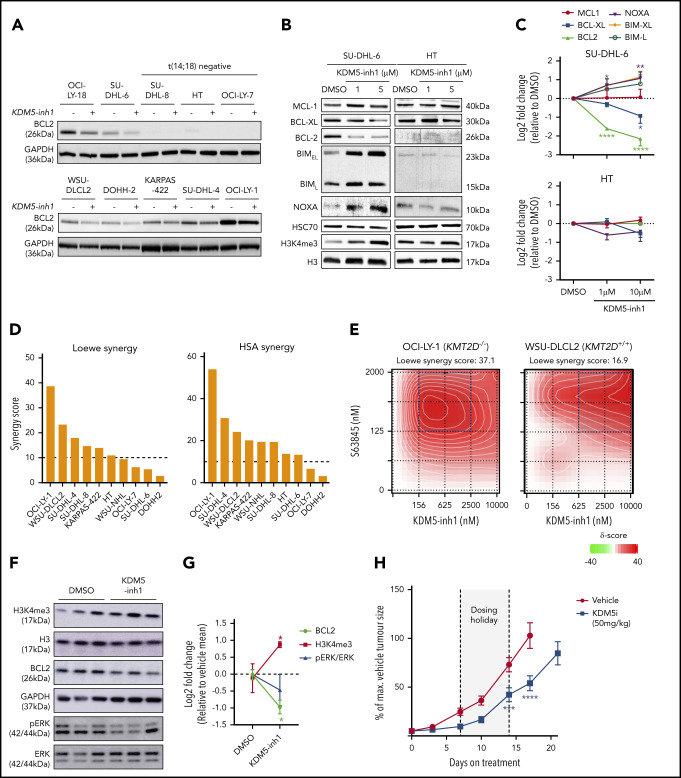
Loss-of-function mutations in KMT2D are a striking feature of germinal center (GC) lymphomas, resulting in decreased histone 3 lysine 4 (H3K4) methylation and altered gene expression. We hypothesized that inhibition of the KDM5 family, which demethylates H3K4me3/me2, would reestablish H3K4 methylation and restore the expression of genes repressed on loss of KMT2D. KDM5 inhibition increased H3K4me3 levels and caused an antiproliferative response in vitro, which was markedly greater in both endogenous and gene-edited KMT2D mutant diffuse large B-cell lymphoma cell lines, whereas tumor growth was inhibited in KMT2D mutant xenografts in vivo. KDM5 inhibition reactivated both KMT2D-dependent and -independent genes, resulting in diminished B-cell signaling and altered expression of B-cell lymphoma 2 (BCL2) family members, including BCL2 itself. KDM5 inhibition may offer an effective therapeutic strategy for ameliorating KMT2D loss-of-function mutations in GC lymphomas.


Figures

None
Graphical abstract
Figure 1.
Figure 1.
KDM5 inhibition increases H3K4me3 levels in DLBCL cell lines. (A) The expression of the 4 KDM5 family members (KDM5A-D) was examined by quantitative reverse transcriptase-polymerase chain reaction in 10 DLBCL cell lines and normalized to the expression of GAPDH. Data are the mean ± standard error of the mean (SEM) of 3 independent experiments. (B) KDM5 family member expression was examined by RNA-seq in publicly available datasets of FL (ICGC, n = 97) and DLBCL (TCGA, n = 48; ICGC, n = 74) patients, plus healthy GC B cells (BLUEPRINT). RPKM, reads per kilobase million; TPM, transcripts per million. (C) SU-DHL-6 cells were treated with 1 µM KDM5-inh1 or 10 µM Compound-48 and KDM5-C70 for 48, 72, and 96 hours, followed by western blot analysis of H3K4me3 levels relative to H3. (D) The SU-DHL-6 and HT cell lines were treated with DMSO or increasing concentrations of KDM5-inh1 for 48 hours. Representative western blots for H3K4me3/me2/me1 (KDM5), H3K9me3/K36me3 (KDM4), H3K27me3 (KDM6), and H3 (i). Quantification of western blots relative to H3 (ii). Data are mean ± SEM of 3 independent experiments.
Figure 2.
Figure 2.
KDM5 inhibition reduces the proliferation of KMT2D mutant cell lines. (A-B) DLBCL, FL, myeloma, and Burkitt’s lymphoma cell lines were treated with DMSO or increasing concentrations of KDM5-inh1, and viable cells were quantified every day up to 6 days for OCI-LY-18, SU-DHL-6, and HT cells (A) and after 5 days for all cell lines (B), with EC50 values for KMT2D WT and mutant cell lines displayed in a waterfall plot. (C) Dot plot showing the significantly lower EC50 values for KMT2D mutant cell lines. Statistical significance was determined by Mann-Whitney U test: **P < .01. (D) Induction of apoptosis was quantified in OCI-LY-18, SU-DHL-6, and HT cells treated with DMSO or increasing concentrations of KDM5-inh1 for 5 days. (E) Western blots showing loss of KDM5A in 3 homozygous knockout clones (SU6-A3, A30, A50) compared with parental and WT controls (SU6#33, #34), alongside expression of KDM5C, BCL2, and H3K4me3 levels. (F) Parental, control, and KDM5A knockout SU-DHL-6 cells were seeded at 4000 cells per well, and viable cell numbers were quantified after 6 days. Statistical significance was calculated using a 2-way analysis of variance (ANOVA) with a Tukey’s posttest: *P < .05 and ***P < .001 relative to SU6#33, and #P < .05 relative to SU6#34. (G-H) Viable cell counts from WSU-DLCL2 cells and 3 KMT2D mutant clones (G) or parental SU-DHL-8 cells and 3 corrected clones (H) treated with DMSO or increasing concentrations of KDM5-inh1 for 5 days. Data are the mean ± standard error of the mean of 3 to 7 independent experiments. Statistical significance was calculated using a 2-way ANOVA with a Dunnett’s posttest: */#P < .005; ***P < .001.
Figure 3.
Figure 3.
Epigenetic and transcriptomic characterization of KDM5 inhibition. (A) Genomic locations of H3K4me3 peaks identified by ChIP-seq in cells treated with DMSO (i) or 1 μM KDM5-inh1 (ii) for 72 hours. (B) KDM5 inhibition induced changes in H3K4me3, with significantly changed peaks displayed in red. (C) Heatmaps of ChIP-seq data showing difference in H3K4me3 levels between promoters significantly altered (blue) or otherwise (red) in SU-DHL-6 cells treated with DMSO or 1 µM KDM5-inh1 for 72 hours. (D) Spatial plots showing distribution of H3K4me1 and H3K4me3 at promoters with significantly altered H3K4me3 by KDM5-inh1 or otherwise in WSU-DLCL2 (yellow/red) and WSU#22−/+ (light/dark blue) cells treated with DMSO (yellow/light blue) or KDM5-inh1 (red/dark blue). (E) Plots showing broad increases in H3K4me3 and reductions in H3K4me1, quantified by ChIP-seq, at the transcription start site (TSS) (±500 bp) of H3K4me3+ genes in WSU-DLCL2 and WSU#22−/+ cells treated with 1μM KDM5-inh1. The Pearson’s correlation coefficient is indicated on each plot. (F) Volcano plots indicating DE genes in SU-DHL-6, OCI-LY-18, and HT cells treated with 1 μM KDM5-inh1 for 24 and 72 hours, with significant genes highlighted in red. (G) Heatmap showing log2FC values for 897 genes that were DE by either KDM5-inh1 or KMT2D loss and clustered using K-means clustering. (H) H3K4me3 and H3K4me1 reads were counted for the promoters in each cluster and then divided (H3K4me3/H3K4me1) and log2 normalized to create a summary ratio for each. Control promoters were identified as being H3K4me3+ in WSU-DLCL2 cells but showing no alteration in mRNA expression or H3K4me3/H3K4me1 deposition in any of our analyses. (I) Boxplots showing RNA-seq logCPM values (i) and TSS read counts across ChIP-seq (ii) datasets of genes from cluster 4. (J) ChIP-seq and RNA-seq tracks, centered on LCK and TRAF3IP3, from WSU-DLCL2 and WSU#22−/+ cells treated with KDM5-inh1 for 72 hours, plus ChIP-seq tracks of KMT2D (OCI-LY-7) and CREBBP (centroblasts) binding.
Figure 4.
Figure 4.
KDM5 inhibition regulates KMT2D target genes and BCR signaling regulators. (A) Heatmap indicating normalized enrichments scores (NESs) of KMT2D and CREBBP signatures in KDM5-inh1–treated cells, following GSEA of RNA-seq profiles using a manually curated database of B-cell signatures. (B) Overlap between KDM5 inhibition–regulated regions in SU-DHL-6 and CREBBP or KMT2D bound regions, with observed/expected and FDR values for the overlaps indicated. (C) Deeptools was used to calculate summary scores at the promoters (transcription start site [TSS] ± 500 bp) of genes in each cluster (Figure 3G) plus nonbivalent (H3K4me3+/H3K27me3−) and bivalent (H3K4me3/H3K27me3+) control promoters for ChIP-seq datasets of histone mark deposition (ENCODE/BLUEPRINT) and KMT2D, CREBBP, and EZH2/SUZH12 binding. The overall direction of change in RNA expression, following KDM5i or KMT2D loss, is indicated for each cluster in the first 2 columns. (D-E) Heatmaps indicating NES following GSEA of the Reactome database in RNA-seq profiles from KDM5-inh1–treated cells (D) and RNA-seq plus promoter H3K4me1 and H3K4me3 profiles from KDM5-inh1–treated WSU-DLCL2/WSU#22−/+ cells (E). (F) Log2FC values of B-cell signaling regulators in SU-DHL-6, OCI-LY-18, and HT cells treated with KDM5-inh1. (G-H) Levels of pERK1/2 (T202/Y204) and ERK1/2 were quantified by western blot in cell lines exposed to 1 μM KMD5-inh1 for 5 days or 1 μM entospletinib for 48 hours (G), with the quantification of 3 individual replicates (H), alongside levels of ERK1 Y204 measured by phosphoproteomics and MEK1 activity quantified by kinase substrate enrichment analysis. (I) Activation of SYK was investigated by western blot analysis in SU-DHL-6, OCI-LY-18, and OCI-LY-7 cells treated with DMSO or KDM5-inh1 for 72 hours, followed by anti-IgM F(ab′)2 antibody stimulation for 10 minutes or 1 hour.
Figure 5.
Figure 5.
KDM5 inhibition alters the expression of BCR signaling and apoptotic regulatory genes. (A) Expression of BCL2 protein was examined by western blot in 10 DLBCL cell lines exposed to DMSO or 1 μM KDM5-inh1 for 48 hours. (B) SU-DHL-6 and HT cells were treated with DMSO or 1 and 5 μM KDM5-inh1 for 5 days, with the cells reseeded in fresh drug/media after 48 hours. The expression of BCL2 family members was investigated by western blot, with HSC70 used as a loading control. Western blots are representative of 3 independent experiments, with the quantification relative to HSC70 displayed in panel C. Statistical significance was determined using an analysis of variance (ANOVA) with a Dunnett’s posttest vs untreated control: *P < .05; **P < .01; ****P < .0001. Viable cells were quantified in 10 lymphoma cell lines treated with increasing concentrations of KDM5-inh1 for 5 days, alongside increasing concentrations of S63845 (MCL1i) for 3 days. (D) Overall Loewe and highest single agent (HSA) synergy scores calculated for each cell line using Synergy Finder, with a score >10 indicating significant synergy. (E) Plots showing the degree of synergy between different concentrations of KDM5-inh1 and S63845 in OCI-LY-1 and WSU-DLCL2 cells, with the area of maximum synergy indicated by a blue box. (F-G) Global levels of H3K4me3 in tumors from mice treated with vehicle or 50 mg/kg KDM5-inh1 for 1 week (n = 3) were quantified by western blot and normalized to H3, whereas BCL2 and pERK levels were quantified and normalized to GAPDH and total ERK, respectively. (H) Activity of 50 mg/kg KDM5-inh1 on the growth of SU-DHL-6 xenografts in comparison with vehicle-treated mice. Data are the mean ± standard error of the mean of 10 individual mice, except in the vehicle group where one mouse was removed because of insufficient tumor growth (<300 mm3). Statistical significance was calculated using a 2-way ANOVA with a Dunnett’s posttest: ***P < .001; ****P < .0001.

Comment in

  • Epigenetic balance in DLBCL.
    Oricchio E. Oricchio E. Blood. 2021 Aug 5;138(5):355-356. doi: 10.1182/blood.2021011647. Blood. 2021. PMID: 34351369 No abstract available.

References

    1. Okosun J, Bödör C, Wang J, et al. . Integrated genomic analysis identifies recurrent mutations and evolution patterns driving the initiation and progression of follicular lymphoma. Nat Genet 2014;46(2):176-181. - PMC - PubMed
    1. Pasqualucci L, Khiabanian H, Fangazio M, et al. . Genetics of follicular lymphoma transformation. Cell Rep 2014;6(1):130-140. - PMC - PubMed
    1. Green MR, Kihira S, Liu CL, et al. . Mutations in early follicular lymphoma progenitors are associated with suppressed antigen presentation. Proc Natl Acad Sci USA 2015;112(10):E1116-E1125. - PMC - PubMed
    1. Araf S, Okosun J, Koniali L, Fitzgibbon J, Heward J. Epigenetic dysregulation in follicular lymphoma. Epigenomics 2016;8(1):77-84. - PMC - PubMed
    1. Chapuy B, Stewart C, Dunford AJ, et al. . Molecular subtypes of diffuse large B cell lymphoma are associated with distinct pathogenic mechanisms and outcomes. Nat Med 2018;15:1. - PMC - PubMed

Publication types

MeSH terms