. 2021 May 30;42(14):1006-1017.
doi: 10.1002/jcc.26519. Epub 2021 Mar 30.

ClassicalGSG: Prediction of log P using classical molecular force fields and geometric scattering for graphs

Affiliations

ClassicalGSG: Prediction of log P using classical molecular force fields and geometric scattering for graphs

Nazanin Donyapour et al. J Comput Chem. .

Abstract

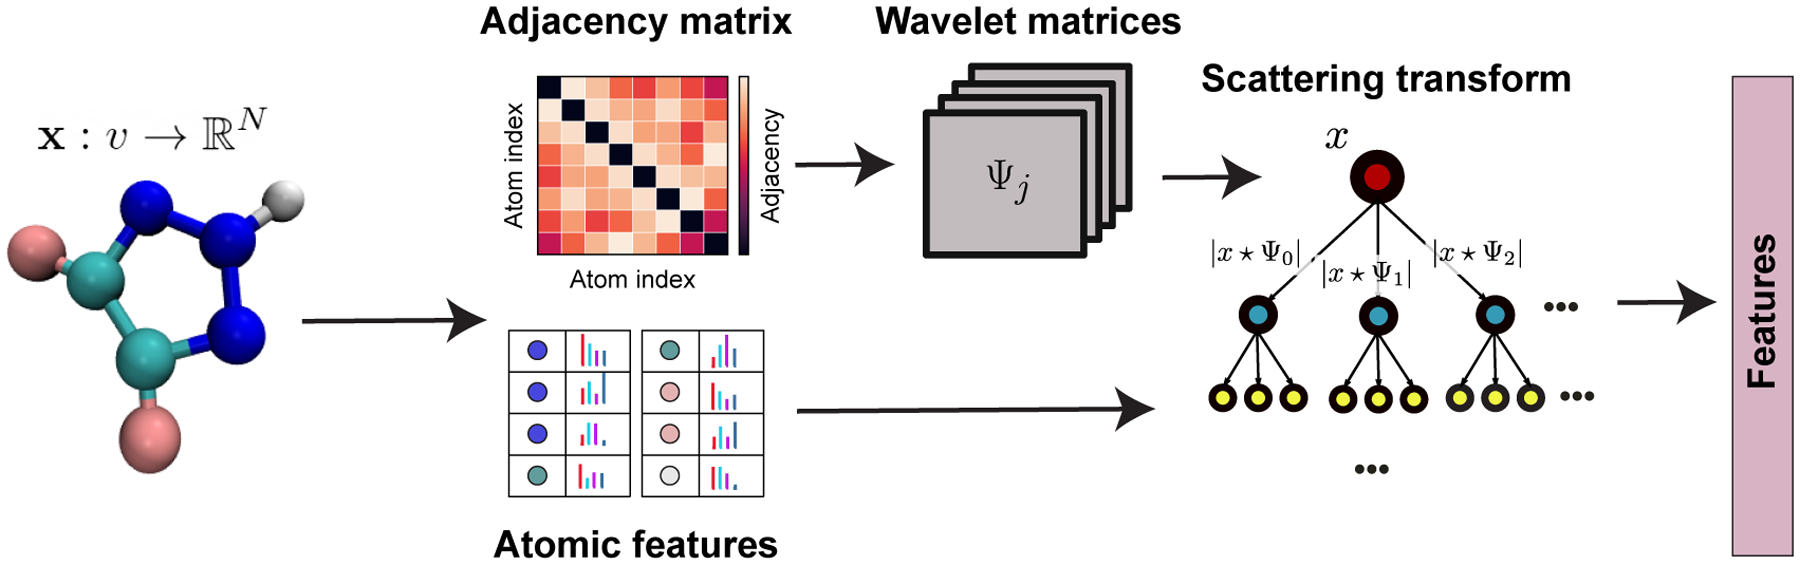
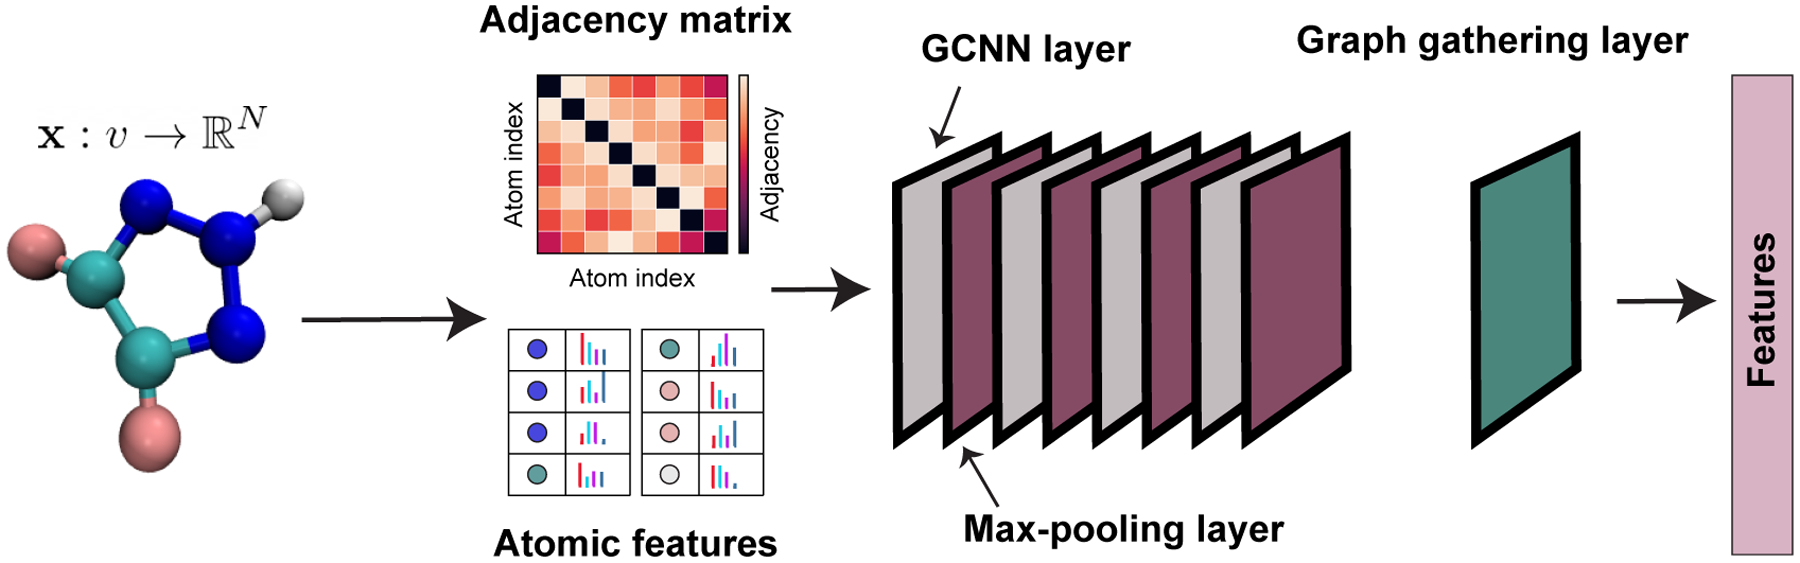
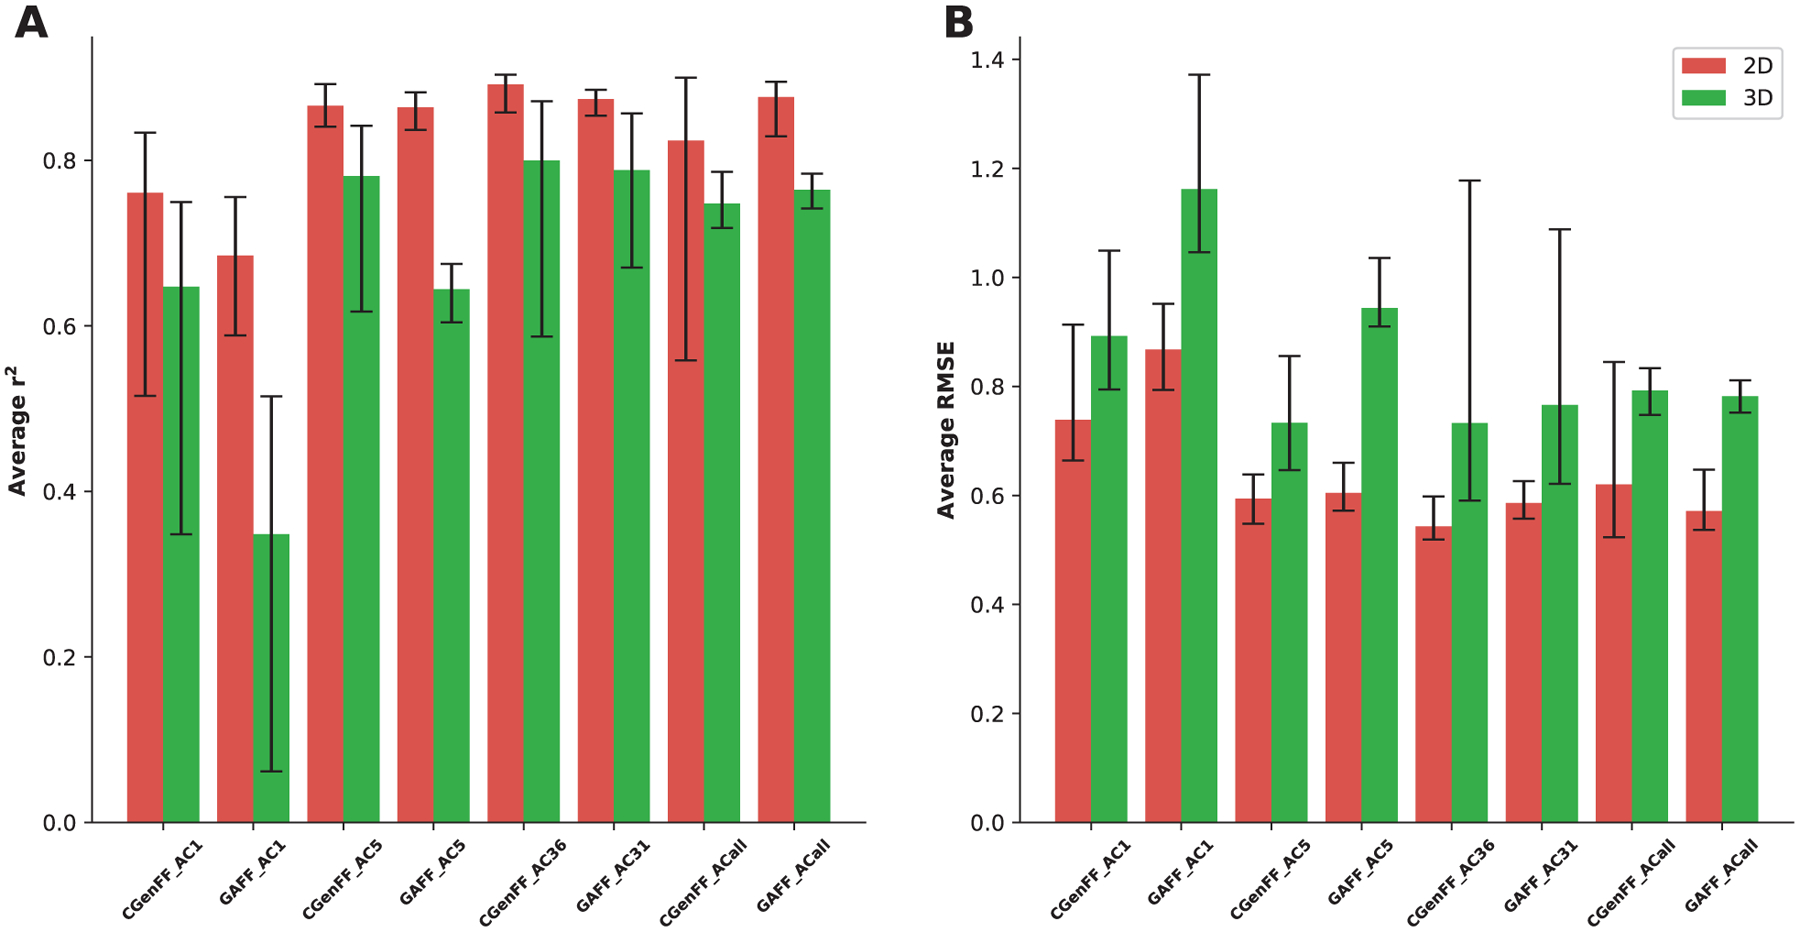
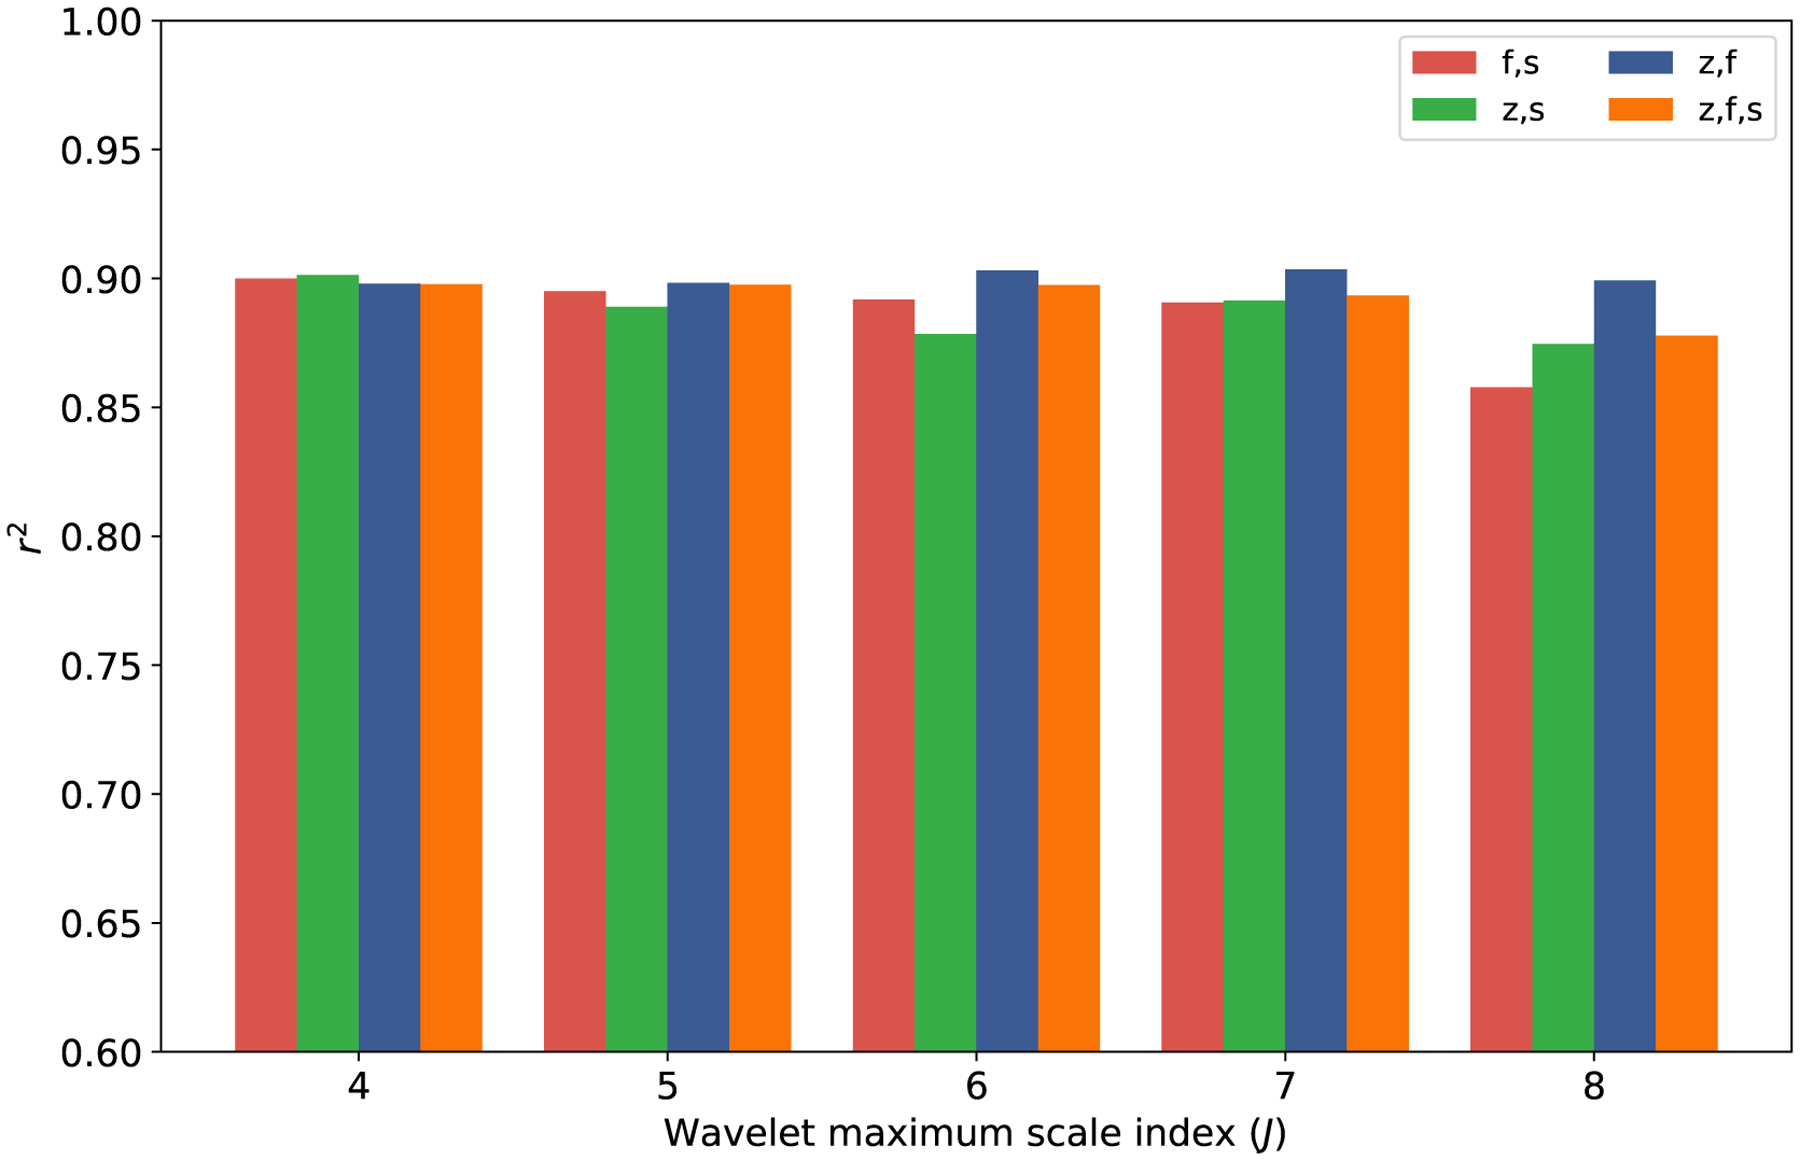
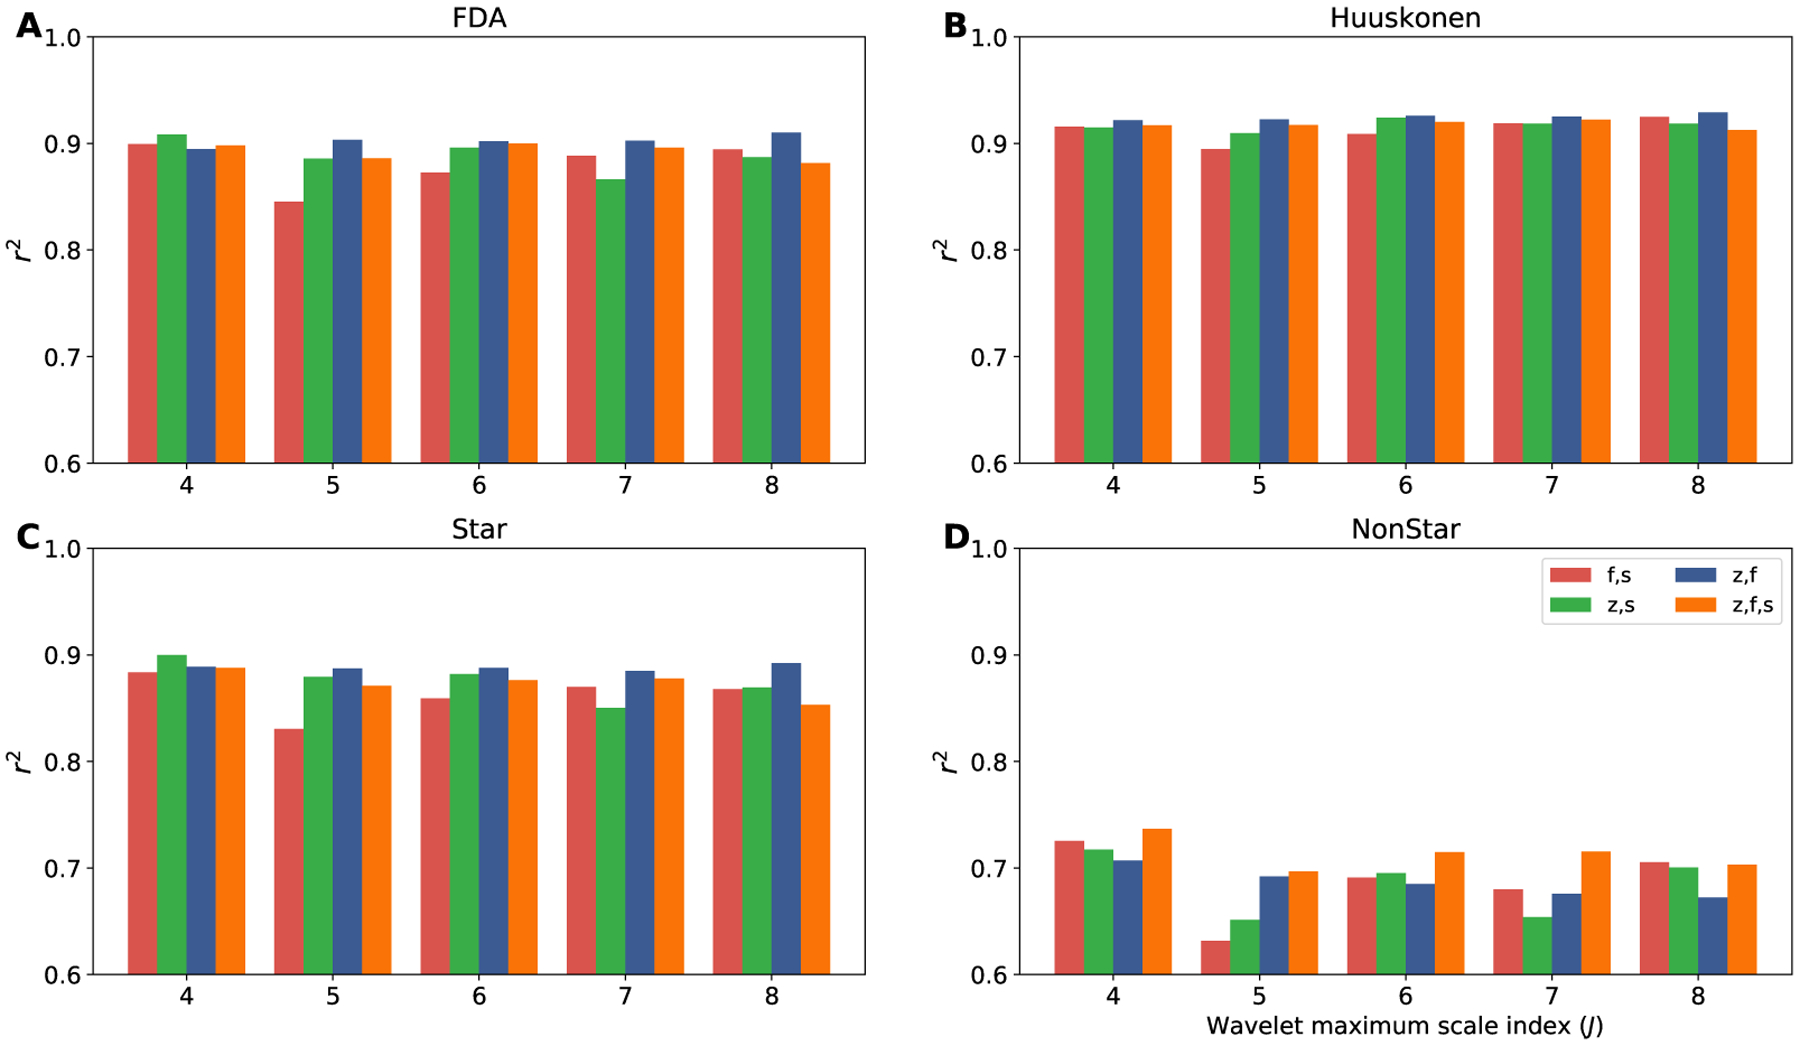
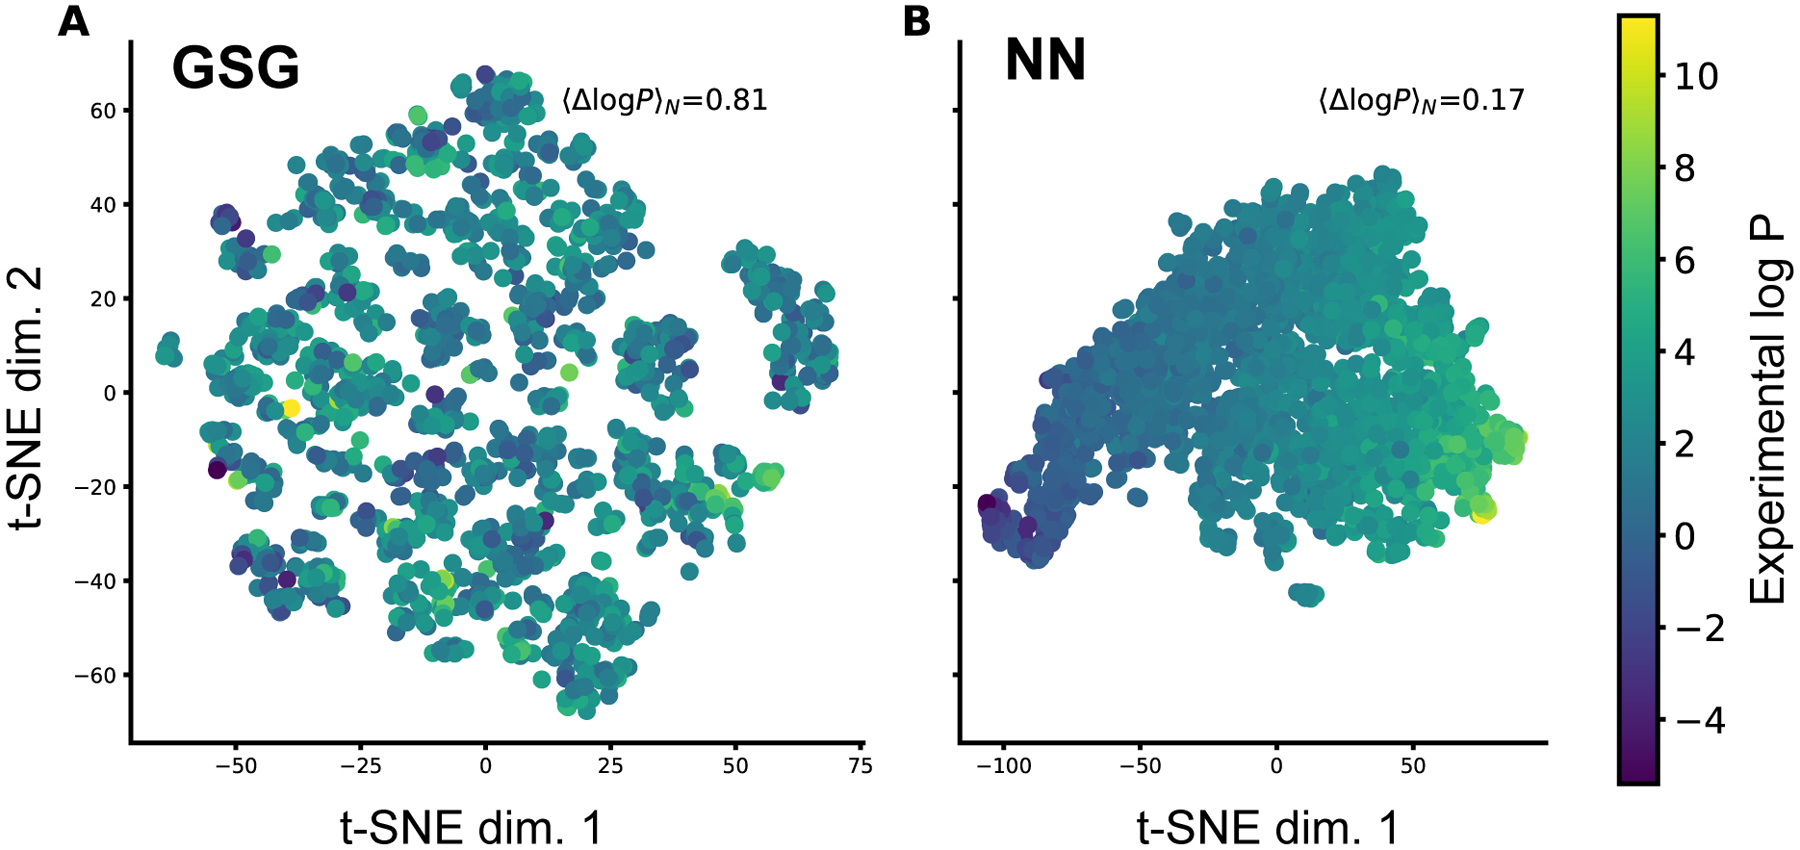
This work examines methods for predicting the partition coefficient (log P) for a dataset of small molecules. Here, we use atomic attributes such as radius and partial charge, which are typically used as force field parameters in classical molecular dynamics simulations. These atomic attributes are transformed into index-invariant molecular features using a recently developed method called geometric scattering for graphs (GSG). We call this approach "ClassicalGSG" and examine its performance under a broad range of conditions and hyperparameters. We train ClassicalGSG log P predictors with neural networks using 10,722 molecules from the OpenChem dataset and apply them to predict the log P values from four independent test sets. The ClassicalGSG method's performance is compared to a baseline model that employs graph convolutional networks. Our results show that the best prediction accuracies are obtained using atomic attributes generated with the CHARMM generalized force field and 2D molecular structures.

Keywords: geometric scattering for graphs; graph convolutional networks; log P prediction; partition coefficients.


Figures

Figure 1:
Figure 1:
Architecture of the GSG method. The adjacency matrix describes the graph structure of the molecule. Each atom has a set of attributes that are shown as colored bars. Wavelet matrices Ψ are built at different logarithmic scales, j, using the adjacency matrix as described in the text. Finally, the scattering transform is applied to get the graph features using both the wavelet matrices and the signal vectors. Modified from figure made by Feng et al.
Figure 2:
Figure 2:
Architecture of the GCN method. The adjacency matrix describes the graph structure of the molecule. Each atom has a set of attributes and are shown as colored bars. GCN layers are shown by gray color and are followed a max-pooling layer which is shown in purple. The graph gathering layer is shown in green color adds features on all nodes to generate the molecular feature vector.
Figure 3:
Figure 3:
Average r2 (A) and RMSE (B) for the OpenChem test set using GSGNN models. Each average is calculated over 20 individual parameter values and the error bars show the best and worst performing models. The atomic attributes are generated with either CGenFF or GAFF2 force fields and using one of three atom type classification schemes (”AC1”, ”AC5”, ”AC36/AC31” or ”ACall”).
Figure 4:
Figure 4:
The r2 for the OpenChem test set using GSGNN models. The atomic attributes are all generated with CGenFF force fields, AC36 atom type classification scheme, and 2D molecular structure.
Figure 5:
Figure 5:
The r2 for different test sets using GSGNN models. A) shows r2 for the FDA test set. B) represent r2 for the Huuskonen test set. C) and D) show r2 for the Star and NonStar test sets, respectively. The horizontal axis indicates the maximum wavelet scale J. The atomic attributes are generated with 2D molecular structure, CGenFF force fields and using AC36 atom type classification scheme.
Figure 6:
Figure 6:
The t-SNE plots with GSG and NN features of the OpenChem test set molecules. Each represents a molecule and is colored by its actual log P value. 〈Δlog PN shows the mean log P difference value calculated over the nearest neighbors in the t-SNE plot. A) The GSG features of size 1716 are projected into 2-dimensional space. B) The NN features from the last hidden layer with size of 400 are projected into 2-dimensional space.
Figure 7:
Figure 7:
Probability distributions of molecular fingerprints. The histograms show the distribution of fingerprints of all data and failed molecules of 5 GCGNN models. The distribution of all data is shown in thick black line. A) The number of shortest paths of length 2, B) the atomic weight, C) the number of carbon atoms (ncarb) and D) the number of heavy atoms.

References

    1. Lipinski CA, Lombardo F, Dominy BW, and Feeney PJ, Advanced Drug Delivery Reviews 23, 3 (1997). - PubMed
    1. Kwon Y, Handbook of essential pharmacokinetics, pharmacodynamics and drug metabolism for industrial scientists (Springer Science & Business Media, 2001).
    1. Ran Y and Yalkowsky SH, Journal of Chemical Information and Computer Sciences 41, 354 (2001). - PubMed
    1. Yalkowsky SH and Valvani SC, Journal of Pharmaceutical Sciences 69, 912 (1980). - PubMed
    1. Ryckmans T, Edwards MP, Horne VA, Correia AM, Owen DR, Thompson LR, Tran I, Tutt MF, and Young T, Bioorganic & Medicinal Chemistry Letters 19, 4406 (2009). - PubMed

Publication types

MeSH terms

LinkOut - more resources