. 2021 May;53(10):3378-3393.
doi: 10.1111/ejn.15213. Epub 2021 May 5.

Functional connectivity of the hippocampus and its subfields in resting-state networks

Affiliations

Functional connectivity of the hippocampus and its subfields in resting-state networks

Laura Ezama et al. Eur J Neurosci. 2021 May.

Abstract

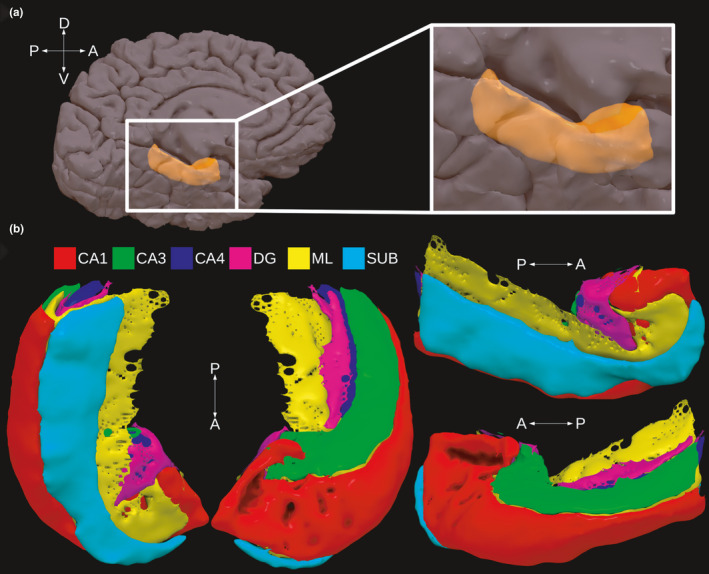
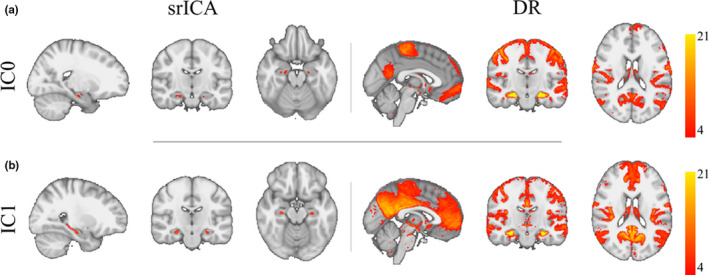
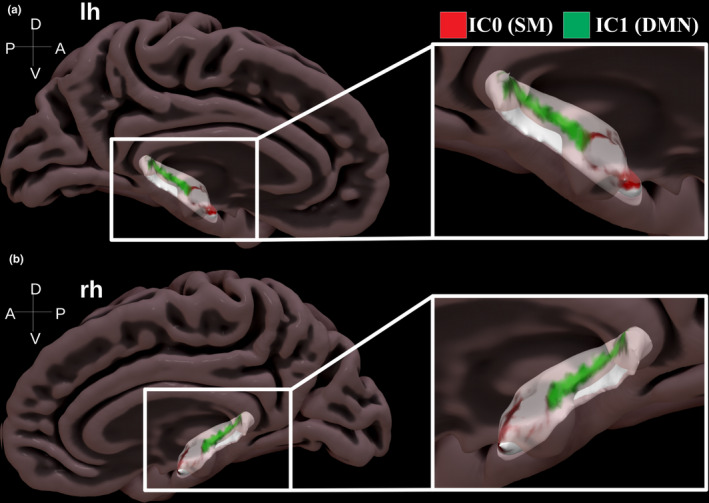
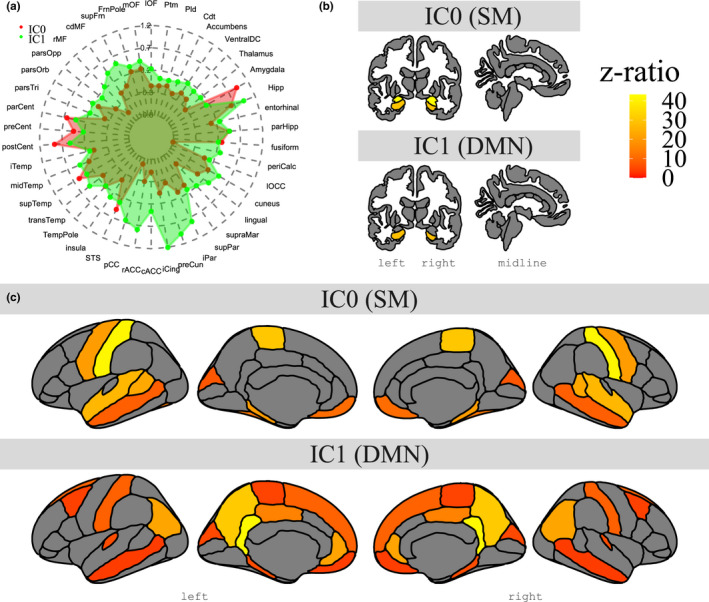
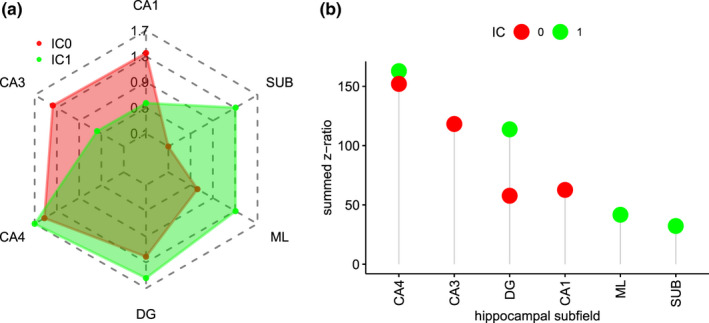
Many neuroimaging studies have shown that the hippocampus participates in a resting-state network called the default mode network. However, how the hippocampus connects to the default mode network, whether the hippocampus connects to other resting-state networks and how the different hippocampal subfields take part in resting-state networks remains poorly understood. Here, we examined these issues using the high spatial-resolution 7T resting-state fMRI dataset from the Human Connectome Project. We used data-driven techniques that relied on spatially-restricted Independent Component Analysis, Dual Regression and linear mixed-effect group-analyses based on participant-specific brain morphology. The results revealed two main activity hotspots inside the hippocampus. The first hotspot was located in an anterior location and was correlated with the somatomotor network. This network was subserved by co-activity in the CA1, CA3, CA4 and Dentate Gyrus fields. In addition, there was an activity hotspot that extended from middle to posterior locations along the hippocampal long-axis and correlated with the default mode network. This network reflected activity in the Subiculum, CA4 and Dentate Gyrus fields. These results show how different sections of the hippocampus participate in two known resting-state networks and how these two resting-state networks depend on different configurations of hippocampal subfield co-activity.

Keywords: CA1; Hippocampal subfields; ICA; Resting-State fMRI; subiculum.


Conflict of interest statement

The authors have no conflicts of interest to declare.

Figures

FIGURE 1
FIGURE 1
Presentation of hippocampal anatomy in a given participant from the experiment. Panel A shows the location of the hippocampus (in orange) on the medial surface of the brain. Panel B shows the various hippocampal subfields that were detected using automatic segmentation procedures (see text for details)
FIGURE 2
FIGURE 2
Results from group spatial ICA restricted to the hippocampal region (left panels under heading srICA) and Dual Regression (right panels under heading DR) in the two detected ICs (a,b). The maps under DR show whole‐brain group‐level FC maps using the hotspots detected using the ICs as seeds. Note that IC0 correlated with the somatomotor network and IC1 with the default mode network. IC and FC maps are corrected and thresholded Z maps at Z > 4
FIGURE 3
FIGURE 3
Surface projection of activity hotspots along the hippocampal long‐axis seen in a medial‐sagittal view for the left (a) and right hemisphere (b). Note how there is a bilateral activity hotspot in the anterior section of the hippocampus (IC0 correlated with somatomotor network, red colour) and a bilateral activity hotspot that extends from middle to posterior sections (IC1 correlated with default mode network, green colour)
FIGURE 4
FIGURE 4
Overview of model‐derived estimated marginal means for whole‐brain group‐level FC for the two ICs in areas from the Desikan–Killiany atlas (a), as well as contrast effects in subcortical (b) and cortical structures (c), where IC0 shows the contrast of each region reliable more co‐activated than the mean co‐activity of all other regions within IC0 (top row), and IC1 shows the contrast of each region reliable more co‐activated than the mean co‐activity of all other regions within IC1 (bottom row). Note how IC0 connects to regions of the somatomotor network and how IC1 connects with regions of the default mode network
FIGURE 5
FIGURE 5
Group‐level co‐activity values for each hippocampal subfield in each IC from model‐derived estimated marginal means (a) and summed z‐ratios that indicate the strength of co‐activity of each subfield within a given resting‐state network (IC). Note how for IC0 (somatomotor, red colour), there is strong co‐activity for CA4/DG, CA1 and CA3, and how for IC1 (default mode, green colour), there is strong co‐activity in CA4/DG and SUB. Note also ML is listed for reasons detailed in the text

References

    1. Adnan, A. , Barnett, A. , Moayedi, M. , McCormick, C. , Cohn, M. , & McAndrews, M. P. (2016). Distinct hippocampal functional networks revealed by tractography‐based parcellation. Brain Structure and Function, 221, 2999–3012. 10.1007/s00429-015-1084-x - DOI - PubMed
    1. Aggleton, J. P. (2012). Multiple anatomical systems embedded within the primate medial temporal lobe: Implications for hippocampal function. Neuroscience & Biobehavioral Reviews, 36, 1579–1596. 10.1016/j.neubiorev.2011.09.005 - DOI - PubMed
    1. Andersen, P. , Morris, R. , Amaral, D. , Bliss, T. , & O'Keefe, J. (2006). The hippocampus book. Oxford University Press.
    1. Anticevic, A. , Dierker, D. L. , Gillespie, S. K. , Repovs, G. , Csernansky, J. G. , Van Essen, D. C. , & Barch, D. M. (2008). Comparing surface‐based and volume‐ based analyses of functional neuroimaging data in patients with schizophrenia. NeuroImage, 41, 835–848. 10.1016/j.neuroimage.2008.02.052 - DOI - PMC - PubMed
    1. Bakker, A. , Kirwan, C. B. , Miller, M. , & Stark, C. E. (2008). Pattern separation in the human hippocampal CA3 and dentate gyrus. Science, 319, 1640–1642. 10.1126/science.1152882 - DOI - PMC - PubMed

Publication types