. 2021 Mar 31:10:e64694.
doi: 10.7554/eLife.64694.

An expanding manifold in transmodal regions characterizes adolescent reconfiguration of structural connectome organization

Collaborators, Affiliations

An expanding manifold in transmodal regions characterizes adolescent reconfiguration of structural connectome organization

Bo-Yong Park et al. Elife. .

Abstract

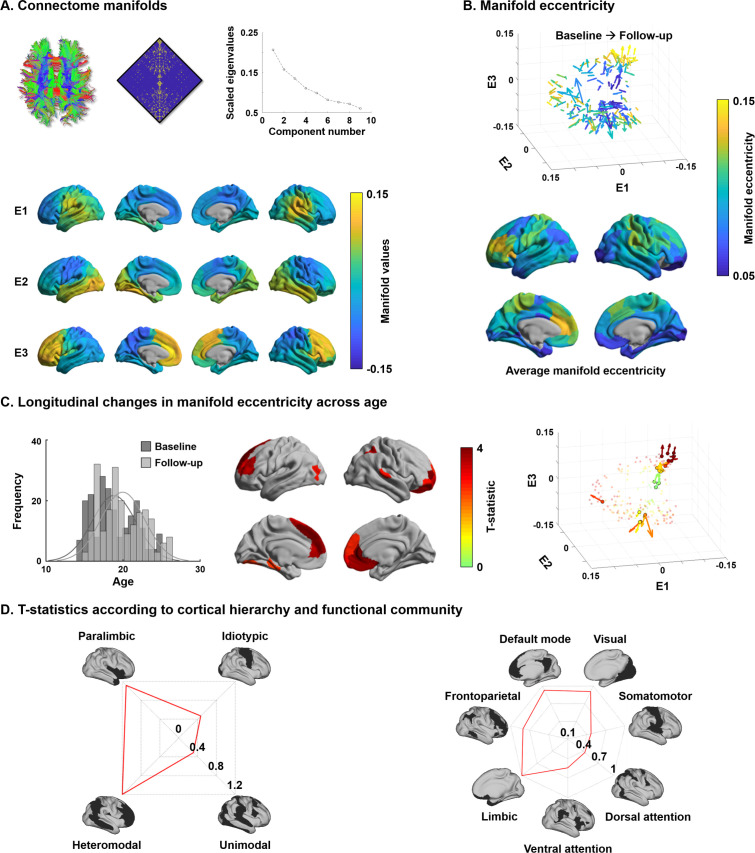
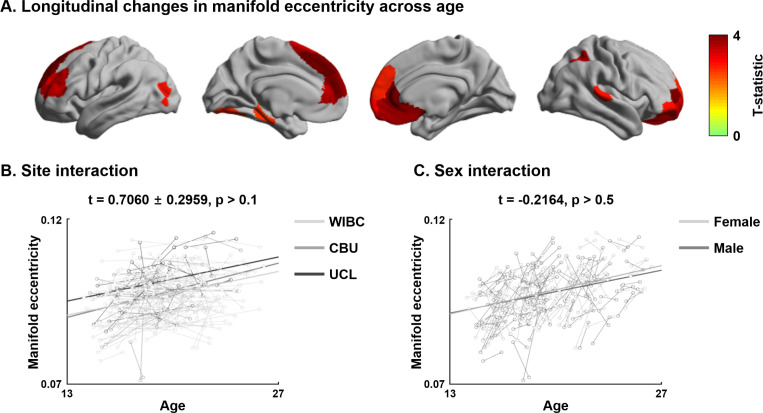
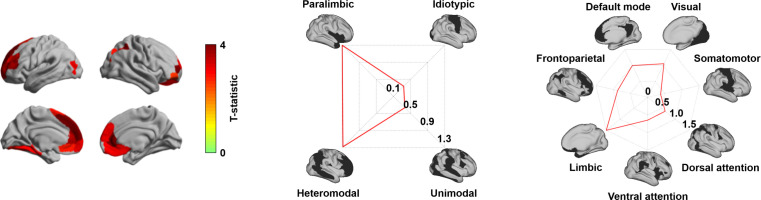
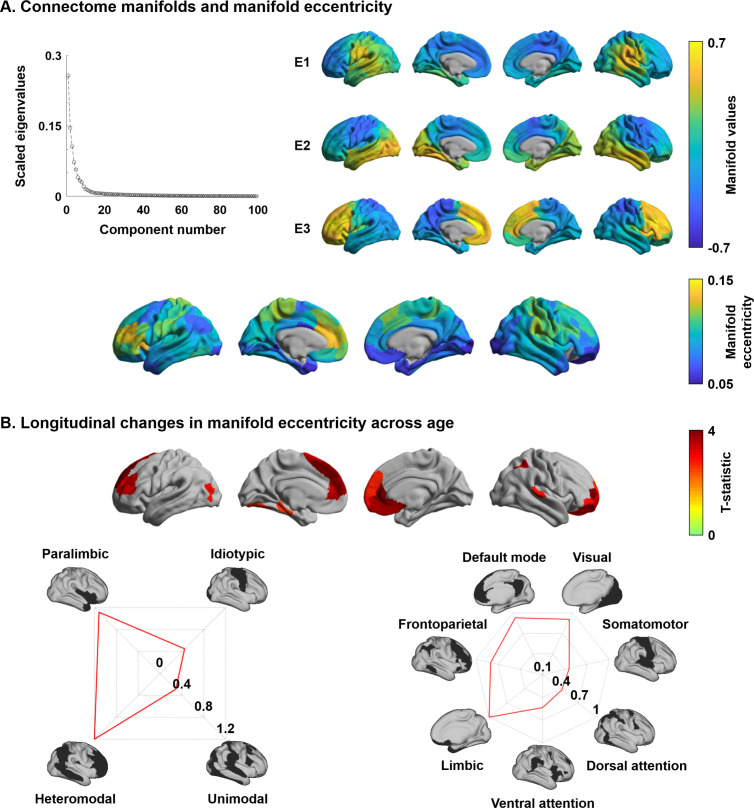
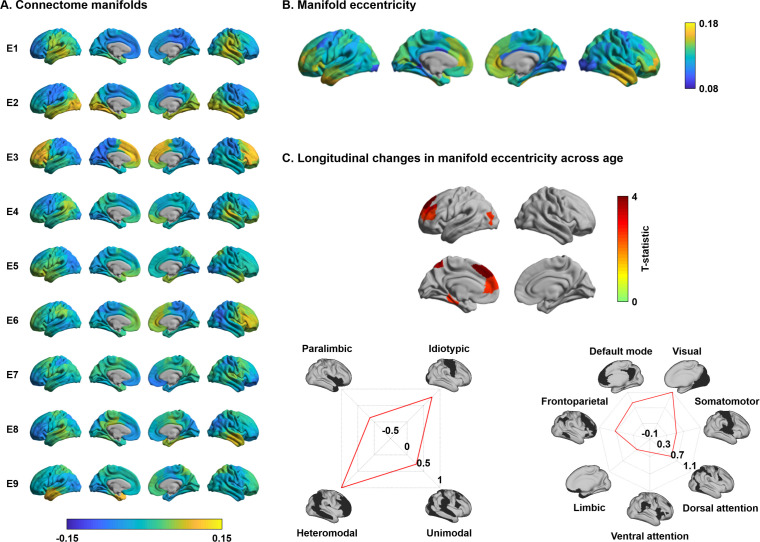
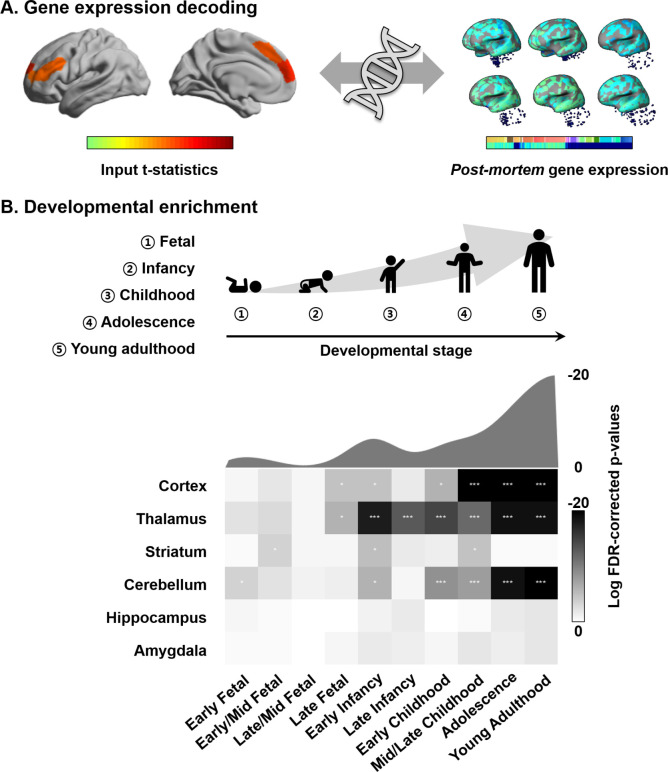
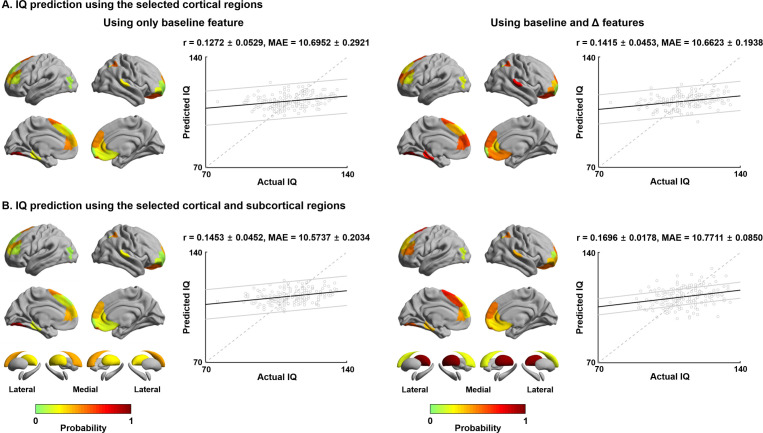
Adolescence is a critical time for the continued maturation of brain networks. Here, we assessed structural connectome development in a large longitudinal sample ranging from childhood to young adulthood. By projecting high-dimensional connectomes into compact manifold spaces, we identified a marked expansion of structural connectomes, with strongest effects in transmodal regions during adolescence. Findings reflected increased within-module connectivity together with increased segregation, indicating increasing differentiation of higher-order association networks from the rest of the brain. Projection of subcortico-cortical connectivity patterns into these manifolds showed parallel alterations in pathways centered on the caudate and thalamus. Connectome findings were contextualized via spatial transcriptome association analysis, highlighting genes enriched in cortex, thalamus, and striatum. Statistical learning of cortical and subcortical manifold features at baseline and their maturational change predicted measures of intelligence at follow-up. Our findings demonstrate that connectome manifold learning can bridge the conceptual and empirical gaps between macroscale network reconfigurations, microscale processes, and cognitive outcomes in adolescent development.

Keywords: adolescence; connectome; human; longitudinal; multi-scale; neurodevelopment; neuroimaging; neuroscience.


Conflict of interest statement

BP, RB, CP, SL, RR, RV, BB No competing interests declared, EB ETB. serves on the scientific advisory board of Sosei Heptares and as a consultant for GlaxoSmithKline.

Figures

Figure 1.
Figure 1.. Structural connectome manifolds.
(A) Systematic fiber tracking based on diffusion magnetic resonance imaging generated a cortex-wide structural connectome, which was subjected to diffusion map embedding. As shown in the scree plot, three eigenvectors (E1, E2, E3) accounted for approximately 50% information of connectome data, and each depicted a different gradual transition across the cortical mantle. (B) Manifold eccentricity measured by Euclidean distance between the template center and each data point. Arrows depict average positional change in connectivity space from baseline to follow-up. The color of each arrow represents each brain region mapped on the surface on the bottom. (C) The histogram represents age distribution of all subjects at baseline and follow-up. The colors on brain surfaces indicate t-statistics of regions showing significant longitudinal changes in manifold eccentricity across age, following multiple comparisons correction with a false discovery rate < 0.05. Datapoint colors in the scatter plot represent t-statistics. Identified regions are represented with arrows that originate from baseline to follow-up. (D) Stratification of age-related changes in manifold eccentricity according to prior models of cortical hierarchy (Mesulam, 1998) and functional magnetic resonance imaging communities (Yeo et al., 2011).
Figure 1—figure supplement 1.
Figure 1—figure supplement 1.. Association between structural connectome manifold and connectome topology measures.
(A) Six clusters defined within the identified regions that showed significant age-related changes in manifold eccentricity (see Figure 1C). (B) Associations between within-subject changes in manifold eccentricity and those of each connectome topology measure. Brain surfaces on the right side represent changes in each measure between baseline and follow-up. Significances were corrected for multiple comparisons using false discovery rate adjustment.
Figure 1—figure supplement 2.
Figure 1—figure supplement 2.. Modular structures.
(A) Pipeline for constructing a connectivity consistency matrix. We constructed individual subject-wise consistency matrices by considering whether two different nodes were involved in the same module. (B) The group-wise consistency matrix was constructed by averaging subject-wise consistency matrices. The k-means clustering with silhouette coefficient was used to define modules. Seven modules on the brain surface are reported on the right side.
Figure 1—figure supplement 3.
Figure 1—figure supplement 3.. Age-related trends in connectome topology measures.
Age-related changes in manifold eccentricity, degree centrality, connectivity distance, within-module degree, and participation coefficient. y: years.
Figure 1—figure supplement 4.
Figure 1—figure supplement 4.. Structural connectome manifolds using Schaefer 300 atlas.
(A–D) Main findings were replicated using a different parcellation scale. For details, see Figure 1.
Figure 1—figure supplement 5.
Figure 1—figure supplement 5.. Sensitivity analysis for site and sex.
(A) The t-statistics of identified regions that showed significant age-related changes in manifold eccentricity. (B) Interaction effects of the relationship between age and manifold eccentricity for sites and (C) biological sexes. WIBC: Wolfson Brain Imaging Centre; CBU: MRC Cognition and Brain Sciences Unit; UCL: University College London.
Figure 1—figure supplement 6.
Figure 1—figure supplement 6.. Longitudinal changes in manifold eccentricity, after excluding participants with the lowest correspondence to template manifolds.
The t-statistics of regions showing significant longitudinal changes in manifold eccentricity across age are reported on cortical surfaces. Effects are stratified with respect to levels of cortical hierarchy (Mesulam, 1998) and intrinsic functional communities (Yeo et al., 2011).
Figure 1—figure supplement 7.
Figure 1—figure supplement 7.. Structural connectome manifolds generated using principal component analysis.
(A) Scree plot showing eigenvalue decay, and the first three eigenvectors (E1, E2, E3) are shown on cortical surfaces. Manifold eccentricity is shown in the bottom panel. (B) Surface plots displaying t-statistics of regions showing significant longitudinal changes in manifold eccentricity across age. Effects are stratified with respect to levels of cortical hierarchy (Mesulam, 1998) and intrinsic functional communities (Yeo et al., 2011).
Figure 1—figure supplement 8.
Figure 1—figure supplement 8.. Longitudinal changes in graph measures across age.
Cortical surface map showing t-statistics of significant age-related longitudinal changes in betweenness, degree, and eigenvector centrality.
Figure 1—figure supplement 9.
Figure 1—figure supplement 9.. Longitudinal changes in manifold eccentricity calculated using all eigenvectors.
(A) Generated eigenvectors (E1–E9) and (B) correspinding manifold eccentricity. (C) The t-statistics of regions showing significant longitudinal changes in manifold eccentricity across age are reported on the cortical surface. Effects are stratified along levels of cortical hierarchy (Mesulam, 1998) and intrinsic functional communities (Yeo et al., 2011).
Figure 1—figure supplement 10.
Figure 1—figure supplement 10.. Connectome manifolds estimated using group consistency method.
Spatial maps of three eigenvectors derived from group representative structural connectivity matrices based on different consistency thresholds are reported.
Figure 1—figure supplement 11.
Figure 1—figure supplement 11.. Structural connectome manifolds using a structural parcellation.
(A) A scree plot shows eigenvalues of each component, and the first three eigenvectors (E1, E2, E3) are shown on brain surfaces. (B) Manifold eccentricity. (C) The t-statistics of regions showing significant longitudinal changes in manifold eccentricity and (D) subcortical-weighted manifolds across age. The effects of manifold eccentricity are stratified along cortical hierarchy (Mesulam, 1998) and functional community (Yeo et al., 2011). For details, see Figure 1.
Figure 1—figure supplement 12.
Figure 1—figure supplement 12.. Longitudinal changes in edge weights of structural connectome.
Findings were stratified relative to seven intrinsic functional communities (Yeo et al., 2011). The matrix displays t-statistics of connections showing longitudinal changes in edge weights, and significant (false discovery rate [FDR] < 0.05) results are marked with asterisks.
Figure 1—figure supplement 13.
Figure 1—figure supplement 13.. Longitudinal changes in manifold eccentricity using a subset of participants who completed Tanner scale.
(A) Cortex t-statistics of age-related longitudinal effect. (B) Interaction effect between manifold eccentricity and Tanner scale. Colors of dots indicate Tanner stage of individuals, and lines indicate linear correlations between age and manifold eccentricity for individuals with the same Tanner stage.
Figure 1—figure supplement 14.
Figure 1—figure supplement 14.. Structural connectome manifolds using different template dataset.
(A–C) Structural connectome manifolds and association to age using different template cohort. Three representative cases are reported. For details, see Figure 1.
Figure 1—figure supplement 15.
Figure 1—figure supplement 15.. A schema of manifold eccentricity for three eigenvectors.
Each dot in the scatter plot represents a single brain region, and the colors matched with regions on the brain surface. The triangle in the middle of the scatter plot is the manifold origin, and all brain regions (i.e., dots) are connected to the origin with lines. Manifold eccentricity of a given region is the length (i.e., Euclidean distance) of this line.
Figure 2.
Figure 2.. Age-related effects on macro- and microstructural metrics of cortical anatomy.
(A) The t-statistics of identified regions that showed significant age-related changes in cortical thickness (upper row) and magnetization transfer ratio MT (bottom row), and stratification of t-statistics according to cortical hierarchy (Mesulam, 1998) and functional community (Yeo et al., 2011). (B) Age-related changes in manifold eccentricity after controlling for cortical thickness and MT.
Figure 3.
Figure 3.. Longitudinal changes in subcortical-weighted manifolds.
The t-statistics of age-related changes in subcortical-weighted manifolds. The effects of each subcortical region are reported on the radar plot. FDR: false discovery rate.
Figure 4.
Figure 4.. Transcriptomic analysis.
(A) Gene decoding process by associating t-statistics from the linear mixed effect model with post-mortem gene expression maps. (B) We identified genes that were spatially correlated with the input t-statistic map (false discovery rate [FDR] < 0.05) and selected only those that were furthermore consistently expressed across different donors (r > 0.5). These genes were input to a developmental enrichment analysis, showing strong associations with cortex, thalamus, striatum, and cerebellum during the childhood-to-adulthood time window. The degree of gene expression for developmental windows is reported on the bottom. The curve represents log transformed FDR-corrected p-values, averaged across the brain regions for each of the time windows reported on the bottom. ***FDR < 0.001, ** FDR < 0.01, *FDR < 0.05.
Figure 5.
Figure 5.. Intelligence quotient (IQ) prediction by baseline and follow-up measures of cortical and subcortical manifolds.
(A) Probability of selected brain regions across ten-fold cross-validation and 100 repetitions for predicting future IQ using only baseline manifold eccentricity (left), and both baseline and maturational change in the feature (right). Correlations between actual and predicted IQ are reported. Black lines indicate mean correlation, and gray lines represent 95% confidence interval for 100 iterations with different training/test dataset. (B) The prediction performance when both cortical and subcortical features were considered. MAE: mean absolute error.
Figure 5—figure supplement 1.
Figure 5—figure supplement 1.. Cognitive decoding of the selected regions for intelligence quotient (IQ) prediction.
(A) Probability of selected cortical and subcortical regions for predicting future IQ using both baseline and maturational changes (see Figure 5). (B) A word cloud derived by cognitive decoding using Neurosynth (Yarkoni et al., 2011).
Figure 5—figure supplement 2.
Figure 5—figure supplement 2.. Intelligence quotient (IQ) prediction using regression tree approach.
(A) The prediction performance using cortical features. Probability of selected brain regions across ten-fold cross-validation and 100 repetitions for predicting future IQ are represented on brain surfaces, and correlations between actual and predicted IQ are reported with scatter plots. (B) The prediction performance when both cortical and subcortical features were considered. For details, see Figure 5.

References

    1. Aglioti S. The role of the thalamus and basal ganglia in human cognition. Journal of Neurolinguistics. 1997;10:255–265. doi: 10.1016/S0911-6044(97)00020-1. - DOI
    1. Alexander GE, Crutcher MD. Functional architecture of basal ganglia circuits: neural substrates of parallel processing. Trends in Neurosciences. 1990;13:266–271. doi: 10.1016/0166-2236(90)90107-L. - DOI - PubMed
    1. Alexander-Bloch AF, Shou H, Liu S, Satterthwaite TD, Glahn DC, Shinohara RT, Vandekar SN, Raznahan A. On testing for spatial correspondence between maps of human brain structure and function. NeuroImage. 2018;178:540–551. doi: 10.1016/j.neuroimage.2018.05.070. - DOI - PMC - PubMed
    1. Altmann A, Ryten M, Di NM, Ravizza T, Tolomeo D, Reynolds RH, Somani A, Bacigaluppi M, Iori V, Micotti E, Botia JA, Absil J, Alhusaini S, Alvim MKM, Auvinen P, Bargallo N, Bartolini E, Bender B, Bergo F, Bernardes T, Bernasconi A, Bernasconi N, Bernhardt BC, Blackmon K, Braga B, Caligiuri ME, Cavalo A, Carlson C, Carr S, Cavalleri G, Cendes F, Chen J, Chen S, Cherubini A, Concha L, David P, Delanty N, Depondt C, Devinsky O, Doherty CP, Domin M, Focke N, Foley S, Franca W, Gambardella A, Guerrini R, Hamandi K, Hibar DP, Isaev DY, Jackson G, Jahanshad N, Kalviainen R, Keller S, Kochunov P, Kotikalapudi R, Kowalczyk MA, Kuzniecky R, Kwan P, Labate A, Langer S, Lenge M, Liu M, Martin P, Mascalchi M, Meletti S, Morita ME, O’Brien TJ, Pariente JC, Richardson MP, Rodriguez-Cruces R, Rummel C, Saavalainen T, Semmelroch MK, Severino M, Striano P, Thesen T, Thomas RH, Tondelli M, Tortora D, Vaudano AE, Vivash L, von PF, Wagner J, Weber B, Wiest R, Yasuda CL, Zhang G, Zhang J, Group E-EW, Leu C, Avbersek A, Consortium E, Thom M, Whelan CD, Thompson P, McDonald C, Vezzani A, Sisodiya SM. A systems-level analysis highlights microglial activation as a modifying factor in common forms of human epilepsy. bioRxiv. 2018 doi: 10.1101/470518. - DOI - PMC - PubMed
    1. Alves PN, Foulon C, Karolis V, Bzdok D, Margulies DS, Volle E, Thiebaut de Schotten M. An improved neuroanatomical model of the default-mode network reconciles previous neuroimaging and neuropathological findings. Communications Biology. 2019;2:370. doi: 10.1038/s42003-019-0611-3. - DOI - PMC - PubMed

Publication types

MeSH terms

Substances